Sep 27, 2016 - through services such as Apple CarPlay or Android Auto. This capability allows drivers to access a myriad of applications and services on their ...
Proceedings of the Human Factors and Ergonomics Society 2016 Annual Meeting
1874
A Visual Search Model for In-Vehicle Interface Design Ja Young Lee University of Wisconsin-Madison Madison, WI
Joonbum Lee MIT Age Lab and New England University Transportation Center Cambridge, MA
John D. Lee University of Wisconsin-Madison Madison, WI
As in-vehicle infotainment systems gain new functionality, their potential to distract drivers increases. Searching for an item on interface is a critical concern because a poorly designed interface that draws drivers’ attention to less important items can extend drivers’ search for items of interest and pull attention away from roadway events. This potential can be assessed in simulator-based experiments, but computational models of driver behavior might enable designers to assess this potential and revise their designs more quickly than if they have to wait weeks to compile human subjects data. One such model, reported in this paper, predicts the sequence of eye fixations of drivers based on a Boolean Map-based Saliency model augmented with top-down feature bias. Comparing the model predictions to empirical data shows that the model can predict search time, especially in cluttered scenes and when a target item is highlighted. We also describe the integration of this model into a web application (http://distraction.engr.wisc.edu/) that can help assess the distraction potential of interface designs.
Copyright 2016 by Human Factors and Ergonomics Society. DOI 10.1177/1541931213601427
INTRODUCTION The power of smartphones is now married to vehicles through services such as Apple CarPlay or Android Auto. This capability allows drivers to access a myriad of applications and services on their smartphone while driving. While useful, such interaction can draw drivers’ visual attention away from the road more frequently and for a longer period than is safe (Liang, Lee, & Yekhshatyan, 2012). Long eye glances away from the road can occur when drivers search for an object of interest in a complex in-vehicle interface (Tsimhoni & Green, 2001). Thus, it is important to identify how interface designs could be adjusted to avoid long off-road glances and support safer glance behavior while driving. Evaluating human-machine interface (HMI) designs in a driving simulator is the most common approach to understanding how design features of HMIs affect drivers’ search time and the number of long off road glances. Although behavioral data can offer a comprehensive assessment of design features, it is expensive and time-consuming to collect, especially for a large-scale design effort that involves assessing many alternatives. Given that novel systems require iterative testing of numerous design alternatives, computational models can play an important part of the design process, because they can evaluate many alternatives quickly. Such computational models can be integrated into a webbased application that can predict visual search times without designers needing to understand the details of the underlying theories of visual attention. This study extends and validates such a web-based application (J. Y. Lee & Lee, 2015). Visual saliency, or conspicuity, guides eye glances. Brighter, higher-contrast, and more colorful objects compared to others attract attention (Itti, Koch, & Niebur, 1998). Attention models formalize this intuition to estimate glance location or search time. Such bottom-up, purely stimulusdriven models are applicable to variety of stimuli and predict where people look when freely viewing images. Top-down, or goal-driven, factors also guide eye glances. Selective search or voluntary attentional tuning helps people
search for objects (Most & Astur, 2007). For example, people tend to attend to areas that are likely to contain information related to their goal (i.e., spatial biases). Also, people can filter irrelevant information based on visual features (i.e., feature biases). When a target object has a distinct feature such as shape, color, or orientation, viewers can filter other objects that do not retain the target feature (Treisman, 1985). People can also filter visual features based on how the object interacts with other objects (i.e., object-based and cognitive biases). Remarkable progress has been made to integrate bottomup and top-down theories of attention into computational models of attention. Some models integrate top-down features with statistical information regarding the target and background features (Navalpakkam & Itti, 2006) or by using high-level features, such as human faces (Judd, Ehinger, Durand, & Torralba, 2009). Overall, the visual scanpath predicted by such models corresponds to human behavior. This correspondence is measured using the adjusted area under the ROC curve (AUC). AUC counts the proportion of saliency map values above threshold and fixated as true positive and those above the threshold and non-fixated as false positive (AUC-Judd; see Riche, Duvinage, Mancas, Gosselin, & Dutoit, 2013). The best model prediction has an AUC of .87 when compared to mit300 data set, which is a benchmark data set containing 300 natural images and eye tracking data from 39 observers, and to cat2000 data set, which is another benchmark data set containing 2000 images from 20 different categories with 24 observers. As a baseline, the prediction of infinite observers, extrapolated from the sample of observers, has an AUC of .92 in mit300 and .90 in cat2000 (MIT Saliency Benchmark). Models of scanning agree with the benchmark data nearly as well as data from other people. Most of these models, however, are limited to predicting the scanpath in free viewing conditions. Predicting search time for a specific target represents an important challenge, because target search requires a dynamic reassessment of the visual field and may depend on top-down influences. Itti & Koch have (2000) developed a search mechanism with bottom-up features, such as color, contrast, and orientation, which does
Downloaded from pro.sagepub.com at HFES-Human Factors and Ergonomics Society on September 27, 2016
Proceedings of the Human Factors and Ergonomics Society 2016 Annual Meeting
1875
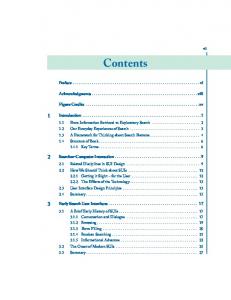
not provide reliable predictions, generally underestimating search time. Lee, Lee, & Salvucci (2013) modified the Itti & Koch saliency map to predict the time people would take to find a target icon on a map display. Lee (2014) further extended the modified Itti & Koch model to predict drivers’ glance behavior by implementing spatial expectation (i.e., topdown effect) and integrated the saliency map and a cognitive architecture, Distract-R. This study presents a model to estimate visual search time based on better performing saliency model, a Boolean Mapbased Saliency (BMS) model (Zhang & Scaffold, 2013). We augment the model to include a feature bias and information about the sequence of eye fixations. METHODS This study compares the augmented BMS model to empirical data and model predictions from a previous study that used bottom-up features to predict visual search time (J. Lee et al., 2013). The model from this previous study is referred to as modified Itti & Koch, as it modified the Itti & Koch (2000) model by implementing a Monte-Carlo technique to account for glance duration variability. Validation Data Participants were seated in a driving simulator, but they did not drive, because the focus of the original study was to understand search behavior. Participants were instructed to search for target icons on a map and to press a button to indicate when they found the target. Two independent variables (set size and salience) were manipulated to investigate their effect on search performance. Participants. Consistent with the age-distribution suggested by National Highway Traffic Safety Administration (NHTSA) visual manual guidelines (National Highway Traffic Safety Administration, 2013), a total of 30 participants (15 male and 15 female) were recruited from four age groups (eight between 18-24 years, eight between 25-39 years, seven between 40-54 years, and seven between 55-75 years). Icons. A total of 27 icons were selected from an icon pool (MapBox, 2013). The icons were approximately the same size, and icon colors were the same (Figure 1). There was one “target” icon in each search task, and the target icon was randomly placed on a virtual 3 x 3 grid. Design. Three levels of icon set size (9, 18, and 27) were manipulated to assess the effect of the number of icons on search time. Three salience conditions were also manipulated: (1) low-salience condition (all icons were in the same gray color), (2) high-salience condition (target icon was colored), and (3) misplaced salience condition (one of the non-target icons was colored). These variables were combined in a repeated-measures within-subjects design: 3 (set size: 9, 18, and 27) x 3 (salience: low saliency, high saliency, and misplaced saliency). With nine possible locations of icons, a total of 81 (e.g., 3 x 3 x 9) map images were available. Each participant viewed all images on a plasma display (42” diagonal measurement, 130o horizontal and 24o vertical field of view at 48” viewing distance).
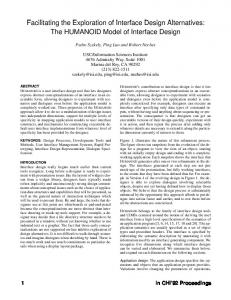
Figure 1 An example of visual stimulus (Trial #09). Procedure. Informed consent was obtained from each participant before they completed a demographic survey. Participants were seated in the simulator and given instructions. Each participant completed five practice trials. During the experiment, a target icon was presented in the upper left corner of the screen for one second, and then a map was presented on the center of the screen until the participant pressed the space bar to indicate detection of the target. The participants then verbally reported the location of target. Incorrect responses and outliers more than three standard deviations from the overall mean were replaced with the individual participant’s mean, consistent with previous research (Fleetwood & Byrne, 2006). Boolean Map Saliency-Based Visual Search Model We built our search model on the Boolean Map-based Saliency model (BMS) (Zhang & Sclaroff, 2013). It was the 4th most accurate saliency algorithm among 51 models (with mit300 data set) and 3rd most accurate among 18 models (with cat2000 data set) according to the MIT Saliency Benchmark (http://saliency.mit.edu/ results_mit300.html). BMS identifies objects based on the tendency of surrounding regions to be seen as a figure, which separates them from the background, and then computes saliency according to a Boolean map (Huang & Pashler, 2007). We combined this saliency map with an expectation map to account for potential top-down effects. The experimental stimuli were maps that consist of roads, road names, arrows (one-way indicators), numbers (street numbers), and icons (building indicators). As the target of each visual search task was always an icon, consequently we expected people to suppress their attention to other features (e.g., road names, arrows, etc.). As the target icons were approximately square and the distractors such as road names or arrows were rectangular, we overlaid an expectation map that suppresses rectangular objects. A resulting saliency map shows the most salient areas in white and less salient areas in grey, and the least salient in black (Figure 2).
Downloaded from pro.sagepub.com at HFES-Human Factors and Ergonomics Society on September 27, 2016
Proceedings of the Human Factors and Ergonomics Society 2016 Annual Meeting
1876
Figure 2 An example of a saliency map (left) and a combined map (right) for a single stimulus (Trial #09). The fixation sequence was simulated using this combined map. Human eyes saccade rapidly over roughly 2.5 - 20 degrees to locate a target (Land, Mennie, & Rusted, 1999), fixate on one point, and process detailed information from about 2.0 degrees around the fixated point (Henderson & Hollingworth, 1999). Our algorithm assumed that eyes fixate on different locations of the image until the focal area overlaps with the region of interest (ROI) where a target icon is located. The probability of fixating on a particular location was proportional to its saliency. The saliency map was divided into multiple cells where each cell subtends 2.0 degrees, and the probability of eye fixation was calculated as the formula (1) below. When there are n total cells, the possibility of eye fixation moving from cell i to cell j (Pij) was determined based on the saliency of cell i (si) and cell j (sj):
Pij =
sj n
∑s
k
− si
k=1
(1)
Each fixation added 330ms to the total search time (Henderson & Hollingworth, 1999). A cell that has been visited was not visited again, reflecting the inhibition of return (IOR) that prevents the model from endlessly circling around the most salient object (Itti & Koch, 2000). The search terminated once a fixation arrived at the ROI, and corresponds to the end of the off-road glance. The process was repeated 30 times to replicate 30 participants in the validation experiment. Web-based Application We developed a web application to simulate eye fixations based on the BMS model (http://distraction.engr.wisc.edu/). Any designer can upload two image files, select ROIs, and set five input parameters: screen size (width and height, in pixels), screen dimensions (width and height, in millimeters), and the distance from the driver to the image (in millimeters). Pressing the “Simulate” button executes 1000 trials of visual search and shows the results as Pareto graphs, which show the distribution of glances and the proportion of glances longer than two seconds. As described in the previous section, this application calculates visual search time based on the saliency of objects and the top-down effects of feature bias -rectangular areas with specific ratio are suppressed.
Figure 3 Interface of web application, showing the region interest selection, saliency map, and simulation results. RESULTS According to the validation experiment, reaction time increased as the set size increased, F(2, 58) = 107.0, p < .001, partial = .79 and decreased with higher salience, F(2, 58) = = .16. The interaction effect was 5.43, p < .01, partial significant, F(4, 116) = 3.23, p < .05, partial = .10. Posthoc analyses using a paired t-test showed that there was no significant difference in reaction time between the misplaced and low saliency conditions, while the reaction time in the high saliency condition was shorter than low and misplaced condition, t(29) = -3.57, p < .01, partial = .31; t(29) = -2.34, p < .05, partial = .16. The BMS-based visual search model also captured the main effect of the set size, F(2, 58) = 4.90, p < .05, partial = .14, and of saliency, F(2, 58) = 98.0, p < .001, partial = .77 as well as the interaction, F(4, 116) = 4.71, p < 0.01, partial = .14. Post-hoc analysis also resembled the results of the experiment. The reaction time was shorter in high saliency condition compared to low and misplaced, t(29) = -10.7, p < .001, partial = .80 and t(29) = -13.6, p < .001, partial 2 = .86. In contrast to the experiment, the reaction time for the low salience condition was shorter than in the misplaced condition, t(29) = -3.9, p < .001, partial = .35. The distribution of predicted reaction time resembled the reaction times from the validation experiment. According to the Kolmogorov-Smirnov test, BMS-based visual search model had smaller distance (maximum distance between two cumulative probability curves, D = .12) than the modified Itti & Koch model (D = .15), indicating better predictions. To estimate the upper-theoretical performance limit of the model, we followed a split data design technique used to evaluate a visual attention model (3M Commercial Graphics Division, 2010). When divided 30 participants into two groups (N = 15 each) and compared the distribution of reaction times, the D value was .11. It implies that the BMS-based model can predict the reaction time with accuracy similar to that achieved
Downloaded from pro.sagepub.com at HFES-Human Factors and Ergonomics Society on September 27, 2016
Proceedings of the Human Factors and Ergonomics Society 2016 Annual Meeting
the simulation results of BMS-based model, and the dotted line indicates the modified Itti & Koch model. The BMSbased visual search model closely matched the empirical data in most conditions, especially for large set size conditions and high saliency conditions. The reaction times predicted by the modified Itti & Koch model were generally shorter than the empirical data, but predicted reaction times better than the BMS-based model in smaller set size and in the low and misplaced saliency conditions.
with data collected from people. Similarly, the AndersonDarling test, which puts more emphasis on the distribution tails, showed that the BMS-based model replicates the experiment results more closely (A2 = 36) than modified Itti & Koch model (A2 = 103), and it was close to another group of participants (A2 = 13). The cumulative distributions of reaction time for each experimental condition (Figure 4) highlight the strengths and weaknesses of the two models. The solid line indicates the validation data from the participants, the dashed line indicates Data Source
BMS−Based Visual Search 9
1.00
1877
Experiment
Modified Itti & Koch
18
27
high
Cumulative proportion of responses
0.75 0.50 0.25 0.00 1.00 0.75 low
0.50 0.25 0.00 1.00
misplaced
0.75 0.50 0.25 0.00 0
5
10
15 0
5
10
Reaction Time (s)
15 0
5
10
15
Figure 4 Cumulative distributions of reaction time for each condition and the associated model predictions.
DISCUSSION This study assesses a model that simulates drivers’ eye fixation to HMIs and predicts visual search time for a target object. Our extension to the BMS-based visual search model considers both bottom-up effect of attending to salient object and top-down effect of filtering irrelevant stimuli, producing an integrated attention map that depicts both bottom-up and top-down effects. This model also included features used in the modified Itti & Koch model, such as inhibition of return. Overall, this model predicted visual search time well, particularly when the scene was cluttered with over nine icons. Also, the model worked well when a target is highlighted, suggesting that the model correctly reflects the benefit of the target object also being the salient object in the scene. This validation suggests that a web application can quickly assess the distraction potential of interface designs and complement the more resource-intensive driving simulator based evaluations (J. Y. Lee & Lee, 2015). The BMS model, however, overestimated visual search time in the low or misplaced saliency conditions when there were a small number of objects in the scene. This may be due
to how we implemented the inhibition of return. In the BMS model, which we used to calculate the bottom-up saliency of the scene, when one object (or a patch that includes the object) is highly salient, it suppressed all other objects and caught visual attention. Once the object received attention, it is never revisited; the probability of fixated patch was set to zero and distributed to other patches. Because the saliencies of remaining patches are equally low, the next eye fixation was rather random. This led to more fixations to find the target object. In reality, it is possible that a viewer locally inhibits the currently attended object, after fixating the object. This inhibition would exclude highly salient object that is already attended from the scene and give priority of eye fixation to next salient objects rather than background of a scene. In the model, this effect of ignoring all other non-salient objects was diluted as the set size increases, because the viewer had to scan up to 26 items even though icons were separated from the background. Thus the accuracy of the model increased with larger set size. Itti & Koch model’s approach could be an alternative to solve this problem. In Itti & Koch, a global inhibition is triggered and completely resets all regions, once the attention is shifted to the most salient location (i.e., location of the
Downloaded from pro.sagepub.com at HFES-Human Factors and Ergonomics Society on September 27, 2016
Proceedings of the Human Factors and Ergonomics Society 2016 Annual Meeting
winner neuron). Local inhibition is also activated, so object visited is not re-visited and the next salient location could be captured (Itti et al., 1998). The BMS-based search model filtered out areas that contain rectangular, non-square object, as the target items are known to be square. This improve the model predictions, especially when the target objects were highly salient or the scene was visually complex, by preventing the model from attending to less salient but still distracting objects. However, it impaired prediction when the target object was not salient. Beyond shape that can filter rectangular regions, there may be other top-down effects that guide attention. People may selectively attend to specific areas that are likely to contain information related to the goal or areas that are related by law of physics or causality. For example, you may attend to the right half of the screen to find a list of songs or follow an arrow to find target information. Such factors can be implemented in the future models. The current study used maps as stimuli and estimated visual search time by simply filtering irrelevant features and attending to visually salient objects. The correspondence between the model predictions and experiment data shows the potential of the BMS-based visual search model to identify how design features might lead to long off-road glances. However, not all distracting tasks are search tasks, and greater familiarity with an interface greatly reduces the role of visual search. Even so this model could identify potential distracting features, particularly for those drivers who are unfamiliar with the interface. The online tool provides convenient access to this model. This tool can be used to compare alternative interface designs and make decisions in the early phase of product development. In addition, the use of the model and the tool is not limited to displays. It could be extended to simulate visual search on larger interior area, such as the dashboard. This validation provided useful information regarding the strength of the current model and potential improvements. This BMS-based visual search model also has a potential to be embedded in a larger model that simulates driver behavior and accounts for dynamic environmental factors such as task structure (J. Y. Lee, Gibson, & Lee, 2015) or errors (J. Y. Lee, Gibson, & Lee, 2016). ACKNOWLEDGEMENT The data presented in this paper were collected as part of a project sponsored by the National Highway Traffic Safety Administration (NHTSA) under Contract No. DTNH22-11-D00237 and other parts of this study were published as a NHTSA technical report. The authors would like to thank Susan Chrysler, Joel Cooper, Dawn Marshall, and Daniel McGehee for supporting data collection. Joonbum Lee’s work is supported by the Toyota Class Action Settlement Safety Research and Education Program. The views and conclusions being expressed are those of the authors, and have not been sponsored, approved, or endorsed by Toyota or plaintiffs class counsel.
1878
REFERENCES 3M Commercial Graphics Division. (2010). 3M Visual Attention Service Validation Study. http://solutions.3m.com/3MContentRetrievalAPI/ BlobServlet?lmd=1371740697000&locale=en_WW&assetType=MMM _Image&assetId=1361624948678&blobAttribute=ImageFile&WT.mc_i d=www.3m.com/VASstudy Administration, N. H. T. S. (2013). Visual-Manual NHTSA Driver Distraction Guidelines for In-Vehicle Electronic Devices (Docket No. NHTSA2010-0053). Bylinskii, Z., Judd, T., Borji, A., Itti, L., Duran, F., Oliva, A., & Torralba, A. (n.d.). MIT Saliency Benchmark. Retrieved from http://saliency.mit.edu/ Fleetwood, M., & Byrne, M. (2006). Modeling the Visual Search of Displays: A Revised ACT-R Model of Icon Search Based on Eye-Tracking Data. Human-Computer Interaction, 21, 153–197. Henderson, J., & Hollingworth, A. (1999). High-level scene perception. Annual Review of Psychology. Huang, L., & Pashler, H. (2007). A Boolean map theory of visual attention. Psychological Review. Itti, L., & Koch, C. (2000). A saliency-based search mechanism for overt and covert shifts of visual attention. Vision Research, 40, 1489–1506. Itti, L., Koch, C., & Niebur, E. (1998). A model of saliency-based visual attention for rapid scene analysis. IEEE Transactions on Pattern Analysis & Machine Intelligence, 20, 1254–1259. Judd, T., Ehinger, K., Durand, F., & Torralba, A. (2009). Learning to predict where humans look. In 2009 IEEE 12th International Conference on Computer Vision (pp. 2106–2113). IEEE. Land, M., Mennie, N., & Rusted, J. (1999). The roles of vision and eye movements in the control of activities of daily living. Perception, 28, 1311–1328. Lee, J. (2014). Integrating the saliency map with distract-r to assess driver distraction of vehicle displays. University of Wisconsin-Madison. Lee, J., Lee, J. D., & Salvucci, D. D. (2013). A Saliency-Based Search Model: Application of the Saliency Map for Driver-Vehicle Interfaces. Proceedings of the Human Factors and Ergonomics Society Annual Meeting, 57, 1933–1937. Lee, J. Y., Gibson, M. C., & Lee, J. D. (2016). Error Recovery in Multitasking While Driving. In Proceedings of the 2016 CHI Conference on Human Factors in Computing Systems - CHI ’16 (pp. 5104–5113). New York, New York, USA: ACM Press. Lee, J. Y., Gibson, M., & Lee, J. D. (2015). Secondary task boundaries influence drivers’ glance durations. In Proceedings of the 7th International Conference on Automotive User Interfaces and Interactive Vehicular Applications - AutomotiveUI ’15 (pp. 273–280). New York, New York, USA: ACM Press. Lee, J. Y., & Lee, J. D. (2015). A Web-Based Evaluation Tool to Predict Long Eye Glances. In 8th International Driving Symposium on Human Factors in Driver Assessment, Training, and Vehicle Design. Liang, Y., Lee, J. D., & Yekhshatyan, L. (2012). How Dangerous Is Looking Away From the Road? Algorithms Predict Crash Risk From Glance Patterns in Naturalistic Driving. Human Factors: The Journal of the Human Factors and Ergonomics Society, 54, 1104–1116. Most, S. B., & Astur, R. S. (2007). Feature-based attentional set as a cause of traffic accidents. Visual Cognition, 15, 125–132. Navalpakkam, V., & Itti, L. (2006). An Integrated Model of Top-Down and Bottom-Up Attention for Optimizing Detection Speed. In 2006 IEEE Computer Society Conference on Computer Vision and Pattern Recognition - Volume 2 (CVPR’06) (Vol. 2, pp. 2049–2056). IEEE. Riche, N., Duvinage, M., Mancas, M., Gosselin, B., & Dutoit, T. (2013). Saliency and Human Fixations: State-of-the-Art and Study of Comparison Metrics. In The IEEE International Conference on Computer Vision (ICCV). Treisman, A. M. (1985). Preattentive processing in vision. Computer Vision, Graphics, and Image Processing, 31, 156–177. Tsimhoni, O., & Green, P. (2001). Visual Demand of Driving and the Execution of Display-Intensive in-Vehicle Tasks. Proceedings of the Human Factors and Ergonomics Society Annual Meeting, 45, 1586– 1590. Zhang, J., & Sclaroff, S. (2013). Saliency detection: a boolean map approach. IEEE International Conference on Computer Vision (ICCV), 153–160.
Downloaded from pro.sagepub.com at HFES-Human Factors and Ergonomics Society on September 27, 2016