A Visualization Tool for Calculating the Genetic Substitution Patterns ...
Recommend Documents
a browser based application which provides complete syntactical structure ... software to run. It works on all browsers. ... Electron Devices, vol. ED-11, no. 1, pp.
If such applications are Grid based, in the sense that data hosting and ... (Geographical Information Systems) domain, but not necessarily easy, or cheap, to deploy. ... The nature of the UK Census at the time meant that the microdata's.
Key-Sun Choi, Yongseok Choi, Jonghoon Oh, Choongwon Seo, ... tool for morphological analysis. This tool is to show all of the steps in-between the internal.
[3] Framklyn A Howe and Kirstie S Opsad. 1H MR spectroscopy of brain tumours and masses. NMR Biomed,. 16(3):123-131, May 2003. [4] Carlos Majos Torro.
Abstract â This paper will present a visualization tool for comparing images of paintings. The method starts with two types of images, one showing the color ...
a standard anatomy by manipulation of the geometry of parts e.g. tall people, .... Answer keys can also be gen- erated by .... Prentice-Hall, Inc., 1976. 16] G. Farin ...
machine used is our SMILE Beowulf cluster [3,4]. ... Use an MPEG encoder application to convert a series of bit map images into MPEG-1 movies. Again ...
Jun 20, 2016 - a SharePoint server 2010 with the underlying data warehouse retrieved from .... Data mining, data analytics, and web dashboardsâ Governance.
Abstract. Knowledge discovery is the most desirable end product of an enterprise ... optimizations, data structures and genetic operators. ... als, providing general heuristics for exploration. ..... Classification of a vehicle by its silhouette. v e
2R&D Department, Zend Technologies Inc.,. 19200 Stevens .... To prepare this
paper, we imported into NeuViz the CSV files from January 2012 to May 2013.
Jul 7, 2010 - edge on programming and complex data handling can visualize the ... First, a file formatted for upload as a âcustom trackâ on the UCSC.
Excel workbook, (b) âlockâ text within the spreadsheets so that terms and labels are not mistakenly edited, (c) hide spreadsheet information such as computation ...
Jul 11, 2012 - with the full-potential all-electron codes exciting and WIEN2k as well as the ... Email address: [email protected] (Rostam.
Official Full-Text Paper (PDF): ElaStic: A universal tool for calculating elastic constants from first principles. ... and Reuss averaging procedure in order to obtain an evaluation of the bulk, .... Email address: [email protected] (Rostam.
Although it is sometimes hard to keep several environmental risks topical ..... Soil and Water external costs can be calculated as repair costs or from impact on .... For example, if a truck drives a certain distance with full load and empty on.
Apr 11, 2012 - field of weakly nonlinear waves, monochromatic at first order in wave slope and ... journal homepage: www.elsevier.com/locate/cageo.
Sep 18, 2015 - While researchers favor the likelihood ratio framework, few open-source software solutions with a graphical user interface implementing these ...
AbstractâMonitoring and adjusting calibrations of various satellite imagers is often exacerbated by differences in their spectral response functions (SRFs).
Faculty of Architecture and Town Planning, Technion â Israel Institute of ..... and De Cesarei 2007), and 3) facilitating synergistic energy between multiple audience members ...... Scenic beauty of river views in the Grand Canyon: relating.
A further visualization tool provided by BioJake is the representation of. Activation .... which queries are available for execution on the specified server and the.
It consists of three major components: Demo Mode, Practice .... Students in the course typically are computer science majors taking the course as an elective.
application software, a visualization of all the exchanged network data is of major ... user interfaces (we consider Analyzer [2] as one of the best of these tools ...
The CiteWiz prototype system running under Windows. finally, for an ... In this paper, we present CiteWiz, a tool for bibliographic visualization of the ..... KaâPing Yee ..... graphics card and a 19-inch monitor with the display resolu- tion set t
formation Science EducationâComputer science education, information .... the class. Extra credit was offered to anyone who used the software and completed the survey. 3. ..... available online and new tools SHAvisual and AESvisual for.
A Visualization Tool for Calculating the Genetic Substitution Patterns ...
Jun 14, 2015 - ABstArct: We developed simulation tool for influenza virus variation (SimFluVar), ... analytical software that calculates genomic variation among.
A Visualization Tool for Calculating the Genetic Substitution Patterns Between Two Different Groups Insung Ahn1,*, Jin-Hwa Jang1,2,*, Ha-Yeon Kim2, Ji-Hae Lee2,3 and Hyeon Seok Son2,3 1
Biomedical Prediction Technology Laboratory, Korea Institute of Science and Technology Information, Yuseong-gu, Daejeon, Republic of Korea. 2Laboratory of Computational Biology and Bioinformatics, Institute of Health and Environment, Graduate School of Public Health, Seoul National University, Gwanak-gu, Seoul, Republic of Korea. 3Graduate Program in Bioinformatics, College of Natural Science, Seoul National University, Gwanak-gu, Seoul, Republic of Korea. *These authors contributed to equally at this work.
Abstarct: We developed simulation tool for influenza virus variation (SimFluVar), an analytics software for calculating genomic variation among members of the influenza virus group. This study is related to computational evolutionary biology and evolutionary bioinformatics. SimFluVar is an analytical tool that can be used to calculate codon substitution patterns of viral genes. Designed to compare a large number of nucleotide sequences, SimFluVar provides precise patterns of codon variations between two viral groups, especially for the influenza virus. SimFluVar also provides useful functions, such as editing and visualization of the result matrix. This new tool can be used to analyze codon variation patterns over time as well as to analyze the genomic differences between viruses obtained from different geographical locations. SimFluVar is developed in C++, and Java RCP is used as a distribution package. SimFluVar, including the associated documentation, manuals, and examples, is publicly available at http://lcbb.snu.ac.kr/simfluvar. Keywords: influenza A virus, simulation, codon variation, transition matrix, GC pattern Citation: Ahn et al. An Analytical Tool for Calculating the Codon Substitutions Between Different Groups of Influenza Viruses. Evolutionary Bioinformatics 2015:11 179–183 doi: 10.4137/EBO.S28844. TYPE: Original Research Received: April 28, 2015. ReSubmitted: June 14, 2015. Accepted for publication: June 22, 2015. Academic editor: Jike Cui, Associate Editor Peer Review: Four peer reviewers contributed to the peer review report. Reviewers’ reports totaled 922 words, excluding any confidential comments to the academic editor. Funding: This work was supported by the HPC-enabled Convergence Technology Research Division at the Korea Institute of Science and Technology Information (K-15-L03-C02-S03), which is gratefully acknowledged. The authors confirm that the funder had no influence over the study design, content of the article, or selection of this journal.
Background
Prediction of the evolution of genes encoding surface protein hemagglutinin (HA) and neuraminidase (NA) of the influenza virus is essential. This allows for the development of vaccines against influenza viruses that could cause new epidemics through genetic reassortment.1 For example, in 2009, a pandemic outbreak of influenza A (H1N1) occurred due to an antigenic shift and, in the course of 1 year and 2 months, resulted in 18,500 deaths in more than 214 countries.2,3 Outbreaks of influenza virus H7N9 have occurred mainly in birds; however, its ability to infect humans as well was reported in 2013. H7N9 viruses infect humans through a multiple reassortment of influenza virus types, including H7N3, H7N9, and H9N2.4 Thus, it is important to predict the novel sequence variations in these viruses every year to prevent pandemics. Recently, a fitness model was developed for HA proteins, which allows for the predictions of the evolution of the viral population annually. This model correctly predicted an exact match to the strain of influenza A virus that caused a pandemic in 2013.5 EpiCombFlu is a Web resource that integrates epitope data of influenza viruses to find a combination of conserved epitopes that have the potential to be used in a universal influenza vaccine.6 In addition, increasing effort is being invested into developing codon substitution models. In 1994, Goldman
and Yang7 presented a codon-based model of the evolution of protein-coding DNA sequences, which could be implemented for phylogenetic estimation. They used the Markov process to describe substitution between codons. Arenas and Posada8 developed a program named Recodon that could simulate possible coding DNA sequences under complex scenarios in which several evolutionary forces could be interacting simultaneously. Subsequently, they developed an algorithm that could simulate the evolution of coding sequences with the help of an ancestral recombination graph that represented the genealogies for each nucleotide site. This algorithm allowed for intracodon recombination and was implemented in a computer program called NetRecodon.9 However, the simulation tools available are insufficient to target every codon sequence of the pandemic influenza virus in a user-friendly format, with the ability to enable direct viewing and editing. In a previous study, we suggested a method for predicting the evolutionary pattern of the genetic sequence of influenza virus.10–12 We reported the evolution of the human-origin influenza A virus (H3N2) gene by analyzing the codon usage patterns and developed a computational model to analyze the evolutionary patterns of the NA gene of influenza A/H1N1.10,11 Recently, we also developed a simulation tool, named SimFlu, for influenza viruses.12 Using the Evolutionary Bioinformatics 2015:11
179
Ahn et al
codon variation parameters included in the library of the SimFlu package, SimFlu can be used to generate possible future variant sequences. The SimFlu library provides precalculated codon variation parameters for the H1N1, H3N2, and H5N1 subtypes of influenza A virus, isolated between 2002 and 2011. In order to allow researchers to simulate variant sequences using their own variation parameters rather than the SimFlu library default data, we developed the simulation tool for influenza virus variation (SimFluVar). SimFluVar is an analytical software that calculates genomic variation among influenza virus groups. Using the SimFluVar program, a user can analyze the codon variation patterns of two different groups, and its result matrix can be directly used as a user parameter in the SimFlu program.
Implementation
SimFluVar is a program belonging to the SimFlu (simulation tool for influenza virus) series; its modification parameters, in 61 × 61 formations, are calculated based on the year-to-year modification patterns extracted from empirically discovered influenza virus gene information.11 Installation. Setup can be done automatically by simply executing the distributed setup program using a Java Runtime Environment. After downloading SimFluVar from http:// lcbb.snu.ac.kr/simfluvar/product.html onto the PC, the program is run by double-clicking on the “SimFluVar2013_xxxx. setupexe” file. Upon entering all the required information regarding the setup, you will be taken to the next screen, where the final setup will take place. Data preparation. First, to activate the SimFluVar program, multiple sequence alignment (MSA) needs to be executed between sequences from two subject years (Fig. 1A and B). In the example illustrated in the figures, sequences for “Group1” and “Group2” were named “Group1.seq” and “Group2.seq,” respectively. The two files collected by the user will initially be subjected to implementation of MSA by using programs such as ClustalW13; for the above example, a new file combining sequences of Group1 and Group 2, “Group1- Group2_MSAinput.seq,” was generated and used as the input file for MSA. Subsequently, the result file (“Group1-Group 2_MSAOutput.seq”) was created, which conformed to the FASTA file format, and contained “gaps,” with no special restrictions on sequence title annotations. Once the above-mentioned steps have been followed and the MSA process for T1 and T2 groups, which are two subject years, has been successfully executed, preparation required for activating the SimFluVar program is considered completed. Counting the codon substitution. To start SimFluVar, the result file containing gaps generated by MSA should be divided into two separate files, each containing one individual group, Group1 or Group2 (Fig. 1C and D). Once the input pair is recognized, SimFluVar recognizes modification patterns in each codon location by comparing all sequences 180
Evolutionary Bioinformatics 2015:11
of the Group1 slot with all sequences of the Group2 slot at the corresponding codon level. In other words, sequences of the Group1 slot (Group1_ #1, #2,…, #n, where n represents the total number of sequences in Group1) and sequences of the Group2 slot (Group2_ #1, #2,…, #p, where p represents the total number of sequences in Group2) make up a counting matrix (CM) in which the modification of codons at each codon location are measured, resulting in n × p instances of comparison. Subsequently, this CM generated from sequences of influenza viruses occurring during outbreaks in consecutive years is converted into the Markov model’s transition matrix (TM).14 This TM can be used as a user parameter for the SimFlu program (http://lcbb.snu.ac.kr/simflu). G + C content on the wobble position. The pattern of G + C content (in percentage) is a metric of the change in base composition at each codon’s wobble codon position (the third nucleotide in a codon), presented as amino acids encrypted by individual codons. All values are indicated in percentage against total bases, and the data considered to determine this percentage will be provided adjacent to the percentage value. The GC pattern view in the output data folder is divided into two views: one that displays the outputs for the GC pattern matrix in table format and one that displays the outputs for the matrix in chart format. Visualization and editing. CM and TM windows consist mainly of two tabs: a tab for viewing the output in table format and a tab for viewing the output of graphs in the “Heat map” format (Fig. 1E). The control box on the right side enables users to change shapes and colors in the Heat map. The “Heat map scale” function allows users to enlarge or reduce the Heat map, and the “Outline Color” function assigns colors to the outline of the small rectangle blocks in the Heat map view. High, middle, and low colors determine the manner in which colors are displayed within the Heat map matrix. The color scale sets up the scale of color distribution. The closer this value is to zero, the clearer the distinction is between the blocks. Therefore, to effectively view the subtle distinction between blocks, you can lower this value. In the Color map window, “Color item” represents the color of the output block of interest and the “Color key” signifies the Red-Green-Blue (RGB) value of the color. “Count” represents the number of current values matched with the Color. “Values” signifies the actual value of the applicable cell. In the Color map window, on double-clicking the color box at the top of the Color column, a dialogue box will appear that enables users to select colors. Once the new colors have been designated in this box, the selected colors will be changed to the newly designated ones, which will be reflected in the Heat map accordingly. Finally, “Save heat map” is a function that allows users to convert the heat map matrix on the screen into a specific image file and store it. On this screen, the user can designate the file format and the file name to be used, with extension, including PNG, JPG, BMP, GIF, and PDF (Fig. 2).
Simulation tool for influenza virus variation
A
Input sequence groups
B
Multiple sequence alignment (MSA)
Group1.seq
Group2.seq
Group1-Group2_MSA_input.seq Group1-Group2_MSA_Output.seq Divide into each group
Input files for SimFluVar C divided into the group1 (a) and group2 (b)
D
Calculate codon variations using SimFluVar
E
SimFluVar’s output files
Counting matrix
G + C% pattern Transition matrix
Group1-Group2_a.seq
Group1-Group2_b.seq
Group1-Group2_SimFluVar_Count.xls
Group1-Group2_SimFluVar_GC pattern.xls
Group1-Group2_SimFluVar_TM.txt
Group1-Group2_SimFluVar_Summary.xls
Figure 1. The SimFluVar work flow. The figure on the left; (A) Group the target sequence for observed codon variation. (B) Perform multiple sequence alignment using ClustalW based on the group sequence and then save the result file (.seq). (C) Generate the MSA result file, which is divided into the two groups group1 and group2 for input to SimFluVar. (D) Calculate the codon variation by running SimFluVar. (E) Creating the output folder, including the codon CM, the G + C percent pattern, and the TM. The figure on the right shows the analytical process of SimFluVar. Based on the results of MSA, Count.xls, GC pattern.xls, TM.txt, and Summary.xls are generated automatically through the calculation process of n × n codon transitions.
Figure 2. Main screen of SimFluVar. (A) Input data; when you install SimFluVar, it comes with “Test_Project” to help users understand the tool. Input data folder in Test1 has the result of the MSA a.seq and b.seq, which include five test sequences. (B) CM and Heat Map View; in output data folder, the count results are shown in a 61 × 61 CM, and the number of codon transition positions between the two groups is shown. In addition, it provides the heat map view, which can be adjusted scale, color, and gradient. (C) GC Pattern and GC Pattern Graph; GC pattern shows the results obtained on calculating the variation in the amino acids at the wobble codon position in percentage, and the GC pattern graph allows users to view the overall composition (GC in%) at a glance. (D) TM and Heat Map View; TM shows the amino acid substitution mutation probability for each of the two input sequences, which can be used as a user parameter in the SimFlu program. It also provides a heat map view to allow for the comparison of amino acid transitions in the two groups.
Evolutionary Bioinformatics 2015:11
181
Ahn et al
SimFluVar application. The calculation algorithm, which is the core of the SimFluVar program, was verified for its applicability in predicting the evolution of influenza viruses in a study published in 2012.10 In our current report, we evaluate the positive selection patterns and evolutionary mutation processes in influenza A/H1N1 from 1999 to 2009 by using the algorithms of SimFluVar. Our results show that when the NA gene extracted from Taiwan human oriented influenza H1N1 subtype (DQ249252) in 1999 was used as a seed sequence, the NA gene of influenza A virus extracted in 2000 had the highest similarity (60.0%), as determined by a similarity search based on influenza virus gene sequences registered in National Center for Biotechnology Information. Further, sequences predicted based on the TM from 2005 to 2008sequence similarity increase from 2005 (37.2%) to 2008 (48.5%). This result represented the sequence with the highest similarity to the actual sequence in 2008. Thus, simulation that is applied to variation parameters can change directionality based on the seed sequence. Sequences generated by the variation of parameters to reflect those of 2008 especially show similarity to sequences of the influenza virus H1N1, which occurred in 2009. The findings of this research suggest that the main cause of sudden influenza pandemics is not only an antigenic shift but also a virus-specific directional variation pattern. The TM calculated in SimFluVar files is available directly in the user parameters in the SimFlu program. In addition, we used the SimFluVar to perform the analysis using a variety of nucleotide sequences, not only of the influenza virus but also of other viruses. The genome sequence from Genbank (www.ncbi.nlm.nih.gov/genbank/) for the extracted virus subtype1 (DENV-1) from South America is entered as the input file. In addition, SimFluVar can conduct the comparison of codon variation in each targeted year. The results are shown in TM and Heat map view in Figure 3. Using the heat map view of SimFluVar, we compared the codon substitution patterns of type 1 Dengue virus (DENV-1) isolated between two continuous years in South America.
2005
2006
2001
2002
Result and Discussion
We developed a SimFluVar to calculate variations in the genetic sequence of different groups based on codons. SimFluVar was developed with an aim to study the influenza virus and make it possible to calculate the variation pattern between the two groups according to years, continents, subtypes, or hosts, unlike the various codon analysis programs developed so far. We had previously developed SimFlu to predict possible future variants of the influenza virus based on a library of precalculated codon variation parameters for the H1N1, H3N2, and H5N1 subtypes of influenza A virus isolated between 2000 and 2011.12 On the other hand, SimFluVar makes it possible to predict codon variations by using input sequences from users and generating codon CMs, TMs, and GC patterns. In addition, SimFluVar provides a convenient user interface because it is based on JAVA RPC. The results in the form of excel (*.xls) and text (*.txt) files are created automatically in the SimFluVar workspace. In our previous study,10 influenza A/H1N1 virus codon transition was calculated and predicted for the target years by using algorithms of SimFluVar. Sequences were simulated based on a seed sequence, which was followed by a Basic Local Alignment Search Tool (BLAST) search that compared this sequence to those of viruses that occur in nature. Through this research, we simulated sequences that have high similarity with the sequences of virus isolated in the actual year of interest. In addition, we reported a process by which we simulated sequence variation in the actual virus sequence after analysis according to the host range and subtype range.10 G + C (%) content at the wobble codon position, which can be calculated using SimFluVar, can be used to analyze the CpG pattern in the seed sequence and the simulated sequence, with the resultant different CpG patterns depending on the host species.14 A shortcoming of SimFluVar is its assumption that the same transition probability exists for any coding sequence region. In addition, codon transition comparing is difficult if case sequences have high similarity. Thus, we will develop an advanced version that will introduce, in parallel, other calculation techniques. This program will offer a more biologically representative environment because it will perform calculations using different probabilities for variable regions and conserved regions. Once these parallel calculation techniques for codon variation analysis of the influenza virus are developed, our codon variation prediction tool may prove to be an important method for epitope prediction for developing vaccines.
Conclusions 0.0
0.1
0.1
0.2
0.2
0.3
0.3
0.4
0.4
0.5
0.5
South America
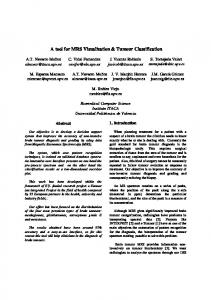
Figure 3. The results in heat map view of codon TM using SimFluVar targeted on genome of DENV-1 by continuous years in South America. The result indicated higher codon transition probability from 2001 to 2002 than from 2005 to 2006.
182
Evolutionary Bioinformatics 2015:11
In our earlier research,10–12 we had inferred, after performing evolutionary analysis of human-origin influenza A virus (H3N2) genes and the associated codon usage patterns since 1993 and the evolutionary patterns of the NA gene of influenza A/H1N1, that codon substitution in the influenza A virus underwent an evolutionarily directed process. Accordingly, we
Simulation tool for influenza virus variation
developed SimFluVar to analyze the evolutionary pattern in various influenza A subtypes. SimFluVar is a program in the SimFlu (simulation tool for influenza virus) series. The TM that is calculated using SimFluVar is available directly in the user parameters in SimFlu program. SimFluVar automatically performs calculations on the input sequence used to generate the codon CM and Markov model’s TM and displays the GC content on the wobble position. One can assess the results by viewing the heat map and graphs, and the sequence can be predicted based on the seed sequence from each of the result files. SimFluVar can be applied to a variety of studies, including those of the influenza virus, the dengue virus, and the ebola virus groups, across different continents, hosts, and subtypes.
Author Contributions
Designed and developed the whole package of software: IA, JHJ. Helped to develop each separate module: HYK, JHL. Helped to test and evaluate the software: HSS. All the authors read and approved the final manuscript. References
3. World Health Organization. Pandemic (H1N1) 2009 – Update 112. 2010. Available at: http://www.who.int/csr/don/2010_08_06/en/. Accessed February 11, 2015. 4. Gao R, Cao B, Hu Y, et al. Human infection with a novel avian-origin influenza A (H7N9) virus. N Engl J Med. 2013;368(20):1888–97. 5. Luksza M, Lassig M. A predictive fitness model for influenza. Nature. 2014;507(7490):57–61. 6. Jaiswal V, Chanumolu SK, Sharma P, Chauhan RS, Rout C. EpiCombFlu: exploring known influenza epitopes and their combination to design a universal influenza vaccine. Bioinformatics. 2013;29(15):1904–7. 7. Goldman N, Yang Z. A codon-based model of nucleotide substitution for protein-coding DNA sequences. Mol Biol Evol. 1994;11(5):725–36. 8. Arenas M, Posada D. Recodon: coalescent simulation of coding DNA sequences with recombination, migration and demography. BMC Bioinformatics. 2007;8:458–61. 9. Arenas M, Posada D. Coalescent simulation of intracodon recombination. Genetics. 2010;184(2):429–37. 10. Ahn I, Son HS. Computational model for analyzing the evolutionary patterns of the neuraminidase gene of influenza A/H1N1. Comput Biol Chem. 2012;36:23–30. 11. Ahn I, Son HS. Evolutionary analysis of human-origin influenza A virus (H3N2) genes associated with the codon usage patterns since 1993. Virus Genes. 2012;44:198–206. 12. Ahn I, Kim HY, Jung S, Lee JH, Son HS. SimFlu: a simulation tool for predicting the variation pattern of influenza A virus. Comput Biol Med. 2014;52:35–40. 13. Larkin MA, Blackshields G, Brown NP, et al. Clustal W and Clustal X version 2.0. Bioinformatics. 2007;23(21):2947–8. 14. Greenbaum BD, Levine AJ, Bhanot G, Rabadan R. Patterns of evolution and host gene mimicry in influenza and other RNA viruses. PLoS Pathog. 2008;4(6):e1000079.
1. Vijaykrishna D, Poon LL, Zhu HC, et al. Reassortment of pandemic H1N1/2009 influenza A virus in swine. Science. 2010;328(5985):1529–32. 2. Gallaher WR. Towards a sane and rational approach to management of influenza H1N1. Virol J. 2009;6:51.