Introducing Hippy: A visualization tool for understanding the α-helix pair interface Robert Fraser and Janice Glasgow School of Computing, Queen’s University, Kingston ON, Canada, K7L3N6 {robert,janice}@cs.queensu.ca ABSTRACT Hippy is a novel protein visualization tool designed to meet the needs of those who are working with contact maps for protein structure prediction, and in particular for those desiring to gain insight into the configurations and properties of pairs of alpha helices. It is the only known program that allows the simultaneous display of the structure and the contact map. Users can customize Hippy to display the side chains, contacts, and the steric surface of the helices. The program is open source; the software was implemented in OpenGL with an aim for platform independence.
of the spatial configuration of a pair of helices ab initio. Many packing models have been developed, such as ‘knobs into holes’4 and ‘ridges into grooves’.3 Although these models are illustrative, they fail to thoroughly describe the nature of interhelical interaction.
The ability to predict the configuration of pairs of alpha helices would be an asset for protein structure prediction. It is the first step in a bottom-up approach for assembling sub-structures into a full tertiary structure for a protein. Our research is one component in a novel approach to protein structure prediction in which first a contact map is predicted for the protein from the Keywords: Alpha helix, contact maps, primary sequence.5 The tertiary structure protein visualization, supersecondary is next predicted from the contact map using the bottom-up approach.6 The present strucutres goal is to gain a thorough understanding of the properties of the alpha helix pair and its corresponding contact map to aid in this 1. INTRODUCTION study. The 3D structure of a protein is primarily determined by the supersecondary struc2. PROTEIN tures present. The alpha helix is the most VISUALIZATION common type of secondary structure, as over a third of residues in globular proteins There exists a significant number of software are found in helices. For this reason, alpha packages designed for modelling proteins, helices have been the subject of significant most of which accept a Protein Data Bank research. The interface between helix pairs (PDB)2 format file for the protein as input is insufficiently understood for a prediction and extract the relevant information from the file. Among the most popular packCorrespondence to: ages are Rasmol,16 Chimera,15 Swiss-PDB Robert Fraser 7 and Protein Explorer.13 WebMail: School of Computing, Queen’s Univer- viewer, 18 Mol is a visualization package that allows sity, Kingston ON, Canada, K7L3N6 Email:
[email protected] users to view and interact with the distance
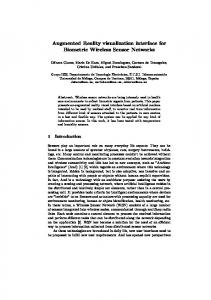
map for a protein; it is the only application with this feature that was found. Unfortunately, there is no option for displaying the contact map rather than the distance map. The limitation of all these packages with regards to the applications considered for this research is that the displays are tailored for the entire protein and do not allow for much insight into the interaction between the alpha helices. The aim of this work is to create a system that expands comprehension of the interface of helix pairs and how the Figure 1. (a) The contact map for protein 1A0A, a phosphate system positive regulatory configuration of the protein is correlated to protein, is shown. The contact map interface the contact map for the interface. is found by finding the smallest rectangle containing all of the contact points from the contact map for the helix pair. The dashed rectan3. CONTACT MAPS gle indicates the area occupied by two helices, Hippy displays the contact map for a pair shown in (b). This contact map represents all of the amino acids for one alpha helix along of alpha helices from a protein. The disthe vertical axis and the other along the hortance map for a given protein is an N × N izontal. This has been further refined to the matrix, where N is the number of amino interface area, shown in (c).
acids in the protein, and entry Dij in the matrix is the distance from amino acid i to amino acid j in 3D space, typically measured in ˚ Angstr¨oms. The contact map can be thought of as a binary version of the distance map, where a threshold has been applied to yield the Boolean values. The threshold value that is chosen is essentially the definition to be employed of what constitutes a contact. The means of determining an ideal value to use for the contact map threshold distance is by no means an empirical process at present. A literature review found many varieties of values; indeed the choice of what to measure for distance is by no means standardized at present. For example, Fariselli et al.5 are using 8˚ A between Cβ as their model; Vendruscolo et al.17 use 9˚ A between Cα . K¨allblad and 10 Dean use 5˚ A between Cβ , and Hu at al.8 use a double threshold of 4 and 7˚ A between Cα , the thought being that this will eliminate contacts not associated with supersecondary structures. Lee and Chirikjian12 determined that there is orientational or-
der between pairs of alpha helices at distances up to 15˚ A so this would be a practical choice of threshold for some applications as well. Since there is such variation in the definition of a contact, the visualization package must accommodate this by allowing users to change the threshold value being used. The contact map for an alpha helix pair can be isolated from the map for the whole protein using the indices of the initial and final residues in each helix, as shown in Figure 1. The critical information that is gained by this step is the region of contact between the pair, referred to as the interface. The interface between the helices is the only part of the helices that we are really concerned with, as this is the region where potential interactions are likely occurring.
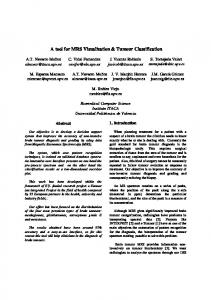
4. HIPPY The helix pair viewing software was developed to efficiently configure the view according to the needs of the user. The initial helix pair selection tool shows the entire protein, and the user can move through the pairs of alpha helices and see the pair and the corresponding contact map at various thresholds. Since Hippy is designed specifically for the visualization of pairs of alpha helices, many assumptions can be made. Once the user has selected a pair for viewing, the properties of the display may be tailored. There are multiple properties of the helices that may be switched on or off so that only relevant information is being displayed. These Figure 2. Hippy rendering the helix pair corproperties include: responding to Figure 1b. The large spheres are different colours to illustrate the van der Waals • Alpha carbons only or all backbone shells of the atoms on each helix. The bars between the helices are connecting alpha carbons atoms that are in contact. All atoms of the backbone • Sidechains or no sidechains are being rendered in this example, and the side chain atoms are rendered with low opacity.
• The opacity of the sidechains can be varied on a discrete linear scale
shells are shown with a different colour used • The van der Waals shells of the side for each helix. Where the van der Waals shells from one helix are in contact with chains can be shown or hidden those of the other is an indication of areas • The contacts (derived from the con- with significant interaction between the altact map) between alpha carbons can pha helices. be shown or hidden There are numerous conventions that were used in the design of this package: • The threshhold distance being used to calculate the contact map can be varied • the secondary structure information was taken from the PDB file. Figure 2 illustrates a screenshot from the main window of the software, showing most of these features in action. The window shows the helix pair viewer rendering the second and fourth alpha helices (as indexed in the PDB file) from the protein 1A0A. In this example, all backbone atoms are being drawn and the sidechains are being rendered with very low opacity. The contacts between alpha carbons are shown as the translucent bars, and the van der Waals
• the colouring scheme for the atoms is the standard C-P-K scheme (after Corey, Pauling and Koltun).11 • the radii for the van der Waals shells uses the United Atom Radius, which is the convention used by Rasmol-based viewers.14 This model creates a sphere which approximates the radii for the heavy atom and the hydrogen atoms
Figure 2) may or may not be significant depending on the packing of the helices. Hippy facilitates determining the significance by allowing a researcher to examine the helix shapes and the van der Waals shells of the side chain atoms in the main window and by adjusting the contact threshold.
5. CONTRIBUTIONS Figure 3. The contact map window from the helix pair viewer, corresponding to the helices of index 2 and 4 from protein 1A0A. Note the correspondence with Figure 1b. Clicking on a contact here causes the bar associated with the contact in the main window to flash.
bonded to it as one. This is needed because most PDB files do not contain hydrogen atoms (due to the inability of X-ray crystallography techniques to resolve them).
Hippy is a straightforward and user-friendly program that has the potential for facilitating breakthroughs in the study of alpha helix pairs. It enables the investigation of the configuration and packing of a pair and the manipulation of the contact map. The program is open source and platform independent, so it is possible to modify the package to include additional features that an individual may desire. Researchers working in protein structure prediction using contact maps will benefit from this tool by visualizing the correlation between the three dimensional structure of a helix pair and the corresponding contact map.
To open a file, the user simply specifies the name of the file containing the helices that are desired∗ , and then selects the in6. FUTURE WORK dices of the helices themselves. The file is then parsed to extract all of the coordinate This system has many potential extendata corresponding to those helices. The sions, some of which are in development at contact map for the pair of helices is calcu- present. These include: lated from the coordinate data using the desired contact threshold (the default is 8˚ A), • The next version of Hippy will include and the contact map window is rendered, an option where the full range of possias shown in Figure 3. This figure shows ble motions for the helix pair would be Hippy’s contact map window corresponding demonstrated. The contact map values to the pair of alpha helices shown in the preand the steric surface of the helices are vious figure. Notice that there is a clear patthe constraints. tern that becomes obvious from this contact map, as there is some symmetry. It is ap• There is no ability for the user to move parent that the bottom-most contact (corthe helices or atoms to witness the efresponding to the left-most contact bar in fects at present. Since the contents of ∗ The standard format for input files is that the contact map are linked dynamically to the coordinate data in Hippy, if eiof PDB files; users can create their own files ther the coordinate data or the conthat contain the atom and helix data for a molecule in PDB format if so desired. tents of the contact map window are
changed, the contents of the other window will be adjusted accordingly. In addition, the substitution of different species of residues would be interesting.
2. H.M. Berman, J. Westbrook, Z. Feng, G. Gilliland, T.N. Bhat, H. Weissig, I.N. Shindyalov, and P.E. Bourne. The Protein Data Bank. Nucleic Acids Research, 28(1):235–242, 2000.
• A modelling system which was based upon the energy of the system might prove useful, as the protein native state is commonly thought to be a low energy configuration (Anfinsen’s thermodynamic hypothesis1 ). This may still be added in some future version.
3. C. Chothia, M. Levitt, and D. Richardson. Helix to helix packing in proteins. Journal of Molecular Biology, 145:215–250, 1981.
• Hippy could be extended to include triplets or quadruplets of helices, and it could also be used for beta sheets or other structures. • One helix pair could be aligned with another helix pair of interest using conventional alignment techniques. This would be illustrative of differences between pairs of helices with respect to their contact maps. • The secondary structure from Database of Secondary Structures in Proteins (DSSP)9 could be used instead of that directly from the PDB file. The program, source code, and documentation may be found online at http://www. cs.queensu.ca/∼robert/hippy/
ACKNOWLEDGEMENTS This research has been supported by grants from the PRECARN Institute for Robotics and Intelligent Systems (IRIS) and the Natural Sciences and Engineering Research Council of Canada (NSERC).
REFERENCES 1. C.B. Anfinsen. Principles that govern the folding of protein chains. Science, 181(4096):223–230, 1973.
4. F. Crick. The packing of α-helices: simple coiled coils. Acta Crystallographica, 6:689–697, 1953. 5. P. Fariselli, O. Olmea, A. Valencia, and R. Casadio. Prediction of contact maps with neural networks and correlated mutations. Protein Engineering, 14(11):835– 843, 2001. 6. J. Glasgow, T. Kuo, and J. Davies. Protein structure from contact maps: A casebased reasoning approach. Information Systems Frontiers, 8:29–36, 2006. 7. N. Guex and M.C. Peitsch. SWISSMODEL and the Swiss-PdbViewer: An environment for comparative protein modeling. Electrophoresis, 18:2714–2723, 1997. 8. J. Hu, X. Shen, Y. Shao, C. Bystroff, and M. Zaki. Mining protein contact maps. In 2nd BIOKDD Workshop on Data Mining in Bioinformatics, 2002. Dic9. W. Kabsch and C. Sander. tionary of protein secondary structure: pattern recognition of hydrogen-bonded and geometrical features. Biopolymers, 22(12):2577–2637, 1983. 10. P. K¨allblad and P.M. Dean. Backbonebackbone geometry of tertiary contacts between α-helices. PROTEINS: Structure, Function, and Bioinformatics, 56:693–703, 2004. 11. W.L. Koltun. atomic models. 679, 1965.
Precision space-filling Biopolymers, 3(6):665–
12. S. Lee and G.S. Chirikjian. Interhelical angle and distance preferences in globular proteins. Biophysical Journal, 86:1105– 1117, 2004.
13. E. Martz. Protein Explorer: Easy yet powerful macromolecular visualization. Trends in Biochemical Sciences, 27:107–109, 2002. 14. E. Martz and R. Sayle. Bonds in rasmol/chime, http://www.umass.edu/ microbio/rasmol/rasbonds.htm. 2000. 15. E.F. Pettersen, T.D. Goddard, C.C. Huang, G.S. Couch, D.M. Greenblatt, E.C. Meng, and T.E. Ferrin. UCSF Chimera - A visualization system for exploratory research and analysis. Journal of Computational Chemistry, 25:1605– 1612, 2004. 16. R.A. Sayle and E.J. Milner-White. RASMOL: biomolecular graphics for all. Trends in Biochemical Sciences, 20(9):374–376, 1995. 17. M. Vendruscolo, E. Kussell, and E. Domany. Recovery of protein structure from contact maps. Folding and Design, 2(5):295–306, 1997. 18. D. Walther. WebMol - a Java-based PDB viewer. Trends in Biochemical Sciences, 22(7):274–275, 1997.