A Wavelet-Based Neural Network Classi£er for Temporal Data Brendon J. Woodford1 & Nikola K. Kasabov2 1
Department of Information Science University of Otago, Dunedin, New Zealand Phone: +64-3-479-8198 Fax: +64-3-479-8311 Email:
[email protected] 2
Department of Information Science University of Otago, Dunedin, New Zealand Phone: +64-3-479-8319 Fax: +64-3-479-8311 Email:
[email protected] Presented at the 5th Australasia-Japan Joint Workshop University of Otago, Dunedin, New Zealand November 19th -21st 2001
ABSTRACT This paper outlines the application of Evolving Fuzzy Neural Networks (EFuNN)1 for the detection of browning in Braebrun apples when in Controlled Atmosphere (CA) storage. Wavelet coef£cients are extracted from each image and these features used to train both an EFuNN and a Multi Layer Perceptron (MLP). We compare the obtained results between these two neural network architectures and found that the EFuNN is able to more accurately determine the rate of browning even when it has been exposed to a small number of images. The advantages of this method include the ability for this model to represent the important temporal information in a relatively compact neural network structure and to incrementally learn its input. Such an architecture reduces the added complexity of other neural network models that normally use recurrent connections in order to model the temporal dimension of the data. Keywords and phrases: image recognition, wavelets, adaptive neural networks, on-line learning
1 INTRODUCTION Over the past 15 years (Pan, Rust & Bolouri 2000, Valentin, Abdi, Edelman & O’Toole 1997), arti£cial neural networks have been applied to the task of image recognition. In most cases the images presented to the networks have had little or no temporal information embedded within them. The images normally fall into the category of inanimate objects. Although it has been shown in previous studies that these models can successfully recognise images of this type. The model’s ability to classify images with a temporal dimension is not as good. Such an issue becomes important when the task involved is to determine the rate at which browning occurs within Braeburn apples when they are Controlled Atmosphere (CA) storage. CA storage does not improve fruit quality, but it can slow down the loss of quality after harvest. Successful CA storage begins by harvesting fruit at its proper maturity. The ability to detect the rate of loss of quality governs the decision concerning whether the apples are to remain in CA storage or immediately processed for export. Methods of determining this rate of change have been proposed including the use of Near Infrared Spectrometry (NIR) (Munro, Novins, Benwell & Mowatt 1996, Munro 1997). Traditional statistical techniques have been employed to analyse this data and the results obtained have been quite encouraging. An alternative approach was to use connectionist-based classi£ers for this task and the results compared to the statistical method (Kim, Mowat, Poole & Kasabov 1997). This has proven to be a successful method. Although this data collection procedure provides a wealth of information about the fruit, it is only based on a sample of different points around the fruit itself. Such a process may neglect some spatial characteristics of the fruit that are the result of a particular treatment programme such as its colour, shape, size, or blemishing. 1 This
research is part of a research programme funded by the New Zealand Foundation of Research Science and Technology, UOOC0016. “Adaptive learning system and method”, Patent Appl. No.503882, University of Otago, New Zealand.
Therefore, a visual inspection of the apple would be more desirable. The problem is that the browning occurs from within and by the time it appears on the surface of the apple, the damage has already been in¤icted. One novel approach to solving this problem has been in the adoption of medical imaging techniques to provide more visual information with which to make this decision. One example is Magnetic Reasonance Imagery (MRI), a non destructive technique for the analysis of the human brain. (Itti, Chang & Ernst 1998). Using this technology, it is then possible to perform non destructive analysis of the fruit. MRI scans are taken at weekly intervals and then the rate of reduction of the quality of the fruit calculate from the images. Such analysis is time consuming and somewhat prone to human error. Image segmentation algorithms can automatically isolate the browned sections of the apples (Shareef, Wang & Yagel 1997) but there is still the issue of determining the rate of degradation. Neural networks are one potential solution to apply to this task but their ability to handle temporal data, is somewhat limited. Addressing this issue, recurrent neural networks and time delay neural networks have been successful but require many training examples before a satisfactory level of accuracy is obtained. Current recurrent neural network (Giles, Lawrence & Tsoi 2001, Petridis & Kehagias 1996) models do not £t comfortably into the arena of this problem as the loss of quality needs to be generated quickly and accurately using a small set of images of the same apple. Recently a new neural network model has been proposed that could be applied to this problem. The Evolving Fuzzy Neural Network (EFuNN) combines the power of a fuzzy inference system embedded in a neural network with the ability for adaptive on-line or real-time learning. We apply this model to the problem of determining the rate of browning. We £rst describe the EFuNN architecture and learning algorithm in Section 2. Section 3 introduces the method of feature extraction that we use to obtain the relevant information for presentation to the EFuNN. In Section 4 we detail the use of wavelets feature extraction from images as our data to represent the problem and then use these features to train an EFuNN and an Multi Layer Perceptron (MLP) to determine the rate of browning within these images. Finally in Section 5 we comment on the obtained results and comment on how this technique could be used in other application areas.
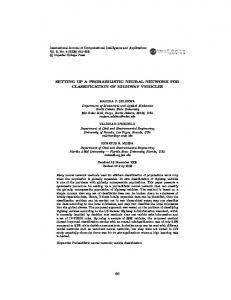
2 EVOLVING FUZZY NEURAL NETWORKS (EFuNNs) 2.1 A general description EFuNNs are structures that evolve according to the ECOS principles (Kasabov 1998a). The architecture is depicted in Figure 1. EFuNNs adopt some known techniques from (Kasabov 1996, Kohonen 1990, Lin & Lee 1996) and from other known NN techniques, but here all nodes in an EFuNN are created during (possibly onepass) learning. The nodes representing MF (fuzzy label neurons) can be modi£ed during learning. Each input variable is represented here by a group of spatially arranged neurons to represent a fuzzy quantisation of this variable. For example, two neurons can be used to represent “small” and “large” fuzzy values of a variable. Different membership functions (MF) can be attached to these neurons (triangular, Gaussian, etc.). New neurons can evolve in this layer if, for a given input vector, the corresponding variable value does not belong to any of the existing MF to a degree greater than a membership threshold. A new fuzzy input neuron, or an input neuron, can be created during the adaptation phase of an EFuNN. rule(case) nodes
inputs
output
Figure 1: A EFuNN structure of 2 inputs (input variables), 2 fuzzy linguistic terms for each variable (2 membership functions). The number of the rule (case) nodes can vary. Two output membership functions are used for the output variable. The EFuNN algorithm, for evolving EFuNNs, has been £rst presented in (Kasabov 1998b). A new rule node rn is created and its input and output connection weights are set as follows: W1(rn)=EX; W2(rn) = TE, where TE is the fuzzy output vector for the current fuzzy input vector EX. In “one-of-n” EFuNNs, the maximum activation of a rule node is propagated to the next level. Saturated linear functions are used as activation functions of the
fuzzy output neurons. In case of “many-of-n” mode, all the activation values of rule (case) nodes, that are above an activation threshold of Athr, are propagated further in the connectionist structure.
2.2 The EFuNN learning algorithm The EFuNN evolving algorithm is given as a procedure of consecutive steps (Kasabov 1998a, Kasabov 1998b, Kasabov 1998c, Kasabov 1999a, Kasabov 1999b): 1. Initialise an EFuNN structure with a maximum number of neurons and zero-value connections. Initial connections may be set through inserting fuzzy rules. If initially there are no rule (case) nodes connected to the fuzzy input and fuzzy output neurons with non-zero connections, then connect the £rst node rn=1 to represent the £rst example EX=x1 and set its input W1(rn) and output W2(rn) connection weights as follows: : W1(rn)=EX;W2(rn) = TE, where TE is the fuzzy output vector for the (fuzzy) example it EX. 2. WHILE DO Enter the current example xi , EX being the fuzzy input vector (the vector of the degrees to which the input values belong to the input membership functions). If there are new variables that appear in this example and have not been used in previous examples, create new input and/or output nodes with their corresponding membership functions as explained in (Kasabov 1999b) 3. Find the normalized fuzzy similarity between the new example EX (fuzzy input vector) and the already stored patterns in the case nodes j=1,2..rn: Dj = sum (abs (EX - W1(j) )/ sum (W1(j)) + sum (EX). 4. Find the activation of the rule (case) nodes j, j=1..rn. Here radial basis activation function, or a saturated linear one, can be used on the Dj input values i.e. A1(j) = radbas(Dj), or A1(j) = satlin(1 - Dj). Previous activation at the same layer can be taken into account (Kasabov 1999b) 5. Update the local parameters de£ned for the rule nodes, e.g. Short-Term Memory (STM), age, average activation as pre-de£ned. 6. Find all case nodes j with an activation value A1(j) above a sensitivity threshold Sthr. 7. If there is no such case node, then using the procedure from step 1. ELSE Find the rule node inda1 that has the maximum activation value. (maxa1). (a) in case of “one-of-n” EFuNNs, propagate the activation maxa1 of the rule node inda1 to the fuzzy output neurons. Saturated linear functions are used as activation functions of the fuzzy output neurons: A2 = satlin (A1(inda1) * W2). (b) in case of “many-of-n mode”, only the activation values of case nodes that are above an activation threshold of Athr are propagated to the next neuronal layer. 8. Find the winning fuzzy output neuron inda2 and its activation maxa2. 9. Find the desired winning fuzzy output neuron indt2 and its value maxt2. 10. Calculate the fuzzy output error vector: Err = A2 - TE. 11. IF (inda2 is different from indt2) or (abs(Err (inda2)) > Errthr) then 12. Update: (a) the input, and (b) the output connections of rule node k=inda1 as follows: (a) Dist = EX-W1(k); W1(k) = W1(k) + lr1*Dist, where lr1 is the learning rate for the £rst layer; (b) W2(k) = W2 (k) + lr2*Err*maxa1, where lr2 is the learning rate for the second layer. If STM is used update the feedback connections in the rule layer. 13. Prune rule nodes j and their connections that satisfy the following fuzzy pruning rule to a pre-de£ned level: IF (node (j) is OLD) and (average activation A1av(j) is LOW) and (the density of the neighbouring area of neurons is HIGH or MODERATE) and (the sum of the incoming or outgoing connection weights is LOW) and (the neuron is NOT associated with the corresponding “yes” class output nodes (for classi£cation tasks only) THEN the probability of pruning node (j) is HIGH. The above pruning rule is fuzzy and it requires that all fuzzy concepts such as OLD, HIGH, etc., are de£ned in advance. As a partial case, a £xed value can be used, e.g. a node is old if it has existed during the evolving of a FuNN from more than 60 examples. 14. Aggregate rule nodes into layer clusters (prototype) nodes (see (Kohonen 1990)) 15. END of the WHILE loop and the algorithm 16. Repeat steps 2-15 for a second presentation of the same input data or for ECO training if needed.
3 WAVELET ANALYSIS OF MRI IMAGES When processing any type of signal, the prime consideration is the localisation, i.e., the characterisation of local properties, of a given basis function in time and frequency. In this case the signals we are dealing with are 2-D colour images, for which the time domain is the spatial location of certain colour pixels and the frequency domain is the intensity variation around a pixel, normally a value between 0 and 255. One attractive and popular transformation, wavelets, developed in mathematics, quantum physics, and statistics, are functions that decompose signals into different frequency components and analyse each component with a resolution matching its scale. Applications of wavelets include signal denoising, image compression, image smoothing, and fractal analysis. Using Daubechies wavelets for image analysis and comparison has already been shown to be a successful technique in the analysis of natural images (Wang, Wiederhold, Firschein & Wei 1996, Wang, Wiederhold, Firschein & Wei 1997). This is because they can characterise the colour variations over the spatial extent of the image that can provide semantically meaningful image analysis These techniques have been further extended for application in the area of wavelet-based image processing techniques and neural networks to develop a method of on-line identi£cation of pest damage in pipfruit orchards (Woodford, Kasabov & Wearing 1999, Kasabov, Israel & Woodford 2000). In these studies Symmlets wavelets were used as they were found to perform better extraction of the relevant features for the identi£cation of images of damaged apples.
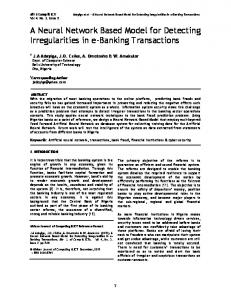
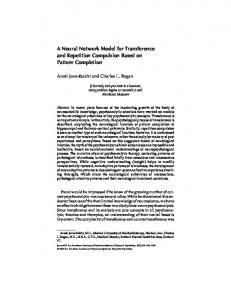
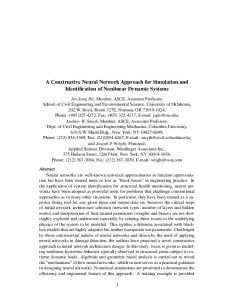
4 DETERMINING THE RATE OF BROWNING USING NEURAL NETWORKS The dataset comprised of 5 sets of 5 MRI images, a total of 25 MRI images in all. Each image set was of the same apple taken at 0 days, after 7 days, after 14 days, after 21 days, and after 28 days. The images were then processed using the technique described in (Wang et al. 1996) and (Wang et al. 1997). The algorithm described in the papers was then developed in MATLAB using a combination of the Image Processing Toolbox (Thompson & Shure 1995) and The Uvi Wave.300 Wavelet Toolbox (S´anchez, Prelcic & Gal´an 1996). For each component in the RGB colour-space, a 16x16 feature vector is produced resulting in a 16x16x3=768 dimensional feature vector that describes the semantics of the image. We then used this 768 dimensional feature vector as the input to each of the neural networks. For a full description of the wavelet feature extraction method we direct the reader to (Woodford et al. 1999, Kasabov et al. 2000). The output vectors for the dataset consisted of a vector containing 5 outputs with a value of either 1 or 0. A 1 in the output vector corresponded to the week in which the MRI scan of the apple was taken. For example if the MRI image of the apple was taken at 0 days then the ouput vector would be [1 0 0 0 0]. Those MRI images taken at 28 days had an output vector of [0 0 0 0 1]. After presenting the 20 images to each type of neural network, they were then tested set of £ve test images as displayed in Figure 2 that the system had not been trained on in order to test their ability to generalise to new data and also determine at what week the browning had occurred. Table 1 contains the descriptions of the test images. Filename a5-1 a3-2 a1-3 a2-4 a4-5
Description Apple 5 taken at 0 days. Apple 3 taken at 7 days. Apple 1 taken at 14 days. Apple 2 taken at 21 days. Apple 4 taken at 28 days.
Table 1: Description of images used to test the MLP and EFuNN
4.1 Training and testing of the MLP A MLP (Rumelhart, Hinton & Williams 1986b) was initialised using MATLAB with 768 inputs, a hidden layer of 20 nodes, and 5 output nodes. The Scaled Conjugate Gradient Algorithm (Moller 1993) was used to train the network; a variation on the standard backpropagation learning rule (Rumelhart, Hinton & Williams 1986a) to reduce the time required to train the MLP. After 1000 epochs the MLP generated an RMS error of 0.37 and was then tested against the images depicted in Figure 2. The MLP could only detect what week the rate browning occurred on the a1-3 image. The rest of the test images were incorrectly classi£ed.
(a) a5-1
(b) a3-2
(c) a1-3
(d) a2-4
(e) a4-5
Figure 2: Subset of images used to test the classi£cation system
4.2 Training and testing of the EFuNN Using the same datasets, an EFuNN was trained on 20 images and created 15 rule nodes. The main parameters of interest for the EFuNN were 2 Membership Functions per input and output, no normalisation of the data, pruning on at 20 rule nodes. Upon validating the EFuNN using the same training set a recognition rate of 100% was obtained. This was only after the training images were presented once to the EFuNN. When the test images in depicted in Figure 2 were presented to the EFuNN, the neural network was able to successfully identify what week the browning had occured on the test images.
4.3 Discussion Based on this initial experiment, it is clear that the EFuNNs performance was much better than the traditional MLP model. We can account for this better performance by examining the structure and learning algorithm used in the MLP. Firstly, the size of the architecture for the MLP was extremely large. This was because of the length of the input vector. Input vectors of this size require a signi£cant amount of presentations of the training data for the MLP to successfully learn the mapping between the input vectors and the output vectors. In addition, the small number hidden nodes contained in the MLP were unable to represent the mapping between the inputs and outputs. Raising the number of hidden nodes may increase the ability for the MLP to learn but create a structure that is an order of magnitude larger and thus will take even longer to train. Secondly, there was only a small number of training images presented to the MLP. The consequence of the small number of examples presented to the MLP resulted in its inability to generalise to the unseen text examples. Even the application of the Scaled Conjugate Gradient Algorithm did not result in better generalisation of the MLP. We would then postulate that an increase in the number of training examples would result in a better generalisation of the MLP. However the expense in obtaining the extra images may not be cost effective. In conclusion it can be seen from the results of this experiment that the advantages of the EFuNN are twofold: One, the time taken to train the EFuNN was far less than the MLP model. And two; the EFuNN was able to successfully classify the test images given only one presentation of each training image. This indicates that the EFuNN has the ability to store a better representation of the temporal nature of the data, and to this end, generalise better than the MLP. This is indeed a vindication of the EFuNNs ability to model temporal concepts within its structure.
5 CONCLUSION In this paper, we have introduced a novel method for the identi£cation of the rate of browning within Braeburn apples. Using a series of MRI images of the apples in CA storage, wavelet features were extracted and then used to train a MLP and EFuNN. Testing of these two different neural networks resulted in better performance from the EFuNN. The application of the reported method can also be employed when on-line real-time image recognition is required or when the cost to obtain the actual images is high. This advantage is supported in the ability of the EFuNN to support incremental learning. That is, the EFuNN doesn’t need to be retrained on the existing training images when a new image is presented to the neural network to train the system. Such a function reduces the occurrence of catastrophic forgetting within the system. Furthermore, the EFuNN’s parameters can be adjusted to make it “forget” at certain periods throughout the apple’s time in CA storage. This action would result in maintaining the compact structure of the EFuNN so that it
only retains the memory of the degradation of the apples over a set period of time.
ACKNOWLEDGEMENTS This research is part of a research programme funded by the New Zealand Foundation for Research Science and Technology, UOOX0016. The authors would also like to acknowledge the assistance of Chris Clark from HortResearch Ruakura, New Zealand for kindly supplying the MRI images of the Braeburn apples.
References Giles, C. L., Lawrence, S. & Tsoi, A. C. (2001). “Noisy Time Series Prediction Using a Recurrent Neural Network and Grammatical Inference” Machine Learning. 44(1/2): 161–183. Itti, L., Chang, L. & Ernst, T. (1998). “Manual and Automatic Extraction of White-Matter Lesions in FLAIR Images” Proc. 6th Annual Meeting of the International Society for Magnetic Resonance in Medicine (ISMRM’1999), Sydney, Australia.. p. 2073. Kasabov, N. (1996). Foundations of Neural Networks, Fuzzy Systems and Knowledge Engineering. £rst edn. MIT Press, Cambridge: MA. Kasabov, N. (1998a). “ECOS: A Framework For Evolving Connectionist Systems And The eco Learning Paradigm” Proc. of ICONIP’98.,Kitakyushu, Oct 1998.. pp. 1232–1236. Kasabov, N. (1998b). “Evolving Fuzzy Neural Networks - Algorithms, Applications and Biological Motivation” Proc. of Iizuka’98, Iizuka, Japan.. pp. 271–274. Kasabov, N. (1998c). “Fuzzy Neural Networks, Rule Extraction and Fuzzy Synergistic Reasoning Systems” Research and Information Systems. 8: 45–59. Kasabov, N. (1999a). Evolving Connectionist And Fuzzy Connectionist System For On-Line Decision Making And Control. Vol. Soft Computing in Engineering Design and Manufacturing Springer-Verlag. Kasabov, N. (1999b). “Learning, reasoning, and rule extraction in Evolving Fuzzy Neural Networks” Submitted to Neurocomputing. . Kasabov, N. K., Israel, S. A. & Woodford, B. J. (2000). “The Application of Hybrid Evolving Connectionist Systems to Image Classi£cation” Journal of Advanced Computational Intelligence. 4(1): 57–65. Kim, J., Mowat, A., Poole, P. & Kasabov, N. (1997). “Neuro-Fuzzy and Multivariate Statistical Classi£cation of fruit Populations Based on Near Infrared Spectrophometry Data” In N. Kasabov, R. Kozma, K. Ko, R. O’Shea, G. Coghill & T. Gedeon (eds), Proceedings of the 1997 International Conference on Neural Information Processing Systems, ICONIP’97. Vol. 2 Springer–Verlag. pp. 780–784. Kohonen, T. (1990). “The Self-Organizing Map” Proceedings of the IEEE. 78(9): 1464–1497. Lin, C. T. & Lee, C. S. (1996). Neuro Fuzzy Systems. Prentice Hall. Moller, M. F. (1993). “A Scaled conjucate gradient algorithm for fast supervised learning” Neural Networks. 6: 525–533. Munro, H. (1997). “Simultaneous Visualisation of Spectral and Spatial Fruit Data” Master’s thesis Computer Science Department, University of Otago, 1997. Munro, H., Novins, K., Benwell, G. & Mowatt, A. (1996). “Interactive Visualisation Tools for Analysing NIR Data” OZCHI’96. IEEE Computer Society. pp. 19–24. Pan, Z., Rust, A. & Bolouri, H. (2000). “Image redundancy reduction for neural network classi£cation using discrete cosine transforms”. URL: citeseer.nj.nec.com/pan00image.html Petridis, V. & Kehagias, A. (1996). “A Recurrent Network Implementation of Bayesian Time Series Classi£cation” Neural Computation. 8: 357–372. Rumelhart, D. E., Hinton, G. E. & Williams, R. J. (1986a). “Learning representations by backpropagating errors” Nature. 323: 533–536. Rumelhart, D. E., Hinton, G. E. & Williams, R. J. (1986b). Parallel Distributed Processing, Vols 1 and 2. Cambridge, MA: The MIT Press. S´anchez, S. G., Prelcic, N. G. & Gal´an, S. J. G. (1996). Uvi Wave version 3.0. 3rd edn. Grupo de Teor´ıa de la Se˜nal, Universidad de Vigo.
Shareef, N., Wang, D. L. & Yagel, R. (1997). “Segmentation of Medical Images using LEGION” Technical Report OSU-CISRC-4/97-TR26. Department of Computer and Information Science, The Ohio State University, Columbus, Ohio. Thompson, C. M. & Shure, L. (1995). Image Processing Toolbox. 2nd edn. The MathWorks, Inc., Natick, MA: The Mathworks, Inc. Valentin, D., Abdi, H., Edelman, B. E. & O’Toole, A. J. (1997). “Principal Component and Neural Network Analyses of Face Images: What Can Be Generalized in Gender Classi£cation?” Journal of Mathematical Psychology. 41: 398–412. Wang, J. Z., Wiederhold, G., Firschein, O. & Wei, S. X. (1996). “Applying Wavelets in Image Database Retrieval” Technical report. Stanford University. Wang, J. Z., Wiederhold, G., Firschein, O. & Wei, S. X. (1997). “Wavelet-Based Image Indexing Techniques with Partial Sketch Retrieval Capability” Proceedings of the Fourth Forum on Research and Technology Advances in Digital Libraries (ADL’97). IEEE Press. pp. 1–9. Woodford, B. J., Kasabov, N. K. & Wearing, C. H. (1999). “Fruit Image Analysis Using Wavelets” Proceedings of the ICONIP/ANZIIS/ANNES’99 International Workshop. University of Otago Press. pp. 88–91.