A1: End-User Programming for Web-based System Administration Haixia Zhao Eser Kandogan, Eben Haber, Rob Barrett, Allen Cypher, Paul Maglio University of Maryland, IBM Almaden Research Center College Park 650 Harry Rd. Department of Computer Science San Jose, CA 95120,USA Tel: 1-408-927-1949 A. V. William Bldg., {eserk, ehaber, barrett, pmaglio}@almaden.ibm.com, College Park, MD 20740, USA
[email protected] [email protected] ABSTRACT
System administrators work with many different tools to manage and fix complex hardware and software infrastructure in a rapidly paced work environment. Through extensive field studies, we observed that they often build and share custom tools for specific tasks that are not supported by vendor tools. Recent trends toward web-based management consoles offer many advantages but put an extra burden on system administrators, as customization requires web programming, which is beyond the skills of many system administrators. To meet their needs, we developed A1, a spreadsheet-based environment with a task-specific system-administration language for quickly creating small tools or migrating existing scripts to run as web portlets. Using A1, system administrators can build spreadsheets to access remote and heterogeneous systems, gather and integrate status data, and orchestrate control of disparate systems in a uniform way. A preliminary user study showed that in just a few hours, system administrators can learn to use A1 to build relatively complex tools from scratch. ACM Classification: H5.2 [Information interfaces and
presentation]: User Interfaces. - Graphical user interfaces. General terms: End-User Programming. Keywords: System Management, Web-Portal User Inter-
faces, Spreadsheets. INTRODUCTION
System administrators (sysadmins) design, configure, troubleshoot, and maintain the complex Information Technology (IT) infrastructures that support much of modern life. IT systems typically comprise dozens of software components (e.g. database management systems, web servers, application servers), that are distributed across multiple networks, computer and storage hardware, and operating system platforms. Though important and interesting, these Permission to make digital or hard copies of all or part of this work for personal or classroom use is granted without fee provided that copies are not made or distributed for profit or commercial advantage and that copies bear this notice and the full citation on the first page. To copy otherwise, or republish, to post on servers or to redistribute to lists, requires prior specific permission and/or a fee. UIST’05, October 23–27, 2005, Seattle, Washington, USA. Copyright 2005 ACM 1-59593-023-X/05/0010...$5.00.
computer users have rarely been studied by humancomputer interaction researchers [3]. In a series of ethnographic field studies [2], we observed that system administrators often need to build small custom tools quickly as they configure, monitor, or troubleshoot systems end-to-end. Although each vendor provides tools for managing its own systems, the vendor tools often do not support tasks that require access to and control of multiple systems. Moreover, unique configurations and considerations at each site often require idiosyncratic procedures and multi-step processes that may not be supported by vendor tools. In such cases, system administrators develop their own tools. In addition, because system expertise is distributed across people and organizations, administrators must frequently collaborate with others. In our field studies, we observed significant collaboration in the development and use of custom tools. Recognizing the need for integrated system administration workspaces, IT industry leaders are introducing one-stop web-based consoles for administrators, consolidating all admin functions in one console [25]. Such consoles offer many advantages, including a consistent control interface with a homogeneous view of various system components, but the primary advantage is that all functionality needed by system administrators is accessible in one place. However, such consoles typically fail to support customization for admins’ particular environments, processes, and tasks. A system administrator’s primary task is to maintain IT rather than to develop tools. This is precisely the definition of an end user programmer: someone who is not interested in programming per se, but who needs some of the power of programming to accomplish their tasks effectively [17]. Surveys suggest that most system administrators do not have a programming background, nor do they have a lot of time to spend developing quality software [23]. The fact that sysadmins manage to collaboratively build custom tools by cobbling together the resources currently available to them shows that they have a need for end user programming. There is particularly a need for programming webbased tools, however web programming (such as J2EETM) is outside the skill sets of many system administrators. 211
To meet system administrator needs, we developed A1, a spreadsheet-based environment with a task-specific language for quickly building small tools that interact with external systems and migrating existing scripts to run as web portlets. Using A1, system administrators can create spreadsheets to access heterogeneous systems, gather and integrate status, and control disparate systems uniformly. In what follows, we first describe related work in systems administration environments and in spreadsheet programming. Second, we briefly relate a case from our field studies to demonstrate issues in sysadmin workspaces and outline some design requirements. Third, we give an overview of A1’s design, and illustrate its use by an example. Finally, we present results from a preliminary user study of A1. RELATED WORK
A common environment for system management is the shell-based console. Sysadmins often open a number of shell consoles, execute command-line instructions and automate tasks through scripts in languages such as C Shell [11] or Perl. System management tools are typically vendor-specific—each vendor provides a management tool for its own systems, such as IBM’s DB2 Control Center. Tivoli and EMC, two leading providers of system management tools, have hundreds of enterprise-wide management tools, which are now being released as integrated environments. Tivoli’s Enterprise Console provides comprehensive management capabilities, including monitoring systems from multiple vendors. One limitation is that they often do not provide system administrators with the level of customization they may need. For example, the systems typically offer standard, prepackaged charting capabilities without a language that enables end users to create their own system views. PIKT [19] and Cfengine [4] are well known in the sysadmin community as domain-specific languages for monitoring and configuration management of diverse environments, respectively. Unfortunately, complexity of these languages and lack of supporting visual environments make them suitable primarily for experts. Related work on spreadsheets is extensive. Though effective for tabular calculations, off-the-shelf spreadsheets lack expressibility and programming power [27,6]. There have been many attempts to extend the familiar spreadsheet paradigm to provide programming capabilities for solving complex problems. These efforts include re-examining the spreadsheet language and model (e.g. parallel concurrent languages [27,24], constraints-based languages [22], objectoriented functional languages [7], visual languages [20]), reexamining data/cell types (e.g. user interface objects [15,9,20], graphics objects [5], abstract objects [5]), enhancing the user interface (e.g. forms-based [5], threedimensional layouts [8]), and tailoring systems to the application domain (e.g. user interface design [15,9,20], interactive graphics [10,26], image processing [13], logic programming [21]). Of particular relevance is work by Burnett and colleagues, who incorporated abstraction and complex graphical and user-defined types into the spreadsheet para212
digm while maintaining a declarative evaluation model [5] through objects represented as sheets. A1 extends the traditional spreadsheet model by 1) permitting cells to contain arbitrary Java™ objects (in addition to numbers, strings, etc.), 2) extending cell code to include calls to methods of the cell objects, and 3) allowing cells to contain procedural code blocks whose execution is fired by events in the sheet. This approach differs in several important ways from previous work [5, 7, 9]. The other approaches use object models specific to their systems, and require new languages for object definition. Our use of Java™ has the advantage of a large base of existing users, tools, and libraries, particulary for IT management. In addition, the other approaches were purely functional programming environments, whereas our procedural code blocks provide, in our opinion, a more natural means of managing the side effects (such as restarting a system) inherent in system administration. A1 carefully combines procedural and functional constructs through an eventbased approach to achieve rich control structures. A1 takes the inherently event-based programming of spreadsheets and extends it such that cells can either explicitly or implicitly create (e.g. state modifying method calls), listen (e.g. object reference in a function), combine, and process events. Existing spreadsheets, such as Microsoft Excel,™ do permit users to write programs (e.g. in Visual Basic®) that interact with external systems [14]. This approach has drawbacks: first, these external systems are not explicitly represented in the spreadsheets as first-class cell contents (unlike numbers, strings, etc.). Thus, interaction with external processes is done through a language and programming model (e.g. Visual Basic®) different from that used in the spreadsheet and typically requires substantial programming skills. Second, functionality provided by external processes (e.g. operations defined on servers, such as shutdown) may not be exposed to the user in a form that can be used readily in spreadsheet expressions. A1 is also distinguished in deployment of tools as server-side web portlets, a boon for a wide user base. STUDIES OF SYSTEM ADMINISTRATION
We conducted eleven field studies of database, web, operating system, security, and storage administrators at large industrial service delivery centers (see also [2]). We used a variety of qualitative and quantitative techniques to gather data, including surveys, diary study, interviews, and naturalistic observations. Over 40 days of observation, we watched 20 different sysadmins of various skills and specializations, and collected more than 250 hours of videotape. In these field studies, we observed several kinds of collaboration in the development and use of custom tools: tool code sharing among admins who modify tools for their own use, data sharing where the same tool is used by multiple admins (often via the web) for shared situational awareness, and activity coordination where a tool helps orchestrate multiple admins performing different tasks in an activity. Below, we describe one sample episode to illustrate practices related to tool development.
The Crit Sit
“Crit sits” are critical situations that are initiated when a customer is unhappy with IT services. In crit sits, experts are brought together to work exclusively on a problem. Typically, these experts converge on a central location and work in a “war room” for the duration of the problem while others may participate via conference calls and instant message sessions to keep everyone up-to-date. Crit sits are an example of collaboration in the extreme where there is a strong need for specialized tool development. In this particular crit sit, we observed an intermittent failure of a particular web site. The primary symptom was sudden, unexplained increases in the number of http server connections until no more requests were accepted. Because of the complexity of the infrastructure, the source of the problem might have been anywhere including the http server, application server, application, and database servers. Thus, a number of sysadmins with different expertise were brought in to help resolve the issue. The intermittent nature of the problem however made troubleshooting difficult, requiring sysadmins to maintain constant awareness of the situation. Specifically, the sysadmins needed to obtain and correlate status data from the various components involved. Jack, the architect, tracked the situation from the perspective of the web application server by monitoring its connections using vendor-provided visualization software. Unfortunately, no such utility was available for the http server connections. Thus, to analyze the situation end-to-end, Rob (one of the web sysadmins) decided to write a script that would repeatedly output the number of http server connections along with time stamps. This little script turned out to be difficult to write keeping Rob and later three others busy for more than an hour. The problem that they faced concerned output. They knew the commands to find the current time and the number of http connections, but they struggled to output both values on the same line. Once the script was working, Rob ran it on the http server machine. Jack then suggested that Rob put the numbers into the crit-sit chat room, which he did regularly so the remote collaborators could see what was going on and correlate discrepancies in the numbers as seen by the various components. Eventually connections maxed out, Rob got a memory dump, and everyone tried to analyze the situation based on the collected information. This occurred several times during the day with no resolution. In fact, this crit sit continued for several weeks after we left. In the end, the source of the problem was found to be the result of inconsistent system settings across different components, and an error in the application code that complicated and exacerbated the inconsistencies. Discussion
In this and many other cases, administrators struggle to collect as much information about a problem as possible through either vendor tools or their own tools. Tool development is often secondary to their real task, which is understanding the issues and finding a solution to the problem
quickly. This example clearly illustrates what we found in many of our studies: sysadmins collaborate to (1) integrate information across disparate systems, and (2) build, and share custom tools for special cases. We saw sysadmins collaborate in many ways, including helping each other in writing scripts, and sharing crucial system state to raise general awareness of the developing situation. We watched Rob repeatedly copy the number of http connections from a terminal window into a chat window so that others could see the same data. We also observed Rob, Jack, and others collaborate to write a script. Sysadmins often need to integrate information from multiple components of the infrastructure to analyze a situation end-to-end. In this case, while Jack examined the number of connections at the web application server, Rob examined the connections at the http server. Unfortunately, each relied on separate tools and so truly integrating information on a single display was not an option. Use of separate tools potentially led to increased cognitive demands, delayed problem resolution, and ultimately increased costs. Sysadmins often need to develop their own tools. In this case, there was a visualization tool for monitoring the application server’s connections, but nothing for the http server connections. Therefore, Rob wrote a tool himself. We watched an hour go by as several people attempted to simply output a timestamp and a count on a single line of text, let alone create a visualization of the connections. Based on this and other cases we observed, we see several requirements to support effective end-user programming for system administration: 1) A visual environment that supports for rapid development of custom tools in a flexible and powerful way, as in command-line interfaces, but one that also facilitates rich visual representation of and interaction with data, as in graphical user interfaces, 2) A task specific language that is highly reusable with components that supports integration of information from various systems, and 3) A shared workspace that supports collaborative practices of sysadmins including collaborative development of tools and sharing of data from multiple systems. A1: END USER ADMINISTRATORS
PROGRAMMING
FOR
SYSTEM
Nardi [17] identified three criteria for success of end user programming: (1) a visual environment, (2) a task-specific language, and (3) support for collaborative practices. A1, our spreadsheet environment for sysadmins, meets Nardi’s end user programming criteria. Let’s describe each in turn in more detail. A spreadsheet-based visual environment
Why a spreadsheet? We chose a spreadsheet as a starting point for several reasons. First, we wanted to leverage existing knowledge of the spreadsheet paradigm to allow administrators to create simple tools rapidly and potentially moti213
vate them to explore and experiment. Second, visual spreadsheet environments support a direct association of code and data to support reusability and incremental development, allowing users to examine cells, understand how they work, and build on existing code. Thus, users can easily take sheets passed on from others and modify them for their own purposes. Third, automatic cell naming through cartesian layout simplifies creation of small tools (though cells may be given user-specified names to help as tools grow more complex). Fourth, the grid simplifies graphical layout, a pain point in many tools (even command-line tools, as shown in the case study). Fifth, the spreadsheet model is more resilient and forgiving than most programming languages as an error in a cell only affects referring cells and does not necessarily invalidate the entire sheet or cause a program crash. Finally, As Nardi [17] notes, spreadsheets mix a textual language with charts and graphs, offering a mixture of command line and graphical interaction styles. This is an especially important point for gaining acceptance from system administrators, who typically prefer command-line interaction, yet seek to attain the higher situational awareness that graphical output can provide. A1 extends the spreadsheet paradigm with objects in cells, code in cells that act on objects, and sheets that can be deployed as web portlets, each of which are described in detail the next sections. These extensions are fully supported by the spreadsheet UI. A1 permits cells to contain arbitrary Java objects which can be used to manage external IT systems. Creating and interacting with these objects is simplified by a visual environment where various object components are available from a toolbar. Object-referencing formulas are simplified through popup windows that list available object methods, and the familiar copy and paste (as in spreadsheets) is used to replicate code effectively. Users can incrementally develop code that is always available for execution with rapid visual feedback, much like in interpreted languages and environments. A sysadmin-specific task language
To satisfy sysadmin needs, A1 extends the spreadsheet paradigm in two ways: (a) objects as first-class cell contents, and (b) event-driven procedural and functional code: Objects as First-Class Cell Contents
To support system administrators’ needs for control of external systems, A1 adopts an object-based approach. A1 provides a library of objects that can represent rich data types (e.g. collections, queues, stacks), connections to external systems (e.g. Secure Shell or JMX), graphical widgets (e.g. Button, TextBox, ComboBox), and visualizations (e.g. X-Y plot, pie chart). These objects are available from the toolbar to allow the user to point and click to connect to servers, for example. Objects have multiple properties (state) and methods (behavior). Formulas can refer to objects to query their properties, and method calls allow users to perform operations on objects (thereby altering the object’s state and triggering further execution). For instance, cell A2 can contain a sys214
tem object such as JVM (Java Virtual Machine) (e.g. A2: JVM()), cell A3 can contain the expression “=A2.freeMemory()” to query its available free memory, and cell A4 can contain the code “{A2!gc()}” to run the
garbage collector on the JVM object and later on to trigger cells that depend on A2. Some methods may require additional parameters, which can be specified using the familiar spreadsheet language (e.g. A2!load(A7) ). A1 uses weak typing when matching objects to parameters. For example, numbers are automatically converted to strings and vice versa depending on the context and methods involved. A1 supports the use of any Java object in cells. Java objects can be created in cells just like built-in objects (e.g. B1: java.util.Vector()) and methods can be used in expressions (e.g. = B1.size()) and code (e.g. {B1!addElement(A3)}). Though this can be sufficient for most purposes, A1 also provides plugin architecture for creating new objects to support graphical interaction and more sophisticated triggering mechanisms such as push from external processes (particularly important for interaction with remote systems). Once developed, new objects can be used just like built-in objects in code and expressions for controlling and querying systems. We believe the success of A1 will depend to a large degree on its containing a rich set of domain-specific objects. In A1, each object is associated with interactors that specify how it will be rendered on the screen, and how the user may interact with it. Objects can be rendered textually (when there are no interactors specified an object is rendered simply using output from its toString() method) or graphically (e.g. an X-Y plot). Interactors are platform independent objects that ensure that when interaction occurs events and state of objects are passed properly between the platform-specific interactor instances and the cell object. In the current implementation, A1 supports three platforms: text-based terminal, Java/Swing-based client, and HTML-based server. Each platform-specific instance defines how to render and process events in the platform, for example a text-based terminal platform interactor specifies how to render a Button in textual form and how to process keyboard events as button events, likewise an HTML-based server interactor renders the Button as a form input element. Event-driven Procedural and Functional Code
Rich control flow mechanisms may be required to support system administrators to effectively control systems, for example to execute commands on a remote system, delete log files, or change system configuration. To enable sufficient control flow capabilities in spreadsheets, A1 extends the spreadsheet language to include event-driven procedural code. These code blocks can be triggered to execute upon events, such as changes to cell values, clock ticks, button presses, or user-specified conditions. When triggered, code containing procedural statements can execute to assign new values to cells, distribute data collections across cell ranges, call object methods, and even trigger other code blocks.
A1’s event-driven code approach fits nicely with the spreadsheet metaphor, where functional code in expressions is implicitly triggered by the dependencies specified in cell expressions. A1 builds on this and provides further constructs, such as the on() construct, which allows code segments to define explicit triggers based on events (e.g. on (clock) {A2!gc()} ) and the when() construct, which triggers code based on boolean expressions, e.g.: when(A2.freeMemory()/A2.totalMemory() 0.9) { A1!compressDisk(0.2) }
It is worth mentioning at this point that A1 has a multithreaded engine that manages event queues properly for long-running tasks that are typical in system administration. Web portal-based collaboration support
To support collaboration between sysadmins, A1 spreadsheets can be deployed as portlets in a J2EETM-based web portal. In the web portal, administrators can execute tools deployed by their colleagues within their web browsers just like any other vendor-supplied portlets (as server-based portlets rather than as applets that run locally). The web portal approach greatly helps shared situational awareness, as different sysadmins can see the same view of the data. Tools deployed are stored in a shared tool repository, which can be used for customization. Tools deployed as portlets contain an “Edit” button that launches A1 development environment. Once the sheet is updated it can either replace the existing tool, or be saved under another name, and become immediately available for use as a web portlet. When a sheet is deployed to the portal and running in a web browser, objects are rendered and interacted with using the HTML form-based interactors. In this case, spreadsheets are rendered such that tool implementations are hidden and the tools look no different than any other portlet applica-
tion. To accomplish this, when rendering the portlet cells that contain code are hidden to the user. Users can also explicitly hide cells if they prefer to do so. One of the challenges in the web portlet implementation has been the need to support vastly different interaction models such as the HTML form-based interaction and event-based Java/Swing GUI interaction using a single language and model. In Swing applications users can interact with graphical user interface widgets that can immediately generate events and cause objects to be rendered to reflect changes. In the HTML form model, input elements are contained in forms that are submitted and processed by a web server. The difference is that in the web model users can make multiple changes on the form (such as entering text into “text” input elements) and submit the form using a button on the form, to minimize round trips. A1 handles these two different models uniformly through the use of platform independent interactors as discussed earlier and through “batched propagation”. Batched propagation essentially registers the current values of all “delayed” input elements (such as text input elements) on a portlet and upon interaction with an element that causes a server request it processes all delayed input elements first before processing the element that initiated the request. This way A1 accommodates HTML form based interaction much like the Swing GUI event model. EXAMPLE: CONNECTION MONITOR AND MORE
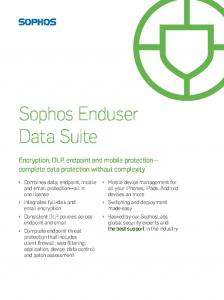
We now illustrate A1 through examples. We first consider the script Rob and Jack worked on and then extend the example to show how other features of A1 offer enhanced usability and power to sysadmins. Rob’s script was intended to monitor the number of connections from the http server. Essentially his script executed the UNIX shell command “ps –ef|grep http|wc –l” every two seconds and output the result along with the current time. In A1, Rob can start by creating an SSH connection to the server— say in cell B1—with parameters specifying server address, login, and password. To repeatedly execute the shell commands, he then creates a Clock in cell A1, with a frequency of 2 seconds. Lastly, he enters code in B2 that executes the shell command on the server and puts the result in B3 (See Figure 1): B1: SSH(“server”, “login”, “pwd”) A1: Clock(2) B2: on (A1) {B3 = B1!execute(“ps –ef |grep http|wc –l”)}
The SSH object in cell B1 can be created by simply selecting cell B1 and clicking the SSH button in the toolbar, and entering the address, login, and password. For the sake of simplicity here password is embedded in the code. A more security-aware tool would probably ask the user for the password via a password field in a cell. Here, the SSH object is rendered as text, whereas the Clock object is rendered using a flashing icon with a text of the current time. As Rob enters this “program” into the spreadsheet, he can see each cell functioning independently and can correct any 215
Figure 1. An HTTP connection monitoring tool created using A1. First, an SSH connection is created in cell B1. A Clock in cell A1 is set to trigger code in cell B2 to repeatedly execute the necessary commands to retrieve the number of http connections, which is reported on cell B3. A plot in A10 is also updated with new data from B3 regularly showing the number of connection graphically.
errors as he incrementally builds the code. He sees the active SSH connection in B1, the ticking Clock in A1, and the automatically updating value in B3. Rob can also make use of simple point-and-click capabilities to refer to cell objects and their methods as he writes the code. For example, the SSH object has a menu listing its available methods (e.g. execute), which can be accessed with a right-click on the object and inserted into the code. Use of point-and-click to develop code reduces the risk of syntax errors. Spreadsheets offer many other advantages to novice programmers, such as deferred variable naming, simplified input and output through tabular layout, natural control flow through events, and incremental code development. Rob would not need to worry about giving names to data either (though A1 supports user-defined cell names)—it is just a matter of putting information somewhere on the sheet. The tabular layout too makes input and output easy. Rob would not need to use explicit looping constructs to repeat execution, since it is all driven through events. Another major factor in ease of use is the ability to develop tools incrementally and interactively. Though this example demonstrates what Rob wanted to accomplish in the crit sit, we can easily extend it to tie data to graphical output: 216
A10: TimePlot() B4: on (B3) { A10!add(“http”, B3) } A TimePlot is an object that produces an X-Y plot where
the X-axis shows the time a point is added. B4 is another example of event-driven procedural code. Each time there is a new value in B3, it is added to the plot with a current time stamp to the line titled “http” (Figure 1). The tool developed can be deployed as a portlet, where it can be run for shared use and for further modification by Rob’s colleagues. For example, it would be natural for Jack to update Rob’s tool to include the application server’s number of connections in the same plot. This in fact was a major issue in the crit sit, i.e., effectively comparing the number of connections from these two servers. Objects such as SSH allow users to connect to remote servers, perform operations, and display results in A1 for further processing. A1 supports a number of other management APIs but SSH is particularly useful as it provides a bare minimum access to a large variety of servers. Additionally, it can be readily used to migrate or invoke existing scripts on servers, relatively easily, exposing only data and control needed in the new tool. This way system administrators can still use their shared portlet-based workspace to access and run their legacy scripts.
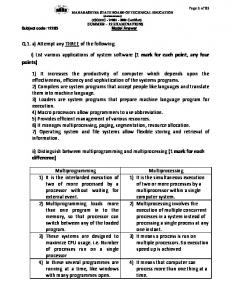
Figure 2. The HTTP connection monitoring tool updated to display connections from the application server as well, shown as a portlet in the admin portal workspace.
To access the number of connections from the application server, Jack would need to use JMXTM (Java Management Extensions), which is another system management API that A1 supports. JMX provides richer functionality than SSH, through its MBeans (management beans) that represent components with properties to query and methods to invoke. As in the previous case, Jack would simply click on the toolbar to create a JMX connection to talk to the application server, get the number of connections from a JMX MBean called “AppServer”, call the getConnectionCount method, and finally add the number to the plot under the title “appsrv”: C1: C2: C3: C4:
JMX(“server”, “login”, “pwd”) = C1.getResource(“AppServer”) = C2.getConnectionCount() on (C3) {A10!add(“appsrv”, C3)}
Note in this case that unlike SSH, JMX uses a push model, where the data are simply pushed into the spreadsheet, updating the value in B3. Here, the user did not even have to create a timer to drive the command execution. Once Jack saves the tool to the same repository, it becomes immediately available on the portal workspace (Figure 2.) showing data from both servers on the same plot.
Other changes to the tool can be made equally easily. For example, it probably makes sense in the crit sit case to notify Rob when the number of connections reaches a certain level. A1 provides a mail service that can connect to an SMTP server and send emails: D1: MailService(“server”) D2: when (B3 > 100) { D1!sendMail(“from”, “to”, “alert!”, “check http server”) }
One simple generalization of the tools would be to create text fields to allow users to enter server addresses, login, and password and add a buttons to clear the plot: B1: B5: B6: B7: B8: B9:
SSH(B5, B6, B7) TextField() TextField() TextField() Button() on (B8) {A10!clear()}
As shown, A1’s object-based approach and event-driven procedural code allow sysadmins to work effectively. With the level of abstraction appropriate to the tasks of system administration, sysadmins can use a variety of objects in a single sheet, and interact with multiple remote systems in an integrated manner. The portal deployment of tools enables collaboration not only in data sharing but also in tool development. 217
USABILITY STUDY
Results and Discussion
We conducted a preliminary usability study of A1. Our goals were to see (1) whether sysadmins and others could use A1 to develop reasonably complex tools given little training, and (2) what kinds of errors would be made so that we might effectively target modifications to the interface, language, and model.
In all, five of the twelve participants completed both tools in the allotted time. Three completed only the first tool, while the remaining four only completed part of the first tool. Our detailed analysis of the first tool indicates that on average, participants completed 79% of the required functionality with no error, when measured by the number of particular objects, expressions, and code to be written is considered. Of the remaining functionality 6% contained errors, and 15% was missing. Given the complexity of the tools and the limited time to learn a new language and environment and develop the tools, the results are encouraging, especially since the tool they developed is a real tool that they could use in their day to day work.
Method
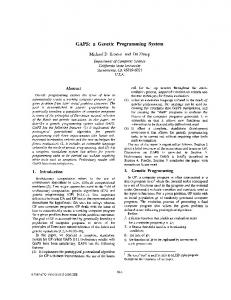
Twelve participants, seven professional sysadmins and five professional programmers, all casual spreadsheet users, participated in the three-hour usability study. Of the seven system administrators, two had more than four years scripting experience, and the rest had either none or little scripting experience (less than 2 years). First, participants received a self-paced tutorial of the A1 programming language and user interface (which typically took about 30 minutes). Second, participants practiced using A1 by developing a simple tool based on explicit stepby-step instructions (also about 30 minutes). Third, participants were asked to develop two system administration tools, one based on the other, given only descriptions of the tools’ behaviors. Finally, an interview was conducted with participants to learn more about their experiences. The first tool was a log-space-monitoring and backupautomation script for an http server. The programming task included querying the http server for its current log disk, querying the file system for disk utilization of the log disk (e.g. free vs. used), registering listeners to monitor disk utilization, notifying the system administrator through email when disk space is approaching full, and stopping http server and starting backup on the disk when it’s full. The second tool extended the first one to switch log disks automatically when two disks are available on the filesystem (Figure 3).
Success was partly related to prior programming or scripting experience. Four of the seven with experience completed both tools; the remaining three completed only the first tool. One participant with little scripting experience completed both tools. Because the target users of A1 are mainly sysadmins who have some scripting experience (i.e., they already write scripts regularly), the results suggest our target sysadmins will do reasonably well with A1. Note that both tools were quite sophisticated in complexity (requiring between 35 and 45 cells with objects, code, and expressions). On average, 36% of the code had to do with system interaction, 21% with user interface, 15% data presentation, and 28% with data processing. When examined by function, most participants had few or no problems coding user interface and data presentation, whereas system interaction and data processing had relatively more errors (Figure 4). Our analysis of errors indicated that about half of the errors were in fact not harmful---in the sense that they were either redundant or did not affect the functionality of the tool,
Figure 3. A participant’s implementation of the second tool, showing server status and monitoring controls, disk utilization visualizations, and code blocks including automatically switching log disks, starting a tape backup, restarting the http server, and notifying a sysadmin through email.
218
Code Completeness by Function
7%
Error Types 20%
120
Missing Trigger
Percent
100
Wrong Cell Reference
80
Missing
60
Error
40
Correct
27%
Wrong Trigger API Problem
13%
20
Event Sequencing
0 System
Interaction
Presentation
Arithmetic Error
Data Processing
Area
Figure 4. Analysis of completeness by function.
20%
13%
Figure 5. Analysis of functional error types.
such as a wrong title on the utilization pie chart. Errors that affected functionality included problems in event sequencing (27%), missing triggers (20%), and incorrect use of the APIs (20%) (Figure 5.)
Some of our other findings mirrored those of other spreadsheet studies [18]. In particular, we saw problems of wrong cell references and unexpected formulas resulting from copy and paste.
Our main interest in doing the study was to gain some understanding of programming errors in A1, particularly those that might be barriers for users. Like Ko and Myers [12], we found users with little scripting experience had problems with knowledge of and attention to language constructs (important for the event-based model) and libraries (important for the object-based approach). For instance, some of these participants interpreted the on() construct as a means to perform actions on objects (e.g. .()) as opposed to the intended meaning of registering a listener of events on objects and then performing consequent actions (e.g. on () { }). There were also errors in which participants neglected to specify the object to perform actions on (e.g. () rather than .()).
Based on these results, we are revising the language of A1, particularly on constructs for event listening and processing, and by providing user interfaces for API browsing to make the environment more programmer friendly. However, overall we are pleased to see that the extension of the spreadsheet language was adopted pretty well, resulting in very few errors (6%).
Participants with little scripting experience also made strategic errors in implementing algorithms, though incremental development mitigated this to some extent. In fact, many users commented favorably on the incremental and interpreted nature of development in A1. One said, “It allows me to do things in my own order. I can refer to a nonexisting object. I know I’m going to create the object next.” Another said, “The fact that I can interact with my systems in real time in the spreadsheet that alone is pretty cool.” And another added that building tools this way was “the quickest live application [I] ever made”. Event-based programming was more popular among novice than expert script developers. Whereas expert script developers had a tendency to put all logic into one cell with sequences of actions, novices preferred to break up compound statements and then connect them, as one put it: “I don’t have a clear picture of how the final result would be like. I simply started by putting down things that I can handle, connect them, and make sure they work. […] It allows me to build things incrementally.”
CONCLUSION
A1 is a spreadsheet-based workspace meant to help system administrators manage large computer systems. It was designed to address system administrators’ needs for integration, collaboration, and customization in building their own tools. A1 extends the spreadsheet metaphor through an object-based approach and an event-based approach to provide more power and usability. Through the object-based approach, system administrators can build tools that connect to remote systems, inquire about system status, and control multiple systems in an integrated manner. The event-based approach takes spreadsheets further into the realm of programming, enabling rich flow of control with the right balance of procedural and functional constructs. Though a more detailed analysis of errors and barriers is yet to be done, our preliminary usability study suggests that sysadmins with some scripting experience can use A1 to develop sophisticated tools in a relatively short time. At this stage we preferred to conduct a usability study as opposed to a user experiment against one of the scripting languages because it would be extremely hard to control variables. Also our goal is to support tool development for web-based system administration and we know for a fact that majority of system administrators do not have such experience. Based on preliminary findings A1’s design is also in line with previous studies of programming languages [16], which show that users prefer event-based over sequential programming models, aggregate operators over iteration (A1 supports both), and graphical layout for depicting over219
all program structure with text to describe actual actions and behaviors (spreadsheet layout accommodates both). Much remains to be seen about the acceptability of A1. We believe A1 addresses most of the needs, concerns, and preferences of system administrators, including the preference for command-line interaction. To learn more, we are currently conducting field studies of A1 in use at real-world system administration work locations. In fact for more than a few months we have been conducting longitudinal studies of A1 in a number of field deployments. So far we collected a lot of valuable requirements, such as security, access management, etc. and we are happy to see a lot of interest in A1 as it is being put to test in the real world. We expect to provide support for a fine granularity access and update mechanisms, where administrations would broker for read/write rights to parts of the code. We plan to conduct further studies on the reusability of A1. ACKNOWLEDGMENTS
We thank the system administrators who participated in our field studies and in the preliminary study of A1 for their time and their thoughtful suggestions. We also thank Leila Takayama for her contributions to the field study. REFERENCES
1. Ambler, A. Forms: Expanding the Visualness of Sheet Languages. Workshop on Visual Languages, (Linkoping, Sweden, 1987), 105-117. 2. Barrett, R., Kandogan, E., Maglio, P. P., Haber, E. M., Takayama, L. A., Prabaker, M. Field Studies of Computer System Administrators: Analysis of System Management Tools and Practices. Proc. CSCW 2004. 3. Barrett, R., Chen, M., & Maglio, P. P. System Administrators are Users, Too: Designing Workspaces for Managing Internet-scale Systems, Workshop held at CHI 2003, Ft Lauderdale, FL, 2003. 4. Burgess, M. Cfengine: a site configuration engine, USENIX Computing systems 8, 3, (1995). 5. Burnett, M., Atwood, J., Djang, R. W., Reichwein, J., Gottfried, H., Yang, S. Forms/3: A first-order visual language to explore the boundaries of the spreadsheet paradigm. Journal of functional programming 11, 2 (March 2001), 155-206. 6. Casimir, R. Real Programmers Don’t Use Spreadsheets. ACM SIGPLAN Notices 27, (June 1992), 10-16. 7. Clack, C., Braine, L. Object-oriented functional spreadsheets. Proc. 10th Glasgow Workshop on Functional Programming (GlaFP’97), (September 1997).
10. Hughes, C., Moshell, J. Action Graphics: A Spreadsheet-based Language for Animated Simulation. Visual Languages and Applications (T. Ichikawa, E. Jungert, R., Korfhage, eds.) Plenum Publishing (1990), New York, NY, 203-235. 11. Joy, William. An introduction to C Shell. 12. Ko, A. J., and Myers B. A. Development and evaluation of a model of programming errors. IEEE Symposia on Human-Centric Computing Languages. (Auckland, New Zealand, 2003), 7-14. 13. Levoy, M. Spreadsheets for Images, Computer Graphics 28, (1994), 139-146. 14. Microsoft Corp, Microsoft Excel Users’ Guide, Redmond, WA. 15. Myers, B. A., Graphical Techniques in a Spreadsheet for Specifying User Interfaces. Proc. CHI ’91, ACM Press (1991), 243-249. 16. Myers, B. A.., Pane, J. F., Ko, A. Natural Programming Languages and Environments. Communications of the ACM 47, (September 2004), 47-52. 17. Nardi B. A Small Matter of Programming: Perspectives on End User Computing. MIT Press, Cambridge, MA, USA, 1993. 18. Panko, R. What We Know About Spreadsheet Errors. Journal of End User Computing 10, (1998), 15-21. 19. PIKT, Problem Informant/Killer Tool, pikt.org 20. Smedley, T., Cox, P., Byrne, S., (1996). Expanding the Utility of Spreadsheets Through the Integration of Visual Programming and User Interface Objects, Proc. AVI ’96, Gubbio, Italy, May 27-29, 1996, 148-155. 21. Spenke, M. and Beilken, C. A Spreadsheet Interface for Logic Programming. Proc. CHI ’89, ACM Press (1989), 75-80. 22. Stadelman, M., A spreadsheet based on constraints. In Proc. UIST ‘93, ACM Press (1993), 217-224. 23. System Administrator Guild (SAGE) Salary Surveys. Available at http://www.sage.org/salsurv/ . 24. Wack, A., Partitioning Dependency Graphs for Concurrent Execution: A Parallel Spreadsheet on a Realistically Modeled Message Passing Environment, Ph.D. Thesis, Department of Computer and Information Sciences, University of Delaware, 1995. 25. Wagner, J., A One-stop Console for Administrators. http://www.internetnews.com/dev-news/article.php/3484246
8. Du, W., Wadge, E. An intentional language as a basis of a 3D spreadsheet design. Proc. ICCL ’88, IEEE Press (1988), 2-9.
26. Wilde, N. Lewis, C., Spreadsheet-based Interactive Graphics: From Prototype to Tool, Proc. CHI ’90, ACM Press (1990), 153-159.
9. Hudson, S. User Interface Specification Using an Enhanced Spreadsheet Model, ACM Trans. On Graphics, (July 1994), 209-239.
27. Yoder, A. G., Cohn, D. L. Real spreadsheets for real programmers. Proc. ICCL ‘94, IEEE Press (1994), 2030.
220