Nov 16, 2007 - Tehuantepec, Mexico to intermittent forcing by northerly winter winds. Features ... Topographically Influenced Winds; Gulf of Tehuantepec; SAR.
ESA
Earth Home
Missions
Data Products
Resources
Applications Directory 16-Nov-2007
Search go About
SYNTHETIC APERTURE RADAR (SAR) REMOTE SENSING OF WIND-DRIVEN CIRCULATION IN THE GULF OF TEHUANTEPEC, MEXICO. David S. Kirby1,2, Eric D. Barton1, E. Gay MitchelsonJacob1, Armando Trasviña3
Earthnet Online Earth Observation
1 School of Ocean Sciences University of Wales, Bangor Gwynedd LL57 2DG, UK. Phone/Fax: +44 (0) 1248 382848
oss041 bangor.ac.uk
User Services 2 Now with: Earth Observation Science Group University of Leicester LEICS. LE1 7RH, UK.
Accessing EO Data How To Apply How To Access
Phone/Fax: +44 (0) 116 252 3350/3330
3rd ERS SYMPOSIUM Florence 97 Abstracts and Papers
dsk2 leicester.ac.uk
SAR remote sensing of wind-driven circulation of the Gulf of Tehuantepec Mexico SYNTHETIC APERTURE RADAR (SAR) REMOTE SENSING OF WINDDRIVEN CIRCULATION IN THE GULF OF TEHUANTEPEC, MEXICO.
3 Department of Tropical Physical Oceanography CICESE subsede Baja California Sur La Paz 23050, B.C.S. Mexico
Phone: +52 (112) 1 3031 trasvi cicese.mx
ABSTRACT This observational study using synthetic aperture radar (SAR) data from the satellites ERS-1 and ERS-2, builds on previous work to determine the response of the Gulf of Tehuantepec, Mexico to intermittent forcing by northerly winter winds. Features of modified radar backscatter have been imaged which can only be explained in terms of the wind-driven circulation and specifically the large (200 km) anticyclonic gyre that develops after a wind event. Use is made of near-coincident AVHRR sea surface temperature data, land-based wind data, Lagrangian drifter trajectories and hydrographic information in order to interpret the SAR images in terms of the oceanographic processes occurring. Consideration is given to the probable imaging mechanisms responsible for SAR data capture and it is thought that atmospheric boundary layer stability may be an important factor. KEYWORDS: Coastal Circulation; Topographically Influenced Winds; Gulf of Tehuantepec; SAR. _____________________________________________ The SAR data for this project were provided by ESA through project AO2.UK131: "The application of ERS-2 remotely sensed data to forcing of coastal circulation by topographically influenced winds and freshwater outflow." The AVHRR data were provided by G.Quiros from the Laboratorio de Oceanografía Costera, Universidad Nacional, Heredia, Costa Rica. DSK was supported by the European Social Fund for an M.Sc. in Applied Oceanography and would like to express his gratitude towards his supervisors and co-authors, EDB, EGM-J and AT.
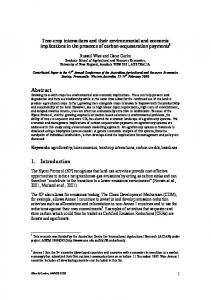
1. INTRODUCTION The Gulf of Tehuantepec is a large bight on the southern Pacific coast of Mexico. It extends from 92.3o W to 96.4o W at around 16o N (Fig. 1). The head of the Gulf is its northern shore, located at 95o W opposite the narrowest part of the Isthmus of Tehuantepec, which is about 120 miles across at this point. Here the relatively broad continental shelf that lies along all Central America narrows abruptly and gives way to a deeper trench (depths over 5000 m) which follows the coastline northwards.
Figure 1: The Gulf of Tehuantepec, showing the axis of the wind jets (® ) and location of the meteorological station ()at Santiago Astata (95o W 16o N).
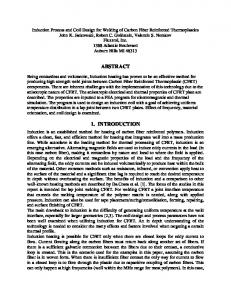
Regional Meteorology From November to April, atmospheric pressure rises to high levels over the Gulf of Mexico but remains low over the Pacific. The two regimes are separated by the continental mountains of the Sierra Madre. Cold, dense air may spill through the Chivela Pass, generating an offshore wind jet over the Gulf of Tehuantepec. Wind speeds can exceed 25 m.s-1 and the jet may persist from several hours up to several days. This may occur 10 to 15 times in a typical winter. The phenomenon occurs elsewhere in Central America but is best documented for the northerly 'Tehuantepecanos' blowing over the Gulf of Tehuantepec (Hurd, 1929; Roden, 1961; Stumpf, 1975; Barton et al., 1993). The pattern of winds during the imaging period is shown in Figure 2. A wind event clearly occurs from 08 to 12 March.
Figure 2: Wind Velocity over imaging period
Atmosphere - Ocean Coupling A cause and effect relationship between wind and sea surface temperature, involving upwelling of subsurface water was suggested after early observations in the area (Cromwell, 1956). One of the first comprehensive studies dealing with the oceanographic and meteorological conditions in the Gulf is that of Roden (1961). The most recent and detailed efforts are based on fieldwork carried out in 1989 (Barton et al., 1993; Trasviña et al., 1995). During a wind event sea surface temperature drops by up to 8o C where the wind speed is maximum, and also in immediately adjacent regions. The wind jets fan out from their source at the head of the Gulf to about 500 km seaward, spreading out to over 200 km across. The surface water of the Gulf is found to be persistently cooler (by at least 1o C on average) than that in adjacent parts of the ocean. This cold water, which extends several hundred kilometres seaward, is also nutrient-rich and biologically productive (Brandhorst, 1958; Roden, 1961; Blackburn, 1962; Stumpf and Legeckis, 1977). The maximum sea surface temperatures in the open Gulf vary between 29o and 30o C and in localised coastal areas between 31o and 34o C.
Horizontal and Mixed Layer Dynamics The horizontal current regime during a wind event was described and modelled by Trasviña (1991). As the northerly wind strengthens, the south/south-westward flow intensifies rapidly to form an offshore jet, centred along the thermal fronts west of the cool central waters. Alongshore currents as strong as 1 m.s-1 converge towards the wind axis, replacing the waters advected offshore. These alongshore flows lag the start of the wind event, by one day in the west and by over two days in the east After the wind stops, the offshore jet broadens and reaches geostrophic equilibrium. The wind-induced flow produces significant net Ekman transport from the eastern towards the western Gulf. As a consequence, the thermocline in the west deepens to ~ 120 m while in the east it rises to near the surface. Approximately one inertial period after the cessation of the wind the Coriolis force comes into balance with the horizontal pressure gradient force and the circulation in the western Gulf evolves into a large anticyclonic eddy with the offshore flow becoming part of the eddy. In contrast, the circulation in the eastern Gulf shows only a slow cyclonic return flow. The reasons for this asymmetry are not clear but numerical experiments reproduce the flow field through realistic coastline variations including a broad shelf in the eastern Gulf. Satellite-tracked drifters deployed in the Gulf during the imaging period describe this asymmetric circulation (Kirby, 1996). Vertical wind mixing and consequent surface cooling occurs during the most intense phase of the event. This produces a dense surface water mass, part of which later sinks, mainly along isopycnals, beneath the convergence zone on the eastern flank of the eddy.
The Relaxation Phase After formation, the warm core eddy migrates offshore. As it moves it is eroded by smaller cyclonic structures at its boundaries as well as by leaving a trail of warm water in its wake. Eventually it is assimilated with the large-scale westward flow. Within the Gulf itself, the cessation of the offshore wind forcing allows the waters in the eastern Gulf to flow northwest along the coast and across the head of the Gulf, replacing the cooler wind mixed waters until another cycle commences.
2. THE DATA
Many SAR images were analysed during this study and a selection which captured signals that are attributable to the wind-driven circulation are presented here, alongside near-coincident AVHRR images.
Figure 3: Sea surface temperature image (AVHRR) for 11 February 1996 Figure 3 shows the sea surface temperature field for 11 February. The anticyclonic eddy can be seen to the west. The Gulf is in the relaxation phase, with a warm coastal current extending from the south-east, across the head of the Gulf. Figure 4 is a SAR image captured three days earlier. It shows concentric bands of alternately high and low backscatter intensity marking the shape of the then juvenile eddy, and also shows many groups of regularly spaced signals in the central Gulf. These are probably internal waves and they are discussed in more detail below. In response to the wind event of 08 to 12 March (see Figure 2) the central Gulf cools and the eddy begins to form. The sea surface temperature (AVHRR) image shown in Figure 5 is from 12 March, which was the nearest cloud-free day to the 14 March when the SAR images shown in Figure 6 were captured. The location of the SAR frames is shown on the AVHRR image.
Figure 4: SAR image for 08 February 1996
Figure 5: AVHRR image for 12 March 1996 At the time of SAR data capture, the wind strength has fallen (Fig. 2). The eddy is demarcated on the lower SAR image by the sharp boundary in backscatter intensity, with the warm surface waters of the eddy giving a relatively brighter signal than the cooler, mixed waters of the central Gulf. The boundary of the eddy has clearly moved southwards between the times of SST and SAR data capture. The slicks south of the eddy trace what is probably a baroclinic frontal instability with cylonic flow.
Figure 6: SAR images for 14 March 1996
3. DISCUSSION The patterns captured in Figure 4 suggest much internal wave activity which may play a role in the mixing of the waters in the central Gulf. At the boundary between stratified waters and the well-mixed surface waters of the central Gulf, the change in density structure may cause reflection of internal waves, with some mixing and loss of energy through partial or complete breaking. There is a need for more theoretical analysis here and this is currently being undertaken. There are also regularly spaced signals concentric with the boundary of the eddy, which have been captured in all the SAR images presented here (Figs. 4 & 6). The wavelength is too long (1-10 km) to be the swell wave field and the fact that the signals are concentric with the boundary of the eddy discounts any direct wind effect. The spacing is of the same order as the wavelength of internal waves but it is difficult to suggest a mechanism for their creation inside the eddy. The signals may be the manifestation of mutiple and regularly spaced current shear boundaries. Trasviña (1991) records ADCP currents greater than 1 m.s-1 at the southern periphery of the eddy with zero rotational flow at the centre and offshore currents outside the boundary of less than 0.5 m.s-1. The current is more likely to increase 'stepwise' than uniformly towards its maximum at the outer edge of the eddy. Vesecky and Stewart (1982) describe, "a series of straight and curved filamentary structures," marking a warm water ring, to which they ascribe the image of a, "mid-section slice through an onion," and which they tentatively attribute to current shear. Certainly these images (Figs. 4 & 6) have captured similar signals and it would again be reasonable to attribute them to current shear. One of the most interesting questions raised when working with SAR data is how the sensor has actually captured the underlying process occurring in the sea, in this case the warm anticyclonic eddy. The mechanisms which act to modify the Bragg-scattering capillary wavefield are of wider interest as they may be diagnostic for specific oceanographic features. In the case of the eddy captured in Figure 5, the imaging mechanism is not immediately apparent. The division of an image into large areas of high and low backscatter intensity with a sharp boundary between them is usually characteristic of the overlying windfield (Johannessen et al., 1994). This explanation cannot, however, be admitted here as it is known that the wind behaves as a Gaussian jet from its source at the coast. In this case, rather than a sharp band marking the frontal boundary of the eddy, the whole area within the eddy is expressed through relatively high backscatter and the waters outside the eddy through relatively low backscatter. A plausible explanation for this is given by Vesecky and Stewart (1982) after work by Ross (1981). They note that, "variations in image intensity may also reflect changes in air-sea temperature difference," which difference is also
known as 'atmospheric stability.' Ross (1981), found that SEASAT SAR and SLAR (side-looking airborne radar) image intensity showed a clear drop as the observations move from the warm (25 oC) Gulf Stream to the colder (19 oC) Atlantic. The air-sea temperature difference becomes positive outside the Gulf Stream (as it does outside the Tehuantepec eddy) and the atmospheric boundary layer becomes more stable. This increase in stability results in a reduction in the air-sea momentum flux, i.e. less wind stress on the sea surface, which results in fewer Bragg resonant capillary waves and consequently reduced radar backscatter in the SAR and SLAR images. In the Gulf Stream experiment the temperature differences involved are comparable to, or less than, those in the Gulf of Tehuantepec. The imaging mechanism described above would therefore seem to offer the most plausible explanation for this case. The weak cyclonic re-circulation in the eastern Gulf seems to have eluded the various sensors deployed in this study. SAR images were obtained for the eastern Gulf but as the temperature gradients and velocity shear are not nearly as strong on this side, no features were captured which could be attributed to the cyclonic flow.
4. REFERENCES Barton, E.D., M. L. Argote, J. Brown, M. Kosro, M. Lavin, J.M. Robles, R.L. Smith, A. Trasvina, H.S. Velez (1993) Supersquirt: Dynamics of the Gulf of Tehuantepec, Mexico. Oceanography, 6 (1), 23-30. Blackburn, M. (1962) An oceanographic study of the Gulf of Tehuantepec. U.S. Fish Widl. Serv. Spec. Sci. Rep. Fish., 404, 28pp. Bradhorst, W. (1958) Thermocline topography, zooplankton standing crop, and mechanisms of fertilisation in the Eastern Tropical Pacific. J. Cons. Cons. Int. Explor. Mer., 24(1), 16-31. Cromwell, T (1956) "EASTROPIC" expedition. Pacific Fisherman, 54(8), 25-29 Hurd, W.E. (1929) Northers of the Gulf of Tehuantepec Mon. Wea. Rev., 57, 192-194 Johannessen, J.A., G. Digranes, H. Espedal, O.M. Johannessen, P. Samuel, D. Browne, P. Vachon (1994) SAR Ocean Feature Catalogue. European Space Agency Spec. Publ. 1174 Kirby, D. S. (1996) Synthetic Aperture Radar (SAR) Imaging of the Gulf of Tehuantepec, Mexico. M.Sc. thesis, University of Wales. Roden, G.I. (1961) On the wind-driven circulation in the Gulf of Tehuantepec and its effects upon surface temperatures Geophys. Int. 1, 55-72 Ross, D. B. (1981) On the windspeed dependency of SEASAT synthetic aperture radar observed backscatter, in Spaceborne Synthetic Aperture Radar for Oceanography, edited by R. C. Beal, P. S. De Leonibus and I. Katz. pp. 75-86 John Hopkins Univ. Press, Baltimore, Md. Stumpf, H.G. (1975) Satellite detection of upwelling in the Gulf of Tehuantepec, Mexico, J. Phys. Oceanog., 5, 383388 Stumpf, H.G. and R.V. Legeckis (1977) Satellite observations of mesoscale eddy dynamics in the Eastern tropical Pacific Ocean. J. Phys. Oceanog., 7, 648-658 Trasvina Castro, A. (1991) Offshore wind forcing in a coastal ocean: observations and modelling of the Gulf of Tehuantepec, Mexico. Ph.D. thesis, University of Wales. Trasvina, A., E.D. Barton, J. Brown, H.S.Velez, P.M. Kosro, R.L. Smith (1995) Offshore wind forcing in the Gulf of Tehuantepec, Mexico: the asymmetric circulation. J. Geophys. Res. 100, 20,649-20,663 Vesecky, J.F. and R.H. Stewart (1982) The observations of ocean surface phenomena using imagery from the SEASAT synthetic aperture radar: an assessment.