In this paper, we compare the characterisation techniques that have developed over ... displacement energy through pump pressure or a movable membrane.
Conventional filtration theory and compressional rheology are interchangeable when using characterisation techniques correctly Eric Höfgen1), Sophie Kühne2), Urs Peuker2), Anthony D. Stickland1)* 1)
Particulate Fluids Processing Centre, Department of Chemical and Biomolecular Engineering, The University of Melbourne, Parkville VIC 3010, Australia 2) Institute of Mechanical Process Engineering and Mineral Processing, Technical University Bergakademie Freiberg, Germany
Abstract Solid‐liquid separation is carried out in many industries and plays a crucial role in overall process efficiency and product specification. The dewatering characteristics of solid‐liquid mixtures, or particulate suspensions, have to be determined to compare filtration equipment performance or to design new equipment. Two theoretical frameworks used to describe solid‐liquid separation, and therefore analyse experimental results, are the conventional filtration theory developed by Ruth, Tiller and Shirato and the compressional rheology framework developed by Buscall and White. In this paper, we compare the characterisation techniques that have developed over time based on these two approaches. This includes a comparison between the Nutsche cell, the Compression‐Permeability Cell and a piston‐driven filtration rig. The test material is calcium carbonate of different particle sizes flocculated by attractive Van der Waals forces at its isoelectric point, leading to varying degrees of compressibility. The results show good agreement between the two theoretical frameworks for slightly and highly compressible materials. Overall, this work highlights the differences and similarities between the theories and characterization techniques alike and gives recommendations for good practice.
1 Introduction Filtration is a common process in industries such as mining, water and wastewater treatment, life sciences and in the production and recycling of paper, for example. The aim of filtration is to increase the solids concentration by applying a driving force for consolidation of the suspended solid phase. Such driving forces can be gravity in sedimentation, centrifugal acceleration in centrifugation, negative mechanical displacement energy through vacuum filtration or positive mechancial displacement energy through pump pressure or a movable membrane. All these processes are widely
applied in industry with varying objectives ranging from product specifications, handling and disposal. In a suspension with low solids content, particles are far apart from each other with no direct interaction between them. During dewatering, the solids concentration increases and at a certain point particles are close enough to form a continuous load‐bearing network structure that exhibits a strength against consolidation. This strength is a function of solids concentration, such that increasingly more energy has to be put in to consolidate further. At some point the process objectives and the process energy consumption can lie outside the economically feasible range. In order to reduce this discrepancy, optimisation of solid‐liquid separation processes and equipment is necessary. Currently, a variety of solid‐liquid separation theoretical frameworks is applied worldwide. Most theories implement Darcy’s law [1] to describe the rate of liquid flow through a porous solid phase based on the permeability of the solid phase. The assumption is then often made that the filter cake is homogenous and incompressible. Grace [2] then introduced the Compression‐Permeability cell (CP‐cell) for characterisation of materials, which demonstrated that the rate and extent of filtration were functions of the applied pressure for many materials. Suspensions can be ‘slightly compressible’ for hard, non‐interacting or stabilised spheres, ‘highly compressible’ for flocculated and coagulated inorganic suspensions, and ‘extremely compressible’ for biological sludges. Conventional filtration theory for compressible materials, often attributed to Tiller et al. [3–6], considers the applied pressure as the explicit variable and uses the specific filter resistance α(p) as a measure of the rate of filtration and the filter cake porosity ε(p) (or solidosity, εs(p) = 1 – ε) as a measure of the extent of filtration. The null stress porosity ε0 is the porosity when the solids network forms, i.e. ε0 = ε(p = 0). Conventional theory [7] is also attributed to Shirato as well due to his contributions to the modified Darcy‐Shirato Equation [8], the constant rate [9] and the variable pressure‐variable rate descriptions [10,11]. Compressional rheology [14] also describes the dewatering behaviour of suspensions using two material functions, namely the compressive yield stress, Py(ϕ), and the hindered settling function, R(ϕ). Py(ϕ) represents the resistance against consolidation and R(ϕ) describes the solid‐ liquid interphase drag, which is inversely proportional to the Darcian permeability. Both material functions are monotonically increasing with solid volume concentration ϕ, which is related to the porosity = 1 – The solids volume fraction at which the solids network forms is called the gel point ϕg, such that Py(ϕg) = 0. Py(ϕ) then increases and becomes infinite at random close packing.
R(ϕ), as a drag parameter, is 1 at infinite dilution, where the particles do not interact with each other, and infinite as ϕ approaches 1. The compressional rheology framework was developed by Buscall and White to describe the settling behaviour of flocculated suspensions [14] and was then extended by various authors to other solid‐liquid separation problems [15–22]. Bürger and Concha [12] developed a similar concept with different notation based on the Kynchian settling velocity [13]. Both theoretical foundations analyse filtration tests of some sort to measure the material filtration properties. These include cake compression and permeation in the Compression‐Permeability cell (CP cell), and cake formation and compression in pressure filtration. Filtration can be piston‐driven or air‐driven, such as the Nutsche filter. An important conceptual difference between conventional theory and compressional rheology is how the solid‐liquid separation is regarded. Grace, Ruth, Tiller, Shirato et al. consider the separation from a process point of view, while in contrast Buscall and White formulated it in a material‐centred approach. This means that in compressional rheology the material functions are an explicit function of the solids concentration, while the conventional theory is expressed in dependence of the applied pressure and only implicitly as a function of the solids concentration. The conventional approach usually involves average values to describe filtration processes such that conventional theory is espeacially useful for slightly compressible materials whose filtration parameters do not change much with increasing pressure. The average specific filter resistance, αav presented by Ruth [23,24] and then elaborated by Grace [2] is calculated by determining the integral of the local specific filtration resistances αx over the applied pressure range p‐p1 formulated as,
(1)
with the solids pressure, ps, p1 the starting pressure of a filtration run and p2 the final pressure of a filtration run. Generally, most authors use just use the average filter cake resistance to describe entire filtration processes even though the filter cake resistance might change over the course of filtration. This is especially true for compressible materials like biological, fine mineral suspensions or suspensions made of different constituents. The reasons for the change in filtration resistance can be manifold, ranging from colloidal interaction forces and/or particles which are deformable and/or porous. It is therefore important to characterise materials over a wide range of solids concentrations to capture the entire filtration behaviour. When performing characterisation tests it is important to realise what is happening during the characterisation in order to obtain reliable data. For example, when measuring compressibility, an important point is that tests have to be run until equilibrium is
reached and no changes occur in the filter cake structure. Neglecting that the filter cake has reached this equilibrium can yield to filter cake solids concentrations that are too low for the applied pressure. As demonstrated in this work, this applies especially for characterisation techniques that use a gas pressure as a driving force such as the Nutsche cell. This implies another issue in characterising materials. Generally, materials should be characterised under the same conditions as they occur in the process. However, this implies that one has to run new tests whenever a new solid‐liquid separation device is installed or a plant is modified to suit higher throughputs. In order to understand a material, a complete characterisation should be carried out with equipment which allows filtration up to the consolidation equilibrium. This implies that air‐driven filtration devices as the Nutsche‐cell are just suitable for characterisation below the capillary pressure of the material, which equates to the breakthrough pressure [20,25]. Thereby, it is better to use piston‐driven characterisation devices as the Compression‐Permeability‐Cell (CPC) [2] or the dead‐end filtration rig [26,27]. This paper compares the two different frameworks of the conventional filtration and the compressional rheology theories, with emphasis on the characterisation generally carried out in practice. Therefore, the CPC, the piston‐driven‐dead‐end filtration rig (FR) and the Filter Nutsche cell (FN) are compared based on their characterisation performance. In order to do this, a chalk suspension screened to different particle sizes is used (Omyacarb 2, 10 and 40). Because of the varying particle size the suspensions show a different degree of compressibility and allow comparison of the devices in regards to their performance for compressibility and permeability.
2 Theory 2.1
Conventional filtration theory
The specific filtration resistance macroscopically describes the drag between solid and fluid phase. Darcy [1] established a fundamental law describing the fluid flow through a porous bed as,
∆
,
(2)
where dV/dt is the specific flow rate, Δp is the pressure drop across the cake, η is the fluid viscosity, hc is the filter cake height, kD is the Darcy‐permeability and Rm is the membrane resistance. Note that, in this formulation, V is the specific volume or volume per unit area, V = v / A.
During permeation of a packed bed, for example in CPCs or for filter cake washing, Darcy’s Law can be rearranged to become: Δ
(3)
.
,
where αm,permeation is the specific cake resistance from filter cake permeation, is the solids concentration, and ρs is the solid phase density. Note that derivation of Equation Error! Reference source not found. requires the following relationship between the Darcian permeability and the specific cake resistance, αm: 1
(4)
During constant pressure, integration of Darcy’s Law leads to the general filtration equation [7,24,28,29]:
/ Δ
2
1
(5)
where V is the specific volume of filtrate, αm is the specific cake resistance, and c is the dry cake mass per filtrate volume. c is the effective feed solids concentration and can be obtained from the solid phase density ρs, the cake solids concentration and the feed solids concentration 0 as:
(6)
In Equation (5), the membrane resistance term can be neglected because it is either small to begin with or its influence diminishes rapidly as V increases. Thereby, αm is obtained from the slope of t/V2 during cake formation as:
2Δ ,
.
(7)
Derivation of Equation (5) assumes an average resistance over the cake and is an accurate description for incompressible materials. In reality, fine mineral or biological suspensions exhibit slight to highly compressible material behaviour [2,21,22,30,31]. For such suspensions, the question becomes how to represent changing properties within the cake.
2.2
Compressional Rheology
In the CP cell used in this work, Py(ϕ) is obtained at the end of the compression phases at set pressures. A permeation phase follows each compression phase. R(ϕ) is inversely related to the Darcian permeability [34]: 1
(8)
.
Therefore, R(ϕ) can be determined from the permeation rate through a packed bed via the following equation (assuming negligible membrane resistance): Δ
1
(9)
Single pressure filtration tests at a range of pressures are also performed to obtain R(ϕ) and Py(ϕ) [15,38] (although stepped pressure tests [27,39] can also be used). The compressive yield stress, Py(ϕ) is obtained by running pressure filtration runs until equilibrium is reached for a certain applied pressure and then determining the solids concentration of the filter cake. One method to obtain R(ϕ) from a filtration test is to use , which is the slope of t/V versus V or t versus V2 during the cake formation stage. By assuming that the solids velocity is negligible compared to the liquid velocity, Landman et al. [38] were able to demonstrate the following relationship between R(ϕ) and the pressure‐dependence of : 2
1
1
1
,
(10)
Δ where 0 is the initial solids concentration of the filtration run, is the final solids concentration at the end of the filtration run and Δp is the pressure difference. In this work, is fitted over a range of pressures with a power law function, = a∙pb and the derivative used in Equation (10).
2.3
Comparison of conventional filtration theory and compressional rheology
Parameters used in conventional filtration theory and compressional rheology can be used interchangeably as previously outlined by various authors [21,32,34,42–45] using the Darcian permeability to relate the specific filtration resistance by volume, αv and the hindered settling function, R():
1
(11)
,
1
Or on a mass basis with the true density of the solid phase ρs, 1
Therefore, when
or
1
,
(12)
are available the following relationships enable to obtain the hindered
settling function, R(ϕ), by restating Equation (11) and (12): 1
1
,
(13)
.
(14)
These equations show how fast a suspension is dewatering, however, as shown in the previous sections, the solids concentration significantly contributes to the filtration result. In conventional filtration theory, the porosity is related to the applied pressure; this description regards the filtration from a process point of view. In compressional rheology the material characteristics are in the centre of observation, meaning the obtained solids concentration is dependent on the applied pressure. Buscall and White [14] pointed out that the compressive yield stress can be equated with the solids network pressure ps, such that the two theories can be converted as: ↔
1
↔1
.
(15)
With this set of equations, material functions can be interchanged easily between the widely used conventional filtration theory of Tiller and Shirato [7] and the compressional rheology proposed by Buscall and White [14]. At this point, one has to consider that both theories have their advantages and a bulk of literature has been published. If both theories can be related to each other, naturally the question arises: what can each theory offer the other theory? When considering just filtration as a start, one could take advantage of the fitting parameter and combine Equations (10) and (12), which would allow to characterise materials based on the compressional rheology approach and obtain the commonly used filter cake resistance 2 Δ
1
as, 1
1
,
(16)
With the equations in this chapter the conventional filtration theory can be converted into the compressional rheology approach and vice versa. Concluding to the theory section a comparison between the two frameworks is shown in Table 1, which allows to get the Table 1: Comparison between conventional filtration theory and compressional rheology.
Conventional filtration theory
Compressional rheology
Description
Empirical
Phenomenological, derived from first principles
Process description
Application mostly averaged Local
description
solved
over process space. Local numerically description of process with numerical
techniques
are
available Solids concentration range Description applies for solids Entire solids concentration range concentrations above the gel is covered, limitation is in the point, sedimentation is not applied
Experimental methods
pressures
of
covered in this description
characterisation devices
Mostly just filtration tests
Batch
the
sedimentation,
centrifugation and filtration tests Analysis methods
Graphical, numerical and using Graphical, numerical and using fitting functions
fitting
functions.
capability experiments
to and
material properties
Further, repredict validate
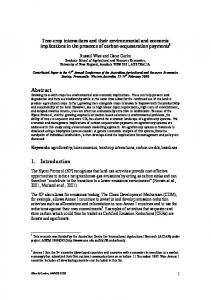
3 Materials and Methods Experimental data to compare the results obtained from both filtration frameworks was obtained by characterising a calcite suspension. The suspension was prepared from commercial calcium carbonate (Omyacarb 2, 10 and 40 supplied by Omya Australia Pty Ltd. and Omyacarb_ 2‐LU, 10 and 40, Omya California Inc.) and a 0.01 M potassium nitrate electrolyte solution out of Milli‐Q water (Millipore™ Synergy®, 0.22 μm filter) and KNO3 (chem‐supply, analytical reagent, min. 99% purity, Product Code: PA011). The suspensions were prepared at a solids volume fraction of = 0.3 v/v by adding the electrolyte solution under stirring to the calcite powder. Subsequently, the pH of the suspension was adjusted to its isoelectric point (IEP) of 8.2 to obtain a coagulated calcite suspension. For a more detailed description of the procedure one is referred to Usher [32]. The powders’ particle size distribution as dispersed in the electrolyte solution were measured using the Mastersizer 3000 (Malvern, UK) with the following particle size distributions as shown in Figure 1.
Figure 1: Particle size distributions of calcium carbonate of different particle sizes from Omya Australia Pty Ltd. called Omya 2, 10 and 40 with Sauter diameters of 2.5, 5.5, and 6.9 μm respectively.
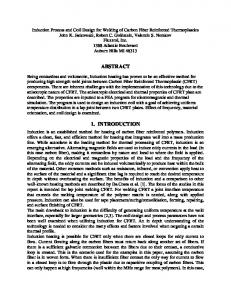
Filtration experiments were carried out on two different designs of filtration equipment. At the TU Bergakademie Freiberg a Compression‐Permeability‐Cell (CPC) [46] was used and at The University of Melbourne a piston‐driven dead‐end‐filtration cell [27] was used; both filtration devices are shown in Figure 2.
Figure 2: Schematics of the Compression‐Permeability‐Cell (CPC) (adapted from Wilkens 2013 [46]) and the dead‐end‐piston driven filtration rig (FR) (taken from de Kretser, et al 2001 [27]).
The experiments with the CPC were carried out as a stepped pressure run with one hour compression time at a given set pressure and then a ten minute permeation phase. The set compressive pressures were 50, 100, 200, 300, 500 and 1000 kPa and the fluid phase pressures during permeation were 60, 90, 180, 250, 400 and 600 kPa respectively. For the piston driven filtration rig single pressure runs were performed at pressures of 50, 100, 200, 300, 500, 1000 and 1500 kPa in cylinder pressure control. This means that, in contrast to the commonly used pressure transducer in the piston face to control the applied pressure, the cylinder pressure is used. This has the disadvantage that there is no direct feedback from the suspension about the pressure applied, losses due to friction between the piston and the filtration cylinder are accounted for with an offset value at the start of the experiment. This can lead to errors in the measurement between different filtration experiments; however, the pressure transducer in the piston face was not working reliably for this material. The sample solid volume fractions concentrations were determined by measuring the differential sample mass after the trials and after putting it in a 100 °C oven until equilibrium dry mass was reached.
4 Results and Discussion The permeation experiments from the Compression‐Permeability‐Cell (CPC) and the filter cake growth experiments from the Filtration Rig (FR) and the Filter Nutsche (FN) are compared using the equations given in the theory section. In order to analyse the filter cake growth the slope of the linear part in a t(V2) is obtained. This allows use of Equation (7) from the conventional theory to obtain
. For the compressional rheology an intermediate step is taken using and subsequently the fit of the pressure dependence of the permeability as the relation of d2/dΔp [38]. This yields to fittings as shown in Figure 3 for the three different Omyacarb particle systems.
Figure 3: Fit of 2 over applied pressure Δp for the different Omya particle size distributions for the filtration rig datasets, where the fit shows good agreement with the experimental data.
With the fits properly set up for the datasets one can use Equation (10) to determine the hindered settling function, R(). The same methodology can be applied to the conventional filtration theory by using Equation (16). In order to compare both filtration theories the hindered settling function is used as a basis for comparison. In order to achieve this, one has to convert the specific cake resistance, into R() using Equation (13) or (14) depending if is on volume or mass basis, respectively. In order to convert from R() to one would have to use Equations (11) or (12). This leads to Figure 4. For an easier translation between the two frameworks the solids volume fraction, is shown at the bottom and the porosity, is labelled at the top of the graph. Nonetheless the discussion of the results is going to be carried out exclusively for the solids volume fraction.
Figure 4: R() from the different filtration datasets from the Filtration Rig (FR), the Compression‐Permeability‐ Cell (CPC) and the Filter Nutsche (FN) for Omyacarb 2, showing the difference for filter cake growth (FR & FN) and the similarity for the permeation experiments (CPC) due to the formulation of the theories.
Looking at the data for the CPC it becomes apparent that the two theories deliver similar results, this is due to the fact that in permeation both theories make use of the Darcian permeability and can therefore be used to link the two theories. For this reason in the further discussion of results just the hindered settling data is going to be shown for the CPC without showing the converted values. When looking at the FR for the 500 kPa case one can see that there is almost half the value. The FN data is for the converted data shows a constant shift between the two theories. Further, however one can see that the data is of the same magnitude for all the equipment tested. Permeability is one key part of filtration characterisation, the second important parameter is the compressibility, which is the limit of the solids concentration which can be achieved with a certain pressure. In compressional rheology the compressibility described with the compressive yield stress, Py() and in the conventional framework it is generally looked at as the porosity, in dependence of the pressure (p). As outlined in the theory with Equation (15), both theories use a similar concept for the compressibility enabling to translate easily between the theories. For simplicity, only the compressive yield stress, Py() is shown from here on commencing with the data of Omyacarb 2 in Figure 5.
Figure 5: Compressive yield stress of Omyacarb 2 for the different filtration characterisation devices, i.e. the Compression‐Permeability‐Cell (CPC) and the Filtration Rig and the Filter Nutsche.
Comparing the results of the different dewatering devices for compressibility one can see that the FR and the CPC show a similar trend, whereas the FN is deviating. When looking at the data for Omya2 in the CPC and in the FR in fact deviate from each other where the CPC achieves a higher solids concentration by about two percentage points. In the lower solids concentration range the two measurement techniques line up with each other however above a pressure of 100 kPa the two devices start to deviate. This becomes apparent when comparing the last two points of the CPC and the FR. When considering the experimental procedures of both devices, one can notice that the CPC uses a fluid flow through the compacted filter cake to determine the permeability of a material. In the experiments carried out a fluid pressure of about 2/3 of the piston pressure was applied while the same compression pressure was maintained. This additional fluid pressure can result in an additional liquid drag onto the filter cake consolidating the filter cake further. In order to verify this, another trial with the CPC was carried out with just applying the consolidation pressure which is shown in Figure 5 indicating the same slope as the FR data. However, the data is not conclusive and a more in depth investigation has to be carried out. The Filter Nutsche data does not provide accurate compressibility data, which is shown in the big difference between the runs. This is especially the case at the highest pressure of 400 kPa, which is the one with the shortest filtration time and could be very inhomogeneous in its cake structure or partially desaturated due to the subjective termination of the experiment by observation. This
highlights that the Nutsche Filter can be employed for an order of magnitude estimate for slightly compressible materials, but cannot be used as a basis for equipment design, modelling or scale‐up. For highly compressible materials piston‐driven experiments have to be carried out to measure compressibility. In Figure 6 the hindered settling function, R() of the three tested calcium carbonate materials is presented.
Figure 6: Compressive yield stress for Omyacarb 2, 10, 40 for the Compression‐Permeability‐Cell (CPC), the Filtration Rig (FR) and the Filter Nutsche (FN) showing that most of the data aligns quite well between the different devices and that the permeability measurements compare quite well.
When looking at the hindered settling function one can see that the different characterisation techniques show similar values for the different materials. For the Omya 40 the R() is slightly lower compared to the other two devices where it slightly over predicted the measured permeability compared to the other devices. This can be attributed to the higher permeability of the Omya40 and for all the materials a similar amount of suspension has been used, which results in a shorter filtration time for a higher permeable material. Otherwise, the performance of the two devices are comparable and it is hard to distinguish with the present data which of the two is more prone to errors or which data is more reliable. For this, more tests would have needed to be carried out, which was not possible due to time constraints on the project. But it has been shown that the data can be converted between theories and that the Nutsche Filter can be used with caution to evaluate the liquid permeation of a
material. However, it should be kept in mind that this conclusion could be invalid for even more compressible materials. The permeability is dependent on the drag created between solid and liquid phase and the amount of pore volume available for the fluid to flow through, and thereby the local solids concentration. The local solids concentration could be in fact very different across the entirety of the cake, especially in industrial settings processes where equilibrium is not reached in most cases. The incompressibility assumption holds even less true for biomaterials which are highly compressible materials and form highly impermeable layers on top of a membrane [21,30]. This is a bottleneck which is well known in the biomaterials space, but mostly neglected in the minerals processing industry. The global trend of reducing ore grain size due to the lower ore grades however, will face the mining industry with a new challenge to be dealt with [47]. The experimental results of the different particle sizes in compression are shown in Figure 7.
Figure 7: Compressive yield stress for the different sized particle ranges of Omya 2, 10 and 40 for the different characterisation devices showing monotonically increasing compressive yield stress for filtration rig and the Compression‐Permeability Cell (CPC) and the deviating from those two the air‐driven Filter Nutsche.
The compressive yield stress, Py() as shown in the figure above is monotonically increasing over the entire solids volume range for the three different particle sizes investigated. Omya2 shows the biggest spread in solids concentration and therefore shows the highest compressibility of the used materials. This is understandable when considering that Omya2 has a smaller particle size as seen in
Figure 1 and is therefore more affected by colloidal interactions compared to the other two materials. This also indicates that even though materials might appear to be incompressible they might still show a certain degree of compressibility. In the case of the Omya10 and 40 we can see that the solids concentration increases about 5 v/v% and for Omya2 about 9 v/v% in the investigated pressure range from 50‐1500 kPa, which are pressures achieved in filter presses.
5 Conclusion In this paper it has been shown that the conventional filtration theory developed by Tiller, Shirato and Ruth and the compressional rheology framework developed by Buscall & White can be translated both ways. With those equations as a foundation, data from the different filtration devices was presented, demonstrating that the same permeability results for the investigated calcium carbonate suspension is obtained. When regarding the material compressibility, it can be seen that the Filter Nutsche does not reach equilibrium for applied pressures above the capillary entry pressure, as desaturation occurs and therefore consolidation halts. On the one hand, the Filter Nutsche can be taken as a magnitude estimate of filtration properties and on the other hand that the Compression‐Permeability‐Cell and the Filtration Rig yield similar results. Care has to be given for compressible materials in the Compression‐Permeability‐Cell, as the applied fluid pressure may lead to further consolidation of the filter cake. It is recommended to not use the Filter Nutsche for characterisation of compressible material properties.
Acknowledgement The authors would like to acknowledge the funding of the project through the Australia‐Germany Joint Research Co‐operation by the German Academic Exchange Service (DAAD) and Universities Australia. The University of Melbourne and the Particulate Fluids Processing Centre (PFPC) in Melbourne, Australia and the Institute for Mechanical Process Engineering and Mineral Processing, Freiberg (Saxony), Germany provided access to facilities and supply of equipment.
References [1] H. Darcy, Les Fontaines Publiques de la Ville de Dijon: Exposition et application des principes à suivre et des formules à employer dans les questions de distribution d'eau, Dalamont, Paris (1856). [2] H.P. Grace, Resistance and Compressibility of Filter Cakes, Chem. Eng. Prog. 49 (1953) 303–318. [3] F.M. Tiller, C.S. Yeh, C.D. Tsai, W. Chen, Generalised Approach to Thickening, Filtration and Centrifugation, Filt. Sep. (1987) 121–126.
[4] F.M. Tiller, W.‐F. Leu, Basic Data Fitting in Filtration, J. Chinese Inst. Chem. Eng. (1980) 61–70. [5] F.M. Tiller, The Role of Porosity in Filtration: Numerical Methods for Constant Rate and Constant Pressure Filtration Based on Kozeny's Law, Chem. Eng. Progr. (1953) 467–479. [6] F.M. Tiller, J.H. Kwon, Role of porosity in filtration: XIII. Behavior of highly compactible cakes, AIChE J. 44 (1998) 2159–2167. [7] M.J. Matteson, C. Orr, Filtration: Principles and practices, 2nd ed., Chemical industries 27, M. Dekker, New York, 1987. [8] M. Shirato, M. Sambuichi, H. Kato, T. Aragaki, Internal flow mechanism in filter cakes, AIChE J. 15 (1969) 405–409. [9] M. Shirato, T. Aragaki, R. Mori, K. Sawamoto, Predictions of Constant Pressure and Constant Rate filtrations based upon an approximate correction for side wall friction in compression permeability cell, J. Chem. Eng. Japan 1 (1968) 86–90. [10] M. Shirato, T. Aragaki, R. Mori, K. Imai, Study on Variable Pressure‐Variable Rate Filtration, Kagaku Kogaku 33 (1969) 576–581. [11] F.M. Tiller, The role of porosity in filtration part 3: Variable‐pressure—variable‐rate filtration, AIChE J. 4 (1958) 170–174. [12] P. Garrido, R. Bürger, F. Concha, Settling velocities of particulate systems, Int. J. Miner. Proc. 60 (2000) 213–227. [13] G.J. Kynch, A theory of sedimentation, Trans. Faraday Soc. 48 (1952) 166. [14] R. Buscall, L.R. White, The consolidation of concentrated suspensions. Part 1.—The theory of sedimentation, J. Chem. Soc., Faraday Trans. 1 83 (1987) 873. [15] K.A. Landman, L.R. White, Solid/liquid separation of flocculated suspensions, Adv. Colloid Interface Sci. 51 (1994) 175–246. [16] K.A. Landman, L.R. White, Predicting filtration time and maximizing throughput in a pressure filter, AIChE J. 43 (1997) 3147–3160. [17] A.D. Stickland, R.G. de Kretser, P.J. Scales, S.P. Usher, P. Hillis, M.R. Tillotson, Numerical modelling of fixed‐cavity plate‐and‐frame filtration: Formulation, validation and optimisation, Chem. Eng. Sci. 61 (2006) 3818–3829. [18] A.D. Stickland, A compressional rheology model of fluctuating feed concentration during filtration of compressible suspensions, Chem. Eng. Sci. 75 (2012) 209–219. [19] A.D. Stickland, R.G. de Kretser, P.J. Scales, Nontraditional constant pressure filtration behavior, AIChE J. 51 (2005) 2481–2488. [20] A.D. Stickland, R.G. de Kretser, P.J. Scales, One‐dimensional model of vacuum filtration of compressible flocculated suspensions, AIChE J. 56 (2010) 2622–2631. [21] A.D. Stickland, Compressional rheology: A tool for understanding compressibility effects in sludge dewatering, Water Res. 82 (2015) 37–46. [22] D.R. Hewitt, D.T. Paterson, N.J. Balmforth, D.M. Martinez, Dewatering of fibre suspensions by pressure filtration, Phys Fluids (2016) 063304_1‐23. [23] B.F. Ruth, G.H. Montillon, R.E. Montanna, Studies in Filtration, Ind. Eng. Chem. 25 (1933) 153–161. [24] B.F. Ruth, Correlating Filtration Theory with Industrial Practice, Ind. Eng. Chem. 38 (1946) 564–571. [25] L.A. Brown, C.F. Zukoski, L.R. White, Consolidation during drying of aggregated suspensions, AIChE J. 48 (2002) 492–502. [26] M.D. Green, Characterisation of Suspensions in Settling and Compression, PhD Thesis, The University of Melbourne, Melbourne, Australia, 1997. [27] R.G. de Kretser, S.P. Usher, P.J. Scales, D.V. Boger, K.A. Landman, Rapid filtration measurement of dewatering design and optimization parameters, AIChE J. 47 (2001) 1758– 1769. [28] R.J. Wakeman, E.S. Tarleton, Filtration: Equipment selection, modelling and process simulation, 1. ed., Elsevier Advanced Technology, Oxford, 1999.
[29] L. Svarovsky, Solid‐liquid separation, 2. ed., Butterworths, London, 1981. [30] S.J. Skinner, A.D. Stickland, P.J. Scales, Predicting Transmembrane Pressure Rise from Biofouling Layer Compressibility and Permeability, Chem. Eng. Technol. (2017) (in press). [31] F.M. Tiller, T. Cleveland, R. Lu, Pumping Slurries Forming Highly Compactible Cakes, Ind. Eng. Chem. Res. 38 (1999) 590–595. [32] S.P. Usher, Suspension dewatering: characterisation and optimisation, PhD thesis, The University of Melbourne, Melbourne, Australia, 2002. [33] F.M. Tiller, Z. Khatib, The theory of sediment volumes of compressible, particulate structures, J. Colloid Interface Sci. 100 (1984) 55–67. [34] R.G. de Kretser, D.V. Boger, P.J. Scales, Compressive Rheology: an Overview, Rheology Reviews (2003) 125–166. [35] D.R. Lester, S.P. Usher, P.J. Scales, Estimation of the hindered settling function R(ϕ) from batch‐settling tests, AIChE J. 51 (2005) 1158–1168. [36] S.P. Usher, P.J. Scales, L.R. White, Prediction of transient bed height in batch sedimentation at large times, AIChE J. 52 (2006) 986–993. [37] S.P. Usher, L.J. Studer, R.C. Wall, P.J. Scales, Characterisation of dewaterability from equilibrium and transient centrifugation test data, Chem. Eng. Sci. 93 (2013) 277–291. [38] K.A. Landman, J.M. Stankovich, L.R. White, Measurement of the filtration diffusivity D(ϕ) of a flocculated suspension, AIChE J. 45 (1999) 1875–1882. [39] S.P. Usher, R.G. de Kretser, P.J. Scales, Validation of a new filtration technique for dewaterability characterization, AIChE J. 47 (2001) 1561–1570. [40] C. Alles, Prozeßstrategien für die Filtration mit kompressiblen Kuchen, PhD thesis, Universitaet Fridericiana zu Karlsruhe, Karlsruhe, 2000. [41] K.A. Landman, L.R. White, M. Eberl, Pressure filtration of flocculated suspensions, AIChE J. 41 (1995) 1687–1700. [42] R.G. de Kretser, S. Usher, P.J. Scales, Comprehensive Dewatering Behaviour Analysis for Fine and Flocculated Materials, Proceedings of American Filtration and Separations Society, 18th Annual Conference (2005). [43] A.D. Stickland, P.J. Scales, J.R. Styles, Comparison of geotechnical engineering consolidation and physical science filtration testing techniques for soils and suspensions, Geotech. Testing J. (2005) 596–604. [44] R. de Kretser, Linking Dewatering Parameters from Traditional, Fluid Mechanical and Geotechnical Theories, Filtration 7 (2007) 60. [45] J. Olivier, J. Vaxelaire, E. Vorobiev, Modelling of Cake Filtration: An Overview, Separation Science and Technology 42 (2007) 1667–1700. [46] Marcus Wilkens, Flushing ‐ Entfernen von organischen Lösungsmitteln aus Haufwerken und Filterkuchen, Dissertation, TU Bergakademie Freiberg, Freiberg, Sachsen, 2013. [47] R. Batterham, Trends in comminution driven by energy, Adv. Powder Tech. 22 (2011) 138– 140.