channel vocoder. Informal. * Currently with the Department of Acoustic Research, AT&T Bell. Laboratories, Murray Hill, NJ. listening to utterances of several male ...
SPEECH ANALYSIS/SYNTHESIS BASED ON MATCHING THE SYNTHESIZED AND THE ORIGINAL REPRESENTATIONS IN THE AUDITORY NERVELEVEL ODED GHITZA* Research Laboratory of Electronics Massachusetts Institute of Technology Cambridge, MA 02139
ABSTRACT Traditional speech analysishynthesis techniques are designed to produce synthesized speech with a spectrum (orwaveform) which is as close as possible to the original. It is suggested, instead, to match the in-synchrony-bands spectrum measures (Ghitza,ICASSP-85, Tampa FL., Vol. 2, p. 505) of the synthetic and the original speech. This concept has beenused in conjunction with a sinusoidal representation type of speech analysishynthesis (McAulay and Quatieri, Lincoln Laboratory Technical Report 693, May 1985). Based on informal listening, the resulting speech is natural (with some tonal artifact) and highly intelligible both in quiet and noisy environments. The same performance is obtained with two overlapping superposed speech waveforms, music waveforms, and speech in musical background. These results demonstrate the adequacy of the in-synchrony-bands measure in selecting the perceptually meaningful frequency regions of the stimulus spectra. Moreover, the inherent dominance property of this measure significantly reduces the number of sinusoidal components needed for synthesis by approximately 70 percent, offering the potential for reduced data-rate.
INTRODUCTION Traditional speech analysishynthesis systems are designed to produce synthesized speech with properties similar tothe original. Waveform-coders attemptsto produce the original waveform. Vocoder schemes are considered to perform wellif they reproduce the short term power spectrum. The deviation from the original depends on the quantization used to achieved a desired data rate. This report suggests a new speech analysis technique which exploits the limitations imposed by the human peripheral auditory mechanism on speech transduction. It is proposed that speech be synthesized by matching the outputs of the synthesized and the original speech representations atthe auditory nerve level, that is atthe output of the auditory periphery. In an earlier paper (Ghitza, 1985, [71) a relative spectral intensity measure was suggested motivated by the insynchrony characteristics of the timing information inthe auditory nerve firing patterns. We termed thismeasure “the in-synchrony-bands spectrum,” SBS in brief. A spectral envelope function was created using the SBS estimates directly, to replace the spectrumpathina channel vocoder. Informal
*
Currently with the Department of Acoustic Research, AT&T Bell Laboratories, Murray Hill, NJ.
listening to utterances of several male and femaletalkers suggested that considerable speech information was preserved even though the resulting synthesized speech was of relatively poor quality. The present study was motivated by the assumption that the poor quality is due tothe poor SBS match of the vocodcd speech with the original. In order to improve the SBS match, we studied the SBS analyzer using the sinusoidal representation analysis/synthesis system suggested by McAulay and Quatieri, 1985, [lo],ratherthan a vocoder. Inthe analysis, only the frequency estimates of the SBS (which exhibits the dominance property of the auditory periphery) are used to select the necessary frequency components needed for the sinusoidal representation synthesis. The resulting synthesized speech has an SBS representation identical to the original. Furthermore, the synthesized speech is natural (with some tonal artifact) and highly intelligible for various kinds of acoustical stimuli, both in quiet and noisy environments. These results demonstrate the adequacy of the in-synchrony-bands measure in pointing out the perceptually meaningful frequency regions of the stimulus spectra. The results may also suggest that for analysishynthesis purposes, theSBS profiles are a sufficient display of speech as represented in the auditory nerve level. The first two sections describe the sinusoidal speech representation andthe in-synchrony-bands spectrum analysis. In the next two sections, the integration of the SBS measure into the sinusoidal representation system is described and the resulting performance of the overall system, termed “the synchrony based dominance system,” is demonstrated.
THE SINUSOIDAL REPRESENTATION SYSTEM In our experiments, we used the simplifiedversion of the sinusoidal representation analysishynthesis system suggested by McAulayandQuatieri, 1985, [lo], termed by the authors as the “overlap and add system” ([lo], p. 37). In this simplified version, the speech waveformismodeled asthe sum of sine waves; the sine wave parameters are kept constant over the frame. If si (n) represents the speech waveform samples in the i’th frame, then
where Aki and f k i are the amplitude and frequency of the k’th component in the i’th frame and Bki is the phase of the k’th frequency component referenced to the center of the i’th frame. In order to determine those parameters,a 512-point FFT is computed every frame and a set of sine wave frequencies is generated by applying simple peak picking to the interpolated magnitude function. The amplitudes and the phases are measured from the interpolated FFT atthe location of the
37.1 1. 1 ICASSP 86, TOKYO
CH2243-4/86/0000-1995
$1.00
0 1986 IEEE
1995
peaks. In the synthesizer, the summation (1) is used to produce theframe output signal on which atriangular window is applied. Since the analysis is performed every 10 milliseconds on a 20 milliseconds window, the current and the preceding 20 milliseconds time-weighted frame output signals are overlapped by 10 milliseconds delay and added, to obtain the output synthesized speech. There is no voicing decision and the same procedures are applied for the voiced and the unvoiced frames. In this section we described the basic system we used for the auditory-based modifications suggested in the following sections. As we shall see later, it has a structure which is very conveniently controlled by the SBS profiles.
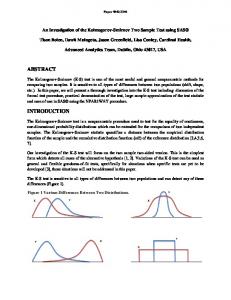
Implementation Because of implementation constraints, the design of the first stage (Fig. 1-a) is based on the general overall behavior of the peripheral auditory system. Fine details of the cochlear filters were ignored. The first stage consists of a 100 channel filterbank, where the filters are highly overlapped and equally spaced in the logarithmic scale with a 3% frequency step. Their frequency responses are similar to the tuning curves of the auditory nerve fibers. Each filter is identified by its I
SBSMEASUREMENT:
I
THE IN-SYNCHRONY-BANDS SPECTRUM (SBS)
I
I DOMINANT 1
11.
Motivation
2.
All the information that isprocessed by the higher auditory system stages must exist in the auditory nerve firing patterns, since the auditory nerve is the only link from the auditory periphery to the brain. For speech analysis purposes it is thus sufficient to retain only properties of the speech signal which determine the auditory nerve firing patterns, Measurements of the firing responses of auditory nerve fibers to speech-like stimuli (Sachs and Young, 1979, I l l ] ; Young and Sachs, 1979, [121; Delgutte and Kiang, 1984, [21-[61) suggest that firing rate is an insufficient carrier of speech information. Some use of temporal characteristics of the firing patterns seems necessary. It is also evident from these measurements that as the stimulus intensity increases, more fibers fire in synchrony with the stimulus periodicity. It is thus possible to consider the width of the region in which all the fibers firein synchrony with the stimulus periodicity as a measure of the stimulus intensity. Based on these observations, a speech analyzer is suggested. First, the aspects concerning the design of a theoretical speech analyzer are considered; the actual implementation willbe presented in part B of this section. The ideal speech analyzer comprises oftwo stages. The first stage models the peripheral auditory processing structure up to the level of the auditory nerve. The second stage is an heuristic non-linear relative spectrum intensity measure, operates on the output of the first stage and playing the role of the higher levelprocessing. This measure uses timing-synchrony information in an attempt to exploit the in-synchrony phenomena observedin the neuron firing patterns. Its estimation principles are based on conclusions, yet to be psychophysically verified, derived from the gross characteristics of the cat’s auditory nerve firing patterns. Specifically, we adopt the temporal non-place approach suggested by Carlson etal, 1975, [11. It is assumed that information about the relative intensity of different spectral portions of the signal is in the number of fiberswhich fire synchronously, regardless of the fiber’s characteristic frequency. Furthermore, the phase response of the fibers are assumed to be irrelevant. The basis for this assumption is the findings of Goldstein and Srulovicz, 1977, [SI, that the interspike interval statistic is adequate to explain the psychophysics of the perception of the pitch of complextones. The in-synchrony idea was also applied to unvoiced speech with its energy located atthe high portion of thespectral band (up to 4-5 kHz). Although synchrony drops as fiber cf increases (Johnson, 1980, [91), it is assumed that the amount of synchrony in these fibers is still useful.
1
0
;
I
SEARCH FOR IN-SYNCHRONYBANDS
--L
SBS
COUNTNUMBERS OF FIBERS I N EACH IN-SYNCHRONY BAND
4
A
-m
9
f -
Figure 1 characteristic frequency, cf. The filters with cf up to 1000 Hz have a frequency response with log symmetry around cf, with an f18 dB per octave incline in their low frequency end and a -18 dB per octave roll-off in their high frequency end. The filters with cf above 1000 Hz have a 4-18 dB per octave incline in their low frequency end but a very sharp roll-off at the high frequency end (Fig. 1-b). In the following text we sometimes refer to such a filter as a “fiber”. The second stage of the proposed speech analyzer isbased on the assumptions made in Part A of this section. These assumptions lead to the following definitions: Definition 1: An in-synchrony-band is a region of L, successive filters having the same dominant frequency f,, where the “dominant frequency” is the frequency of the strongest component in the filter’s output signal. For a region to be declared asan in-synchrony band, it is necessary that L, be greater or equal to a threshold, M . Definition 2: The in-synchrony-bandsspectrum (SBS) is a discrete function in frequency, consisting of a set of lines located at frequencies f, with magnitudes L,, where f, and L, are as in Definition 1 .
Time domain implementation of a continuous SBS measurement is clearly computationally complex. Taking into consideration that speech signal characteristics remain steady over approximately 20 milliseconds and can be tracked adequately in a 100 frames per second analysis, we implemented aframe oriented SBS analyzer. The analyzer
1996
37.11. 2 1996
ICASSP 86, TOKYO
operates in the frequency domain andthe extraction of the dominant frequency is by picking the frequency of the largest frequency component in the fiber's output power spectrum. The auditory nerve fibers are specified with a simple description in the dB-log frequency scale. In this domain, the fiber filtering can be easily performed by summing the input log spectrum with the log frequency response of the fiber.
we are using a modified SBS measure inwhich the intensity information of each SBS line is replaced by theamplitude of the original speech frequency component atthat frequency, computed by a high resolution FFT. The implementation of the proposed synchrony based dominance analysis/synthesis system is straightforward (Fig. 3). The SBS analyzer is integrated into the analysis side ANALVSIS.
'1,
,r,
,
,
fB/
,
Y)
I
2
FREOUENCV IkH4
1
'
lbl
,1
,
,
,
",
1
FREOUENCV IkHzI SYNTHESIS:
Figure 2 PHASES
Figure 2-b shows theSBS lines for a sample high resolution speech power spectra(the analysis conditions are described in the Results Section) plotted in Fig. 2-a. The left side plots are samples of male speech while the right side show samples of female speech. Both power spectra are shown after a 6 dB per octave preemphasis. The figures demonstratethe dominance effect which is a basic property of the SBS measure. Stronger frequency components dominate the activity of fibers with higher cf. The magnitude of the SBS lines (obtained by using a highly non-linear operation namely counting the number of in-synchrony fibers) represents the relative importance of each activity region. Figure 2 also shows anothercharacteristic of the SBS. Because of the fiber distribution along the Basilar membrane, most of the frequency components in the first formant region are usually represeqted in the SBS display. This contributes to the pitch estimation performance of the central processor. The otherformants are represented with many fewer SBS lines.
1
Figure 3 of the sinusoidal representation analysishynthesis system, to indicate which of the speech frequency components should be transmitted. The transmittedparameters aretheSBS line frequencies and the original amplitudes and phases at those frequencies, computed from the speech input spectrum(as in the full sinusoidal representation system). In the synthesizer, only those frequency components are included in the summation of equation (1). The SBS display of the original andthe synthesized speech should be identical since the unnecessary frequency components in the original are replaced by zero amplitude frequency components and their is no change in the
THE SYNCHRONY BASED DOMINANCE SYSTEM The ability of the SBS measure to serve as an adequate speech description was examined in an earlier study, using listening criteria (Ghitza, 1985, [71). In that study, the SBS line magnitudes were directly used tocreate a parallel formant spectral envelope function, where the formant frequencies and their amplitudes were f, and L,, respectively. Thisspectral envelopewas used to replace the spectrum path in a channel vocoder. The resulting synthesized speech was of relatively poor quality. The SBS match of the synthesized speech with the original was inadequate, too.However, informal listening to various male and female utterances suggested that considerable speech information was preserved. Showing thatSBS information alone issufficient should be either by suggesting another transformation of the SBS or by running a synthesis by analysis system that will matchthe synthesized speech SBS representation tothe original. The appropriate transformation of the SBS is not yet been found nor an appropriate control law for the synthesis by analysis system. However, an approximation can be made to modify the SBS by taking into account an additional, non SBS, information. It is thus proposed that only the SBS dominance property will be used, to select the meaningful frequency regions in the stimulus spectra. From these regions a complimentary information on the intensity and the phase are to be extracted. Consequently,
FREOUENCY (kHz1
IREaUUENCV (kHz1
Figure 4 dominance relations. Figure 4-12 shows the SBS displays of the original speech spectra (Fig. 4-a) andthe synthesized speech spectra (Fig. 4-b) as well. Thespectra in Fig. 4-a are the dB versions of the same speech power spectra of Fig. 2-a.
RESULTS The synchrony based dominance system was applied to a database comprises of a variety of male and female single speaker utterances, two overlapping superposed speech
37.11. 3 ICASSP 86, TOKYO
1997
waveforms, music waveforms and speech in musical background. The speech was low-pass filtered at 5 kHz, preemphasized by a 6 dB per octave preemphasis analog network, digitized at 10 kHz and analyzed at 100 frames per seconds. The analysis was performed using a Hamming window weighted, 20 millisecond frame. The synthesized speech is natural and highly intelligible, but include some tonal artifact. Its SBS display is identical to the original. The distortion is noticeable especially inverylow pitched male utterances, where about 80 percent of the frequency components are removed.Two observations have been made. First, compared to the full sinusoidal representation, the average number of the necessary frequency components is about 40 percent for unvoiced frames and about 30 percent for voiced frames. This is due to the fact that in the unvoiced case there are no clear dominance regions since the spectralstructure is inharmonic. Secondly, there is about 10 percent more saving for a male talker compared to a female talker. This is due to the lower male pitch which causes a larger density of spectral frequency components to be removed. These results hold for all kinds of input stimuli, including the two overlapping speech waveforms and speech in musical background. The performance of the system is not seriously affected by the presence of noise, even as high as a 0 dB peak vowel to average noise ratio. In fact,there may be some noise reduction based on the dominance effect. Obviously, each frequency component in the speech frame spectrum is filtered by the narrow band 512-point FFT filter and the high energy frequency components are measured with abetter accuracy. Since the low energy frequency components are dropped by the dominance effect and the synthesizer uses only the high energy frequency components, the overall signal to noise ratio may be improved.
CONCLUSIONS Motivated by the in-synchrony characteristics of the timing information inthe auditory nerve firing patterns, we used the in-synchrony-bands (SBS) measure to define the perceptually meaningful frequency regions of the stimulus spectra. It seems that for analysis/synthesis purposes, theSBS profiles are a sufficient display of speech asit represented inthe auditory nerve level. For all kinds of acoustical stimuli in our database, including single male and female speakers in clear and in noise, two overlapped speech waveforms, music waveforms and speech in musical background, the veryfew frequency components indicated by the SBS lines are sufficient for anadequate representation of all the speech features. More than half of the SBS lines used are in the region of the first formant, representing the intonation (pitch) information. The other formants are represented with many fewer lines. The SBS representation of voiceless sounds, however, seems to be incomplete, since it introduces tonal artifact to the synthesized speech. Ten frequency components, at most, are sufficient to obtain natural (with some tonal artifact) and highly intelligible synthesized speech. This suggests a potential for an efficient speech coding system based on this technique.
ACKNOWLEDGEMENT
I wish to thank B. Gold, R. J. McAulay, W. M. Rabinowitz, J. Tierney and T. F. Quatieri for stimulating discussions throughout this work. REFERENCES 111
Carlson, R., Fant, G. and Granstrom, B. (1975). “Two formant models, pitch and vowel perception,” in: Fant, G. and Tatham, M. A. A. (Eds.), “Auditory analysis and perception of speech,” Academic Press, London, pp. 55-82.
12-61 Delgutte, B. andKiang, N. Y. S . (1984).“Speechcodingin auditory nerve: I., III., IV., V.,” J. Acoust. SOC.Am.75 (3). March, pp. 866-918. 171
Ghitza, 0.(1985). “A measure of in-synchronyregionsin theauditorynervefiring patterns as a basisforspeech vocoding,” ICASSP-85, Tampa, Florida, Vol. 2, March, p. 505.
[SI
Goldstein, J. L.andSrulovicz,P. (1977).“Auditory-nerve spikeintervals as an adequate basis for auralspectrum E. F. and Wilson, J. P. (Editors) analysis,” In Evans, of Hearing.Academic-press, PsychophysicsandPhysiology London, p. 337.
t91
Johnson,D.H. (1980). “The relationship betweenspike rate andsynchronyinresponses of auditory-nerve fibers to single tones,” J. Acous. Soc. Am., 68 (41, Oct., p. 1115.
[ 101
McAulay, R. J. and Quatieri, T. F. (1985). “Speech representation,” analydsynthesis based on a sinusoidal Lincoln Laboratory Technical Report 693, May.
t111
Sachs, M. B. andYoung, E. D. (1979). “Encoding of steady state vowelsin the auditory nerve: representation in terms of discharge rate,” J. Acous. SOC.Am., 66(2), Aug., p. 470.
[121
Young, E. D.andSachs, M. B. (1979).“Representation of steady state vowelsin the temporal aspects of the discharge patterns of populations of auditory.nervefibers,” J. Acous. SOC.Am., 66 ( 9 , Nov., p. 1381.
FREQUENCY lkHzl
Figure 5 Figure 5 shows the original and the synthesized power spectra and their SBS (Fig. 5-a, 5-b-and 5-12, respectively) for a female speech frame in quiet (left plots) and noisy (with a 3 dB peak vowel to average noise ratio) environments. Note that the SBS display is hardly affected by the noise. In order to get acrudeestimate of the upper bound for the number of lines needed per frame, the maximum number of sine wave components to be superposed by the synthesizer was set to 10. Thus, in each frame, the ten SBS components with the largest FFT amplitudes were taken into account. The resulting synthesized speech was perceptually indistinguishable from the unconstrained synchrony based dominance synthesized speech. This result holds for all the stimuli in the database that we described, both in clear and noisy environments.
37.1 1. 4 1998
ICASSP 86, TOKYO