PEER- REVIEWED ARTICLE
DOI: 10.14714/CP88.1391
Accessible Web Maps for Visually Impaired Users: Recommendations and Example Solutions Sabine Hennig Paris Lodron University of Salzburg
[email protected]
Fritz Zobl Paris Lodron University of Salzburg
[email protected]
Wolfgang W. Wasserburger AccessibleMap Association/TU Wien
[email protected]
Due to advances in information and communication technology, web maps are an increasingly important means of communication. While paper maps provide solutions that are accessible to the visually impaired, the use of web maps is still difficult for these users. This is true even though technology opens up new possibilities for developing accessible web maps. But, what must be considered when creating web maps suitable for the visually impaired? This paper presents recommendations including example solutions based on the results obtained in two projects: AccessibleMap and senTour. In both projects mixed methods were used: literature and internet review, questionnaires, and analysis of similar systems. All work was done in close cooperation with organizations that represent the interests of the target group. The findings underline that web maps accessible to visually impaired users must support different interaction modes and assistive technology. A carefully designed user interface, an easy-to-read map picture, and the provision of a verbal description of the map content are important. Further, additional aspects should be considered to enable these users to fully benefit from web maps. This refers to the need to widen the concept of accessibility, encompassing among others usability, the importance of building up these users’ digital and spatial competencies, and to leverage the advantages that result from the application of the participatory design approach. accessible maps; accessibility; usability; web maps; visually impaired users; disabled users; special needs users; digital and spatial literacy; participation KEYWORDS:
INTRODUCTION AND RESEARCH QUESTIONS Foote and Crum (1995) suggest that maps are perhaps
as fundamental to society as language and the written word. They help people to orient themselves in physical space, to navigate from place to place, to plan routes, to acquire spatial knowledge, and to build up cognitive or mental maps (Helal et al. 2004; Montello and Freundschuh 2005). For persons who are blind, or who are severely visually impaired, maps are even more important. Without a visual sense, they can easily lose their orientation, particularly when traveling in unknown environments (ClarkCarter et al. 1986; Helal et al. 2004). Maps enable them to construct a cognitive map of as yet unknown areas, which they can later recall from memory while on-site, supporting them in independently finding their way (Brock et al. 2013; Golledge et al. 1996).
Web maps, like many other technologies, have the potential to enhance the quality of life and independence of disabled people (Harris 2010; WHO 2007). Nevertheless, technology does not automatically bring them benefits merely by existing (Macdonald and Clayton 2013): solutions must be implemented with an understanding of a user group’s requirements. However, while web maps have the potential to benefit persons who are visually impaired, current examples rarely meet the requirements of this user group. Depending on the type and degree of a user’s visual impairment, web maps can be quite challenging; in the case of people who are severely visually impaired or blind, their use is often hardly possible at all (Call-Jimenz and Lujan-Mora 2016; Höckner et al. 2012; Zeng and Weber 2011). Barriers that generally hinder these users from using
© by the author(s). This work is licensed under the Creative Commons Attribution-NonCommercial-NoDerivatives 4.0 International License. To view a copy of this license, visit http://creativecommons.org/licenses/by-nc-nd/4.0/.
Cartographic Perspectives, FORTHCOMING
Accessible Web Maps for Visually Impaired Users – Hennig et al. | 5
web maps have been discussed by other authors (see, for example, Calle-Jimenez and Lujan-Mora 2016; Höckner et al. 2012): they may be too complex to use, feature inappropriate graphical design of the user interface and/or the map, suffer from a lack of appropriate interaction modes, or lack a verbal description of the map content. To support the creation of web maps that are accessible to visually impaired users, several open questions need to be answered: What guidelines exist to support their
development? Which applications already exist that can serve as examples to guide the design and implementation of accessible web maps? What recommendations can be offered to support the development of web maps accessible to visually impaired users? Which additional approaches, beyond a consideration of accessibility, can support the creation and use of such web maps? The findings we discuss in this paper are based on knowledge gained from two projects: AccessibleMap and senTour.
BACKG RO U N D TARG ET G RO U P
The term “visual impairment” covers a wide range
of different types and degrees of eye disorders and vision loss. As described by the International Council of Ophthalmology (2002), this encompasses minimal impairments; mild, moderate, severe, and profound vision loss; near-blindness and blindness; as well as color vision loss (Table 1). According to the World Health Organization (2013), in 2011 the number of people with reduced vision and blindness amounted to approximately 285 million worldwide, with 246 million suffering from low vision and 39 million affected by blindness. The reasons for visual Ranges of vision loss
(Near-) Normal Vision
Range of normal vision
(Near-) blindness
Normal
Minimal impairment Mild vision loss
Low vision (partially sighted)
Ability, ranges
Almost normal
impairment are manifold: examples include uncorrected refractive errors, cataracts, glaucoma, diabetic retinopathy, trachoma, corneal opacities, and age-related macular degeneration (Pascolini and Mariotti 2012). Due to increasing life expectancies, the number of older persons is on the rise in many parts of the world. The over65 population proportion is expected to more than double globally over the next forty years, climbing from 7% to 16% (to nearly 1.5 billion people). As the older population increases, so will the number of people affected by visual Reading ability Normal reading speed Normal reading distance Reserve capacity for small print Normal reading speed Reduced reading distance No reserve for small print Near-normal Appropriate reading aids: strong reading glasses, large print books, readers, audio taped texts, and raised-line drawings
Moderate vision loss
Normal with aids
Severe vision loss
Restricted with aids
Slower than normal Require reading aids High power magnifiers
Profound vision loss
Marginal with aids
Visual reading is limited Magnifiers for spot reading, talking books
Near-blindness (legal blindness) Total blindness
(Near-) impossible
No visual reading: talking books, Braille or other non-visual sources
Table 1. Types and degrees of visual impairment (CUDE 2015; ICO 2002; WHO 2013).
Cartographic Perspectives, FORTHCOMING
Accessible Web Maps for Visually Impaired Users – Hennig et al. | 6
impairment—age is a significant factor in the decline of vision capacity. This is emphasized by the following numbers: while approximately 20% of the world’s population is age 50 and older, about 65% of all visually impaired people worldwide belong to this age group (Pascolini and Mariotti 2012; WHO 2013). Another significant population that must be considered are those persons with color vision impairments. This term refers to an inability to distinguish certain color shades, or, in more severe cases, to see colors at all (AOA 2014). While many different forms of color vision impairments exist, the most common are: (1) protanopia (reduced sensitivity to red light), (2) deuteranopia (reduced sensitivity to green light), and (3) tritanoptia (blue-yellow color blindness). This trait is mainly carried by a sex-linked genetic disorder (though it can also be caused by injury, disease, or medication side effects); approximately 8% of the total male population and 1% of the total female population suffer from color vision deficiency (AOA 2014; Culp 2012; Olson and Brewer 1997). Since mapmakers often use colors to represent different categories of map features and to facilitate visual grouping, users suffering color visual impairment can find reading maps challenging—especially if maps are produced with little or no consideration for them (Olson and Brewer 1997). RELATED WO RK Accessibility-oriented products aim to improve the extent to which everyone in a society is able to live independently and self-determinedly, and to participate fully in all aspects of life (ITU/G3ict 2014b). This is done through a focus on ensuring an equivalent user experience for people with disabilities (W3C 2010). As the internet becomes more and more a part of daily life for many people, numerous initiatives on web accessibility have emerged in recent years. Their focus is on the removal of technical barriers
that hamper access to information, with the aim that all people can perceive, understand, and operate every control, instruction, or output related to a website (ITU/G3ict 2014b; W3C 2005; W3C 2012). Like other accessible products, maps tailored to the needs of visually impaired people are not new. High contrast maps, large font maps, tactile maps, and Braille maps are well-established analog products. Technological advances—especially since the mid-1990s—have also facilitated the development of a variety of digital maps supporting visually impaired users. Examples include • virtual acoustic maps representing information about features such as lakes, parks, and streets as verbal and non-verbal audio output (Heuten et al. 2007; Zhao et al. 2005); • virtual tactile maps, in which tactile displays and other haptic devices (such as a joystick or haptic mouse) are used to explore maps (Moustakas et al. 2007; Parente and Bishop 2003); • tactile-audio maps, in which users explore maps with their fingers using touch-sensitive pads and obtain more detailed information from auditory representations (Wang et al. 2009); and • Braille tactile maps, which use tactile and touch-enabled Braille displays to present map information (e.g., points of interest) as well as interaction functions (pan, zoom, search, etc.) through raised pins (Zeng and Weber 2010). As they have become more popular in recent years (and featured greater capabilities), a number of researchers have also worked to develop interactive web maps tailored to visually impaired users (see, for example, Brock and Jouffrais 2015; Helal et al. 2004; Poppinga et al. 2011; Rener 2017; Sánchez and Torre 2010; Siekierska and McCurdy 2008).
PROJ EC TS A N D M E T H O DS The recommendations we present in this paper
rely on work conducted in two projects: AccessibleMap and senTour. Both projects aimed at implementing a web map pilot suitable for the disabled, and especially for people who are visually impaired (Table 2). A good understanding of the user groups and their needs played a key role in both projects, and thus was a focus
Cartographic Perspectives, FORTHCOMING
of much of our effort. The workflow and methods used to gain this knowledge about visually impaired users were quite similar for each project (Figure 1), and included literature reviews, questionnaires, internet research, and analysis of similar systems (AoSS). Throughout the entire development process we also cooperated closely with stakeholders (i.e., organizations that represent the interests of the target group). The results of these efforts were
Accessible Web Maps for Visually Impaired Users – Hennig et al. | 7
AccessibleMap project
senTour project
Duration
2011–2013
2014–2016
Funding
Austrian Federal Ministry of Transport, Innovation and Technology (BMVIT) under the FFG Benefit Program
Goal
Development of a web map pilot that allows users to explore and memorize a city area and/or a route before going there
Development of a web portal, including an accessible web map that informs users of (accessible) recreational infrastructure (parking, trails, points of interest, etc.)
(Main) target group
The visually impaired, including the blind and color vision impaired
The disabled and elderly with focus on visually impaired users (due to the relevance of age-related vision changes)
Study area
An urban environment: the 2nd and 20th districts of Vienna
A natural site: Austria’s Gesäuse National Park
Table 2. Overview of the AccessibleMap and senTour projects.
Figure 1. Workflow and methods used in the AccessibleMap and senTour projects to gain understanding of users and their needs and to develop design recommendations.
then combined and allowed us to develop design recommendations. Additionally, the findings obtained in the AccessibleMap project provided background for the subsequent senTour project.
collected through a literature review. Our focus was on literature regarding (web) accessibility, geoinformatics and cartography, software and web engineering, and behavioral geography.
Literature Review
Questionnaires
In the first step, existing information on what to consider when creating web maps for visually impaired users was
In both projects questionnaires, prepared using the internet survey tool SurveyMonkey, were used to close
Cartographic Perspectives, FORTHCOMING
Accessible Web Maps for Visually Impaired Users – Hennig et al. | 8
knowledge gaps identified through the literature review. The AccessibleMap project questionnaire—addressing visually impaired and blind users—consisted of 55 open and closed questions (Table 3): 20 questions were directed towards all users, 16 towards profoundly visually impaired and blind users, and 19 towards users with low vision including color vision impairments. Several questions were asked in order to collect information about which existing city web maps the target group used and which aspects and features they liked and disliked about these applications. The questionnaire was distributed through face-toface interviews and via email in the autumn and winter of 2011–12, in Austria, Germany, and Switzerland. The senTour project used two questionnaires. The first was addressed to managers of large protected areas in Germany, Austria, and Switzerland in the autumn and winter of 2014–15. It encompassed 17 mostly open questions focusing on their experience with (digital/web-based) accessible products and which solutions they considered to be examples of best practices. The second questionnaire was directed towards the target user group. It contained 23 open and closed questions on socio-demographic data (e.g., place of residence, age, gender, educational level), the infrastructure used and desired by the target group, sources of information available for them to plan and conduct recreational visits to natural sites, and their preferences regarding the provision of information (amount, type, etc.). In the spring of 2015, the questionnaire was distributed through email; face-to-face interviews were also conducted. Internet Research and AoSS We then conducted an analysis of similar systems (Nemeth 2004) based on the applications and elements mentioned by the questionnaire respondents as well as those identified through internet research. Attention was given to
Focus of questions Socio-demographic and personal data Internet use behavior
Use of web maps
Age, gender, education level, place of residence, type and degree of visual impairment, etc. Extent of internet use, use of digital devices, use of assistive technology, etc. Extent of use, problems faced, web maps used, assessment of web maps used, etc.
User preferences & needs related to the web map design
Design and structure of the user interface; design of (map) point, line, and area features; and design of map labels
Verbal description of the map content
Preferred wording to describe certain situations (e.g., crossings, course of a road), content to be delivered, etc.
Table 3. Focus of the AccessibleMap questionnaire.
aspects such as user interface and map design, the content and functionalities implemented, and web accessibility principles such as those outlined in WCAG 2.0 (W3C 2008). Stakeholder Involvement Target group organizations (for AccessibleMap, the Austrian Association in Support of the Blind and Visually Impaired; for senTour, the Austrian National Council of Disabled Persons) were involved throughout the development process for both pilot web maps. They supported tasks related to gaining a deeper understanding of the intended user groups, such as advising on suitable questionnaire design, getting in contact with the target groups, and specifying user requirements.
OV E RV I E W O F S E L E C T E D R ES U LT S RELEVANT AN D USEFU L LITERATU RE
Even though there are presently only a few spe-
cific recommendations for creating, in particular, web maps that meet the needs of the disabled (and in particular the visually impaired), there is abundant literature that can still be useful when developing such web maps.
Cartographic Perspectives, FORTHCOMING
Numerous standards and guidelines exist to enhance the accessibility of digital and web-based products. They provide information on interface design, human computer interaction, and the use of input/output devices that is helpful for the development of accessible web maps. Examples include:
Accessible Web Maps for Visually Impaired Users – Hennig et al. | 9
• WCAG 2.0 “Web Content Accessibility Guidelines” • ISO/IEC TR 29138-1 “Information technology — Accessibility considerations for people with disabilities — Part 1: User needs summary • ISO TS 16071 “Ergonomics of human-system interaction — Guidance on accessibility for human-computer interfaces” • ISO 9241-171:2008 “Guidance on software accessibility” • ISO/IEC 9241—20:2008 “Accessibility guidelines for information/ communication technology (ICT) equipment and services” • IBM Developer Accessibility Guidelines Useful information can also be found in usability guidelines and recommendations. In particular, the Nielsen Norman Group (nngroup.com) has developed documents focusing on the usability of digital and web solutions for the visually impaired and the blind (see, for example, Nielsen 1994; Nielsen 1996; Pernice and Nielson 2001). Literature specific to special needs cartography, such as Höckner et al. (2012) and Ienaga et al. (2006), delivers recommendations on how to design maps that are suitable for the intended user audience, as well as discussing the map content they require (e.g., information in support of orientation Number of and way-finding). There is also a Respondents body of research related to maps for the color vision impaired (see, for example, Culp 2012; Harrower and Brewer 2003; Jenny and Kelso 2007; Olson Age and Brewer 1997). Verbal descriptions of map content are necessary to support the blind in constructing cognitive/ mental maps. For this, literature on behavioral geography is particularly useful: how the blind navigate and orient themselves in indoor and outdoor environments, on navigation systems, on spatial cognition and mental mapping (Ferguson and
Cartographic Perspectives, FORTHCOMING
Hegarty 1994; Millonig and Schechtner 2005; Tversky 1993; Giudice et al. 2007; Sánchez and Torre 2010). Q U ESTI O N NAI RE RESU LTS After removing invalid responses (such as those from users who were not visually impaired), 158 of 199 AccessibleMap project user questionnaires remained. Of those, 63% of the respondents were people with low vision, while 37% were severely visually impaired or blind. Table 4 provides an overview of the respondents’ socio-demographic data, and Figure 2 presents selected questionnaire results. Further, the respondents named and commented on several city web maps they used, including specific ones for Berlin, Hagen, Mainz, Bern, and Vienna, as well as Google Maps and OpenStreetMap. Of the 197 managers of large protected areas to which the first senTour project questionnaire was sent, 68 responded. Collectively, respondents named more than 30 websites or web applications that in one or another way were directed to the target user group of the disabled and elderly. Examples included the websites of Lüneburger Heide Nature Park (Germany), Gesäuse National Park (Austria), Dümmer Nature Park (Germany), Harz National Park Low vision & color vision impaired users (n=99)
Blind users (n=59)
low vision: 59%; color vision impaired: 4%
37%
< 30 years: 11% < 40 years: 9% < 50 years: 13% < 60 years: 10% < 70 years: 14% ≥ 70 years: 2% No data: 41%
< 30 years: 4% < 40 years: 12% < 50 years: 10 % < 60 years: 10% < 70 years: 5% ≥ 70 years: 0% No data: 59%
Gender
Female: 31%; Male: 37% No data: 32%
Female: 24%; Male: 47% No data: 29%
Education level
High school degree: 11% University degree: 23% Vocational training: 19% Others: 14% No data: 33%
High school degree: 17% University degree: 27% Vocational training: 17% Others: 10% No data: 29 %
Table 4. Summary of respondents’ socio-demographic data in the AccessibleMap project questionnaire.
Accessible Web Maps for Visually Impaired Users – Hennig et al. | 10
Use of devices by the visually impaired (multiple responses)
Use of the internet by the visually impaired
Relevance of visual variables in the map by the visually impaired
Use of assistive technology by the visually impaired (multiple responses)
(multiple responses)
Preference regarding the description of directions
Preference regarding the description of crossings
(severely visually impaired and blind users)
(severely visually impaired and blind users)
Figure 2. Selected results from the AccessibleMap project questionnaire.
Cartographic Perspectives, FORTHCOMING
Accessible Web Maps for Visually Impaired Users – Hennig et al. | 11
(Germany), Südschwarzwald Nature Park (Germany), and Eifel National Park (Germany). The second senTour project questionnaire, which was directed to web map users, received 129 valid responses. Table 5 gives a summary of respondents’ characteristics and Figure 3 presents selected results.
Questionnaire Respondents (n=129)
Age
Gender
B EST- PRACTI CE EXAM PLES The questionnaires and our internet research provided us information about web (map) applications that in one way or other met the needs of the target groups. Table 6 lists and describes those applications with components that can serve as a pattern or template for the development of web maps accessible to the visually impaired.
Education level
Suffering from visual impairment
< 55 years: 24% 55–60 years: 16% 61–65 years: 24% > 65 years: 34% No data: 2% Female: 54%; Male: 44%; No data: 2% High school degree: 19% University degree: 29% Vocational training: 36% Others: 12% No data: 5% Moderately visually impaired: 57% Severely visual impaired or blind: 9% Others: 34% No data: 0%
Table 5. Summary of respondents’ characteristics for the senTour project target group questionnaire.
Preferences about the amount of information to be delivered
Use of the internet to get information to plan and prepare recreation trips
Figure 3. Selected results from the senTour target group project questionnaire.
RECOM M EN DATI O N S F O R T H E D E VELO PM EN T O F WEB M A PS S U I TA B L E F O R V I S U A L LY I M PA I R E D M A P U S E R S As we discussed in our Introduction, visually impaired
users face different problems when using web maps. These problems vary depending on the type and degree of their visual impairment. Accordingly, we offer different recommendations for the color vision impaired, the moderately
Cartographic Perspectives, FORTHCOMING
visually impaired, and the severely visually impaired or blind (Table 7). These recommendations relate to user interface design, map design, interaction modes, and the verbal description of map content, each relevant in creating web maps accessible to these user groups.
Accessible Web Maps for Visually Impaired Users – Hennig et al. | 12
Best-practice components Use of the keyboard to navigate the map Optimal map design aspects: Google Maps www.google.de/maps
•
representation of different categories of roads with different colors (main/important roads: yellow; smaller roads: white)
•
representation of different categories of buildings with different colors
•
presentation of different point of interest (POI) categories using different icons and colors
•
labels do not overlap any POI symbols
User can select between different basemaps, including ones with high/optimized contrast (e.g., a black & white basemap) Vienna city map (Austria) www.wien.gv.at/stadtplan/en
Use of arrow keys to pan around the map Layer-switching control is located outside the map component Presentation of different POIs with different icons and colors High contrast between buildings (red) and roads (white) Provision of emergency numbers
Bern city map (Switzerland) map.bern.ch/stadtplan German Railway reiseauskunft.bahn.de (after selection of start and end station, press button map view) Immoscout www.immobilienscout24.de (select object, scroll down to map) Harz National Park (Germany) www.nationalpark-harz.de Eifel National Park (Germany) www.nationalpark-eifel.de Lüneburger Heide Nature Park (Germany) www.naturpark-lueneburger-heide.de/ aktiv-in-der-heide/naturpark-barrierefrei/ barrierefreies-natur-erleben/amelinghausen
User can select between different basemaps, such as a black & white one Buttons with high contrast between text and background Placement of zoom buttons outside the map component Design of zoom buttons: large buttons with labels Pan the map by arrow buttons located around the map component
Placement of layer selector outside the map component Design of layer selector: large buttons with well-known symbols Website developed according to WCAG 2.0 principles: e.g., use of text-to-speech technology, allowing users to choose higher contrast text and background colors, zoomable web page Website developed according to WCAG 2.0 principles: e.g., users can change font size, choose higher contrast between the text and background colors, switch to a text-based version (with verbal description of the content), or access verbal description of images Features a verbal description of the trail shown in a static map, including a general description of the trail, and how to visit it Verbally describes specific accessibility aspects of the trail, such as its length, conditions, material, and the availability of barrier-free infrastructure
Table 6. Selection of web applications addressing the needs of the visually impaired in one way or another.
User interface design Map Interaction mode Verbal description of map content
Color vision impaired
Moderately visually impaired
Severely visually impaired, blind
General user interface design guidelines
Depending on the type and degree of visual impairment: general user interface design guidelines application of web accessibility principles
General user interface design guidelines Application of web accessibility principles
Optimized visual design
Optimized visual design
Visual
Visual and auditory
Auditory
Nice to have
Depending on the degree of visual impairment
Mandatory
Table 7. Requirements for users with different types and degrees of visual impairment.
Cartographic Perspectives, FORTHCOMING
Accessible Web Maps for Visually Impaired Users – Hennig et al. | 13
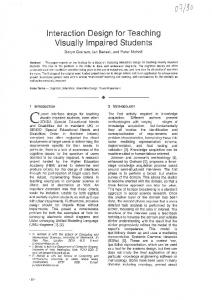
USER I NTERFACE D ESI G N AN D STRU CTU RE As outlined by Tsou and Curran (2008), the user interface is the prime factor that decides upon the fate of any software application—in the worst case, even determining whether or not an application is used at all. For accessible applications and websites, an appropriately designed user interface is even more important (Hung 2001; Jacobson 1998; TTC 2013). Web maps are a special kind of web application. Apart from elements common to other web applications, such as orientation and navigation tools, messaging systems, help components, and setting tools, web maps have a map component that is embedded in their graphical user interface (GUI). This map component itself also comes with several of its own elements: navigation tools for panning and zooming the map, feature pop-up windows, layer and basemap selectors, etc. Like the GUI, the map component (including its related elements) must be accessible and developed in line with user needs. Arrangement of Components To ensure an application is easy to use, its user interface should be kept simple and consistent, and follow a clear, predictable layout (Nielson 1994; W3C 2008). Achieving this involves the careful selection and arrangement of individual interface components. Since these components are usually linked to specific functions, user interface design depends on the range of functions implemented. In order to benefit the target group, user interface complexity can be decreased by considering the following guidelines (which mostly refer to the development of desktop GUIs): • implement only as many control elements as necessary and as few as possible—check for unnecessary elements and remove them (Guenga et al. 2006); • control elements with similar focus should be grouped with each other—but at the same time, avoid grouping too many elements at once (Pernice and Nielsen 2001; W3C 2008); • locate control elements of the same type in the same place across similar programs (as is done, for example, by Microsoft Office applications) (W3C 2008); • provide a flat and horizontally organized interface structure, with no dropdown or nested elements (Pernice and Nielsen 2001);
Cartographic Perspectives, FORTHCOMING
Figure 4. Sketch of a web map layout that is designed for easier access by the visually impaired.
• avoid or reduce scrolling, so that all (critical) elements are visible and accessible without scrolling the screen (Pernice and Nielsen 2001); and • avoid overlapping of elements (WAWG 2014). The last point is particularly relevant for web maps. In these applications, basemap selectors and navigation tools are often placed within the map component, which makes it difficult for visually impaired users to read the map as well as to recognize and use control elements. Interaction tools (e.g., for zooming and panning, or selectors for basemaps and overlays) should be located outside the map component. They should not cover parts of the map. Taking into account the AoSS results (Table 6), Figure 4 illustrates an arrangement of the map component and related elements within the GUI that is optimized to support the visually impaired. Visual Design of Components An appropriate visual user interface design makes it easier for users to perceive, understand, and operate an application (ITU/G3ict 2014b). To assist users, interfaces and their components must be implemented in a suitable size. Likewise, colors should be chosen to provide high contrast between elements such as text, buttons, and checkboxes. Complex background, such as pattern fills, should be
Accessible Web Maps for Visually Impaired Users – Hennig et al. | 14
avoided. Symbols should be well known to users and intuitive to understand (ITU/G3ict 2014b; W3C 2008; Figure 4). Language Used To make information accessible (i.e., understandable), the careful use of language plays an important role (W3C 2008). This is relevant not only to visually impaired users, but to all non-expert users of spatial data products. Hennig and Vogler (2016) state that laypersons often refuse to click buttons labeled with (technical) terms unknown to them; they instead close the application. Hence, all terms used throughout an application must be familiar to the users. Simple and user-focused language as well as consistent semantics should be used (W3C 2008). MAP A map that is as easy as possible to read increases success in communicating the content to the users (Kraak and Ormeling 2010). This is especially relevant for people with reduced vision or those affected by color vision impairments. A thoughtful choice of visual variables (size, shape, position, pattern, arrangement, and color) to create point, line, and area symbols can make the difference between a map being easy or difficult to read (Christophe and Hoarau 2012; Muehlenhaus 2014). The AccessibleMap project questionnaire results confirm the importance of visual variables in creating a visual design suitable for visually impaired users (Figure 2). Hung (2001), as well as Jeffrey and Fendley (2011), suggest that size and color (e.g., no garish colors, but saturated and bright colors), and increased contrast settings between features such as buildings, streets, parks, places, points of interest, annotations etc. are important aspects to consider in the appropriate presentation of map features to the target group. Since patterned areas and lines are easier to recognize and to distinguish than areas or lines with coloring only, Jenny and Kelso (2007) recommend combining coloring with simple patterning to enhance map readability. They also suggest that feature labeling (e.g., buildings, streets, parks, and rivers) is helpful for the user group to understand the map content. A selection of recommendations on the usage of visual variables for map features and text elements (labels, annotations, pop-ups, etc.) is listed in Table 8. These recommendations are not only important
Cartographic Perspectives, FORTHCOMING
for building basemaps, but also for displaying overlays (such as points of interest) on maps. One way to meet the (different) map needs of moderately visually impaired and colorblind users is to provide a set of basemaps the user can choose from. Thus, for instance, the Vienna and Bern city web maps permit the user to switch between a standard basemap and a black and white version. The high contrast between black and white makes these basemaps particularly useful for visually impaired users. To optimize color contrasts, color contrast ratio and related recommendations are useful (for instance, those presented in detail in W3C [2008]). Finally, tools such as ColorBrewer (colorbrewer2.org), Color Oracle (colororacle.org), or Color Contrast Checker (webaim.org/resources/contrastchecker) can be used to create and test color vision impaired-friendly designs. Due to the different types and degrees of visual impairment, the literature suggests permitting user adjustment of contrast, symbol size, line width, color combinations, and color brightness (Andrews 2007; Jeffrey and Fendley 2011). This is confirmed by the AccessibleMap questionnaire results (Figure 2): 77 % of the respondents would prefer to be able to adjust one or more visual variables in the map themselves. I NTERACTI O N M O D ES Currently, user interfaces are usually implemented as GUIs. The users interact with the system through menu bars, icons, and windows; these interactions are handled by input devices such as mice, keyboards, or touchscreens. Information is returned as a graphical display on the device’s screen. Since GUIs rely heavily on the visual sense, people who are severely visually impaired or blind are at a disadvantage. However, supporting keyboard accessibility, as well as using assistive technology, can be pivotal to a solution. Keyboard Accessibility Keyboard accessibility is important for improving the operability of web maps for visually impaired users (Langen and Ballantyne 2014; Victorian Government 2011; W3C 2008). Many severely visually impaired and blind users typically use a keyboard to navigate applications. Even for users who are partially sighted, the use of a keyboard provides easier access to web content (WebAIM 2016).
Accessible Web Maps for Visually Impaired Users – Hennig et al. | 15
Recommendations •
Simple symbols and glyphs (Gill 2009; Harley 2014)
•
Widely/well-known icons (Jeffrey and Fendley 2011)
•
Appropriate color design: use of bright colors (Liu 2010); optimized color contrast between symbol and background, symbol and surrounding items (Fowler 2011; Jenny and Kelso 2007) according to the color contrast ratio as discussed in WCAG 2.0 (W3C 2008)
•
Different colors and icons for different features (Jenny and Kelso 2007)
•
Adequate size of symbols and glyphs—this depends on a number of parameters such as the user, complexity of the symbol, display qualities, and viewing conditions; thus, the minimum acceptable symbol size has be tested by the intended user group (Gill 2009)
•
Lines should not be too thin, however appropriate thickness depends on color use and color contrast to the background (see, for example, Gill 2009; W3C 2017)
•
Appropriate color design: use of bright colors (Liu 2010); optimized color contrast between lines and other elements (Jenny and Kelso 2007) according to the color contrast ratio as discussed in WCAG 2.0 (W3C 2008)
•
Different colors to represent different types of lines (Galvin 2014; Jenny and Kelso 2007)
•
In addition to color, use different line thickness and patterns to represent different types of lines (AccessiQ 2015; Galvin 2014; Jenny and Kelso 2007)
•
Use dark outlines (see, e.g. Liu 2010)
•
Appropriate color design: use of bright colors (Liu 2010); optimized color contrast between lines and other elements (Jenny and Kelso 2007) according to the color contrast ratio as discussed in WCAG 2.0 (W3C 2008)
•
To distinguish different types of areas, use patterns in combination with colors (Jenny and Kelso 2007; W3C 2016)
•
Optimize color contrast between text and background, or between text and surrounding text; black letters on a white background are considered best practice (Fowler 2011; Jeffrey and Fendley 2011; W3C 2016)
•
Use of simple, well-established, and popular sans serif typefaces (Jeffrey and Fendley 2011)
•
No underlining or italicizing of characters (Jeffrey and Fendley 2011; W3C 2016)
•
Only the first character of a word should be capitalized (if any are at all), others are written in lower case letters (W3C 2016)
•
Suitably large font size: guidance on type size varies from recommending 12 to 18 point type (Jeffrey and Fendley 2011; W3C 2008)
•
Left-aligned (Jeffrey and Fendley 2011)
•
Not overlapping with other features or labels (WAWG 2014)
Points
Lines
Areas
Text
Table 8. Recommendations on how to employ visual variables to design a map suitable for visually impaired users.
In addition to addressing commonly relevant aspects of keyboard accessibility, such as the provision of focus indicators or the definition of a navigation order (WebAIM 2016), map control elements must be designed and implemented in a particular way. Map navigation tools should provide pre-defined, discrete zoom and pan steps that are tied to keyboard shortcuts, permitting the user to navigate around the map without using a mouse. In Google Maps, for example, to move the map north or south in small steps, the arrow-up or -down keys can be used; to move the map north or south in large steps, the page-up or -down keys can be used (Table 6).
Cartographic Perspectives, FORTHCOMING
Assistive Technology Assistive technology refers to any object or system directed toward aiding people with disabilities in interacting with their environment, in communicating with others, and in accomplishing a variety of tasks. With regard to digital products, assistive technology refers to technology that supports users in accessing and using software applications and websites (W3C 2008). Among existing assistive technology tools, voice output, screen readers, Braille displays, and magnification
Accessible Web Maps for Visually Impaired Users – Hennig et al. | 16
software are the most popular (Bártek and Kopeček 2006; Leporini and Paternò 2008). The importance of assistive technology for our target group is confirmed by the results of the AccessibleMap questionnaire (Figure 2): among moderately visually impaired users magnifier software is used most frequently (38%), while the severely visually impaired and the blind primarily use Braille displays (89%), voice-over (89%), and screen reader software (79%). Screen magnification is relatively easy to implement using existing software tools (such as Virtual Magnifying Glass) or custom-programmed solutions (using, for example, JavaScript libraries). In contrast to this, Braille displays, screen readers, and voice-over software, require specific applications to be installed by the user. If needed, external devices such as Braille displays must also be available. To support these options, text alternatives for every non-text element (including the map itself) must be available. Depending on the tool, text alternatives are read aloud (screen reader, voice-over) or are delivered as tactile output (Braille display). Very short verbal descriptions (~125 characters) of images (including embedded static web maps) are usually provided using the ALT-attribute/ALT-tag in HTML (Nielsen 1996; Penn State Accessibility 2015b). To deliver more detailed descriptions of non-text elements than the ALT-tag can offer, or to provide any kind of verbal information about dynamic/interactive web maps, text can be presented in separate components (such as additional browser tabs) related to the map (Table 6: Lüneburger Heide Nature Park; Eifel National Park).
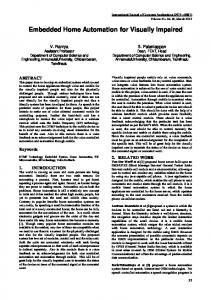
its content via the use of the ALT-tag. In contrast to this, writing a more comprehensive verbal description of (interactive/dynamic) map content is a challenge (see, for example, Ferguson and Hegarty 1994; Jacobson 2002): apart from information about individual features (“bus stop,” “street,” “crossing,” etc.), a holistic overview of an area of interest has to be given. This must include information about the relationships and distances between different elements (for example, “this shop is located on Main Street; it is twenty meters away from the intersection of Main Street and 3rd Avenue”). Amount of Information Since people usually can only remember a limited number of things at a time (on average seven, according to Nielsen [2009]), the amount of information an application delivers must be in line with this. Users should not be overloaded with too much detail. Detailed descriptions should focus on certain locations (e.g., selected by the user or user’s current position; Giudice et al. 2007). Here, to understand an entire map, a user can start at a selected location and then move virtually along streets or trails, receiving information on each section along the way (Figure 5). As the user moves around the map, step by step, a comprehensive description of its content is given. This enables the user to explore the map gradually and build up a cognitive map of an area without using the visual sense.
VERBAL D ESCRI PTI O N O F TH E MAP CO NTENT As outlined in the literature, maps (as well as other nontext elements such as images or diagrams) should be provided with both a brief sentence-length description as well as a more detailed one (Penn State Accessibility 2015a; Victorian Government 2011; W3C 2008). The availability of a brief explanation was considered particularly important by the majority of senTour project user questionnaire respondents (Figure 4). A short comment on the map’s content can usually be created without any difficulty, since it is usually a simple and static text that delivers a general overview of the map and
Cartographic Perspectives, FORTHCOMING
Figure 5. Example approach to deliver a verbal description on the map content (adapted from Wasserburger et al. 2011).
Accessible Web Maps for Visually Impaired Users – Hennig et al. | 17
Order of Information The order in which information is presented should be in accordance with its relevance to the user, prioritizing key elements for the construction of a cognitive map such as reference points or cues (landmarks), first and, second, paths, streets, or trails (Ferguson and Hegarty 1994; Millonig and Schechtner 2005; Tversky 1993). This approach is particularly important for people who are blind, since they usually walk linearly along a chain of orientation points. However, the landmarks, orientation points, and points of interest used by the blind are often different from those of the sighted. The blind consider elements such as acoustic traffic lights, tactile guiding systems, or type of pavement to be relevant (Ienaga et al. 2006; Jacobson 1998). Information on Distance and Direction Distance information should be provided using both metric and walking time measurements (Kalia et al. 2010). Information on direction should be provided based on
using body-orientation indications (left, right, forward, backward, etc.), the cardinal points system (north, south, east, west), or the hour system. The hour system uses a metaphor to indicate directions: the user is imagined to be in the center of an analog clock, with 12:00 to their front, 3:00 to their right, 6:00 directly behind them, 9:00 to their left, and so on (Sánchez and Torre 2010). The AccessibleMap project questionnaire’s results underline the hour system’s relevance for describing directions: 49% of the respondents prefer it (Figure 2). The AccessibleMap questionnaire respondents also preferred pedestrian crossing layouts to be described using letters (e.g., T-, V- or X-crossing; Figure 2). Today, verbal descriptions of map content can often be generated automatically using spatial databases and geographic information systems. This allows the description to be adapted whenever the user selects a new location on the map, or whenever the map content changes due to user interactions (zooming, panning, switching layers, etc.).
A D D I T I O N A L CO N S I D E R AT I O N S I N I N C R E A S I N G ACC ES S I B I L I T Y The work conducted in the AccessibleMap and sen-
Tour projects allowed us to not only develop recommendations about what to consider when creating web maps that are accessible to the visually impaired, but also made Description Accessibility
Usability
Utility
Compatibility
Extent to which the product is usable by people with the widest range of capabilities Extent to which the product can be used by specified users to achieve specified goals with effectiveness, efficiency, and satisfaction, in a specified context of use Extent to which the product provides functionality that meets real user needs, such as those associated with independent living and participation in society Extent to which the product works together with other devices, and conforms with current technical standards, guidelines, and laws
Table 9. Criteria closely linked to accessibility (based on ITU/ G3ict 2014a).
Cartographic Perspectives, FORTHCOMING
it obvious that additional aspects should be considered to enable these users to benefit fully from web maps. ACCESSI B I LITY AN D RELATED CO N CEPTS As we discussed above, web accessibility focuses on the removal of technical barriers that might hamper people with disabilities from accessing information. However, it does not explicitly address other, equally important considerations. But, accessibility alone is not enough: usability, utility, and compatibility must additionally be considered (Table 9). Together, these four concepts, which are closely intertwined with each other, provide a framework of characteristics for products that aim to be well suited for disabled users (ITU/G3ict 2014a; ITU/G3ict 2014b; Leporini and Paternò 2008). In consequence, the concept of accessibility must be considered broadly. The terms usability and accessibility are closely related, but each has a different focus, though their objectives, approaches, and guidelines overlap significantly. Krug (2006) suggests that a website (or any product) is not usable unless it is accessible, and Brajnik (2000) stresses that accessibility is a subset of usability.
Accessible Web Maps for Visually Impaired Users – Hennig et al. | 18
The same is true for utility and compatibility: websites and web applications must not only be accessible, but they must also provide content, functionality, and access to devices relevant to its users. Thus, for instance, our intended user group requires functionality that permits the use of assistive technology. Further, apart from the information commonly found in web maps (e.g., streets, places, buildings, parks, and rivers; Horstmann et al. 2006), visually impaired users require information on specific infrastructure (e.g., guidance systems, accessible parking, toilets, and public transportation) and feature characteristics
(i.e., tactile, audible, and smellable). Such elements play a particularly important role in helping the blind to orient themselves in physical space and to engage in wayfinding (Ienaga et al. 2006; Karimi et al. 2014). D I G ITAL AN D SPATIAL LITERACY
The questionnaire results obtained in the AccessibleMap and senTour projects highlight the widespread usage of information and communication technology (ICT) among the target group: the majority of the AccessibleMap project questionnaire respondents indicated they use desktop PCs, Selected skills and competencies Users as laptops, smartphones, and tabRegister/login including self-representation, profile creation, identity lets, and that they use the interProsumer management, etc. net several times a day (Figure 2). The senTour project target Use, create, remix, publish, share, embed content and objects (using Producer different web 2.0 tools) group questionnaire showed that 73% of the respondents Network (search, combine, disseminate information) and negotiate use the internet to get informa(travel across diverse communities, discerning and respecting Prosumer multiple perspectives, etc.) Digital skills tion about recreation or tourism (Figure 3). These results are Work in a cooperative way Producer consistent with the findings of Judge/evaluate the reliability and credibility of information sources Prosumer Harris (2010), who stated that Internet safety issues: copyright, data privacy, etc. Prosumer disabled people engage enthusiastically with technology. Understand the logistics of cloud-based interleaving of services and media
Abilities to handle spatial data products
Capabilities to handle spatial data products
Producer
Know and understand basemaps and layers
Prosumer
Use basic functions of digital maps (find, open, zoom, pan, etc.)
Prosumer
Create maps and features (add markers, lines, areas, labels)
Producer
Add additional information (using information windows/feature pop-ups)
Producer
Handle data files (import, export, convert, transfer)
Producer
Output maps (print, save, export, embed, share)
Prosumer
Re-use data (find data, assess data, process data, integrate data)
Prosumer
Know relevant vocabulary and technical terms (e.g. layer, basemap, POIs)
Prosumer
Cartographic design guidelines: decide upon adequate symbols, map image, background map, combine multimedia and geo-media
Prosumer
Multimedia use (add, post, comment)
Prosumer
Critical reflection on the power of maps
Prosumer
Use maps as a powerful mediator and communication means of interests
Prosumer
Table 10. Selected skills allowing users to use spatial data and spatial data products in a competent and capable manner (adapted from Hennig et al. 2013).
Cartographic Perspectives, FORTHCOMING
Despite their high usage of ICT, the target group considered the use of the internet and of web maps to be a complex task (Höckner et al. 2012). In this context, Guenga et al. (2006, 287) suggest that “better skills using technologies and ICT, make a big difference.” Here, “skills” refers to digital skills and competencies that enable users—who today are acting as prosumers (both consumers and producers) of spatial data (R inner and Fast 2015)—to handle web maps in a competent and capable manner (Table 10). Measures to foster these skills, which are still often missing in society, are desired, including appropriate user support, help and tutorials, as well as
Accessible Web Maps for Visually Impaired Users – Hennig et al. | 19
Advantages General
Development process
Afterwards
•
Developers get to know users; they learn profoundly about user abilities, use purposes, and life circumstances
•
Prevent and reduce problems of communication and misunderstanding between developers and users
•
Users offer a source of new ideas
•
Valuable user input
•
Address users’ lack of awareness of their own requirements and their inability to outline these reliably
•
Support developers to identify, describe, and fully recognize user requirements
•
Avoid undesirable developments
•
Guarantee that the application aligns with user needs/demands and that it delivers a good user experience (focusing, for example, on accessibility, usability, utility, compatibility, and desirability)
•
Increase user knowledge and acceptance of the application
•
Ensure that the implemented product really meets the needs of the user group
Table 11. Selected advantages of participatory design (Hennig and Vogler 2016).
education and training offers. It is widely accepted that such measures to strengthen spatial literacy are equally important as providing accessible applications (Hennig et al. 2013). PARTI CI PATO RY D ESI G N The methods used in the AccessibleMap and senTOUR projects—literature and internet review, user survey, AoSS, and stakeholder involvement (Figure 1)—are well-recognized in software engineering and requirements engineering. But, applying them might not be enough to gain a profound understanding of users. Reasons include communication problems between users and developers (misunderstandings, use of different vocabulary, etc.), users’ lack of awareness of their own needs, and users’ lack of ability to reliably describe their requirements (Firesmith 2007; Hennig and Vogler 2016). Direct and active cooperation with future users in the application development process can be seen as a remedy to these shortcomings, using the approach of participatory design. Participatory design is defined as a process that aims at involving representatives of future users in the design and development process of a system or product. This can occur in different ways and with varying intensity (Baek et al. 2007). A distinction is made between weak and strong
participatory design: in weak participatory design, even though user input is solicited throughout the entire development process, decision making is largely undertaken by the developers. In strong participatory design, the users take part in decision making. Detailed information on participatory design can be found in the literature (see, for example, Enerson 2013; Mazzone and Read 2005; Steen et al. 2007). Several advantages of participatory design are laid out in Table 11. Because users are experts in their own requirements, participatory design exposes user needs and skills (as tacit knowledge: aspects usually not known to developers) and brings them into the development process. This helps to generate applications that better adhere to users’ aims (Muller and Druin 2012; Steen et al. 2007), which is particularly relevant for the development of web maps that address laypersons and/or special needs users such as disabled people, the elderly, and non-adults. Tsou (2003) stresses that the developers of web maps are challenged with meeting the needs of non-experts, who are a lot more diverse and unfamiliar to the developers than are traditional GIS users. Hennig and Vogler (2016) further explain that special needs users, including visually impaired users, are even more unknown to web map developers. Thus, the participatory design approach can play a critical role in the development of accessible web maps.
CO NCLUSIO N AND OUTLO OK The use of web maps is as important for the visually
impaired as it is for sighted people, and sometimes it is even more important. Having access to spatial information
Cartographic Perspectives, FORTHCOMING
regarding unknown areas allows them to plan and prepare trips in advance; this can lead to a more independent life. Since accessible web maps focus on enabling everyone to
Accessible Web Maps for Visually Impaired Users – Hennig et al. | 20
benefit from ICT, including the internet, these applications can be seen as a contribution towards e-inclusion, and strengthening the information society. Even though visually impaired users may require special solutions depending on the type and degree of their visual impairment, the following recommendations are of general interest when developing web maps accessible to them: provide an easy-to-use and well-designed user interface with a well thought out range of implemented functions; create an easy-to-read map picture; support different interaction modes (including use of assistive technology); and give a verbal description of the map content. Due to these issues web maps accessible to visually impaired users are different from conventional web maps. They feature added flexibility, alternative modes, and more
choices for their users. But making web maps accessible to disabled users does not mean that they become any less useful for others. To the contrary, increased accessibility often results in improved design for everyone, as it makes applications easier to use and more attractive. In support of building applications tailored to the visually impaired, several standards and guidelines exist, but there are very few recommendations that provide guidance on creating accessible web maps, specifically. This gap needs to be filled. We refer not only to the provision of these recommendations, but also to the elaboration of design patterns, describing and presenting best-practice solutions, which should be evaluated by experts and target groups. Having such information at hand would be helpful to developers who are designing and implementing accessible web maps.
REFERENCES AccessiQ. 2015. “Accessibility Tip: Making Maps Accessible.” Accessed July 31 2017. http:// www.accessiq.org/news/news/2015/03/ accessibility-tip-making-maps-accessible. Andrews, C. J. 2007. “Emerging GIS Technology and Accessibility: Online Mapping for Everyone.” Directions Magazine, March 9, 2007. http:// www.directionsmag.com/articles/emerging-gistechnology-and-accessibility-online-mapping-foreveryone/122929. AOA (American Optometric Association). 2014. “Color Vision Deficiency.” Accessed December 13, 2016. http://www.aoa.org/ patients-and-public/eye-and-vision-problems/ glossary-of-eye-and-vision-conditions/ color-deficiency. Baek, E.-O., K. Cagiltayik, E. Boling, and T. Frick. 2007. “User-Centered Design and Development.” In Handbook of Research on Educational Communications and Technology, edited by J. M. Spector, M. D. Merrill, J. J. van Merrienboer, and M. F. Driscoll, 659–670. New York: Routledge Chapman & Hall.
Cartographic Perspectives, FORTHCOMING
Bártek, L. and I. Kopeček. 2006. “Web Pages for Blind People — Generating Web-Based Presentations by Means of Dialogue.” International Conference on Computers for Handicapped Persons 2006, Linz, July 9–11. doi: 10.1007/11788713_18. Brajnik, G. 2000. “Automatic Web Usability Evaluation: What Needs to be Done?” 6th Conference on Human Factors and the Web, Austin, June 19, 2000. Brock, A., B. Oriola, P. Truillet, C. Joufrais, and D. Picard. 2013. “Map Design for Visually Impaired People: Past, Present, Future research.” Médiation et Information 36: 117–129. Brock, A., and C. Jouffrais. 2015. “Interactive Audiotactile Maps for Visually Impaired people.” ACM SIGACCESS Accessibility and Computing 113: 3–12. doi: 10.1145/2850440.2850441. Call-Jimenz, T., and S. Lujan-Mora. 2016. “Web Accessibility Barriers in Geographic Maps.” IJCTE 8(1): 80–87. doi: 10.7763/IJCTE.2016.V8.1024. Christophe, S., and C. Hoarau. 2012. “Expressive Map Design Based on Pop Art: Revisit of Semiology of Graphics.” Cartographic Perspectives 73: 61–74. doi: 10.14714/CP73.646.
Accessible Web Maps for Visually Impaired Users – Hennig et al. | 21
Clark-Carter, D., A. Heyes, and C. Howarth. 1986. “The Efficiency and Walking Speed of Visually Impaired People.” Ergonomics 29(3): 779–789. doi: 10.1080/00140138608968314. CUDE (The Center for Universal Design in Education). 2015. “How are the Terms Low Vision, Visually Impaired and Blind Defined?” Accessed December 13, 2016. http://www.washington.edu/doit/CUDE/ articles?85.
Gill, J. 2009. “Pictograms, Icons and Symbols.“ Accessed July 31, 2017. http://www.johngilltech.com/ guidelines/pictograms.htm. Giudice, N. A., J. Z. Bakdash, and G. E. Legge. 2007. “Wayfinding with Words: Spatial Learning and Navigation Using Dynamically-updated Verbal Descriptions.” Psychological Research 71(3): 347–58. doi: 10.1007/s00426-006-0089-8.
Culp, G. M. 2012. “Increasing Accessibility for Map Readers with Acquired and Inherited Colour Vision Deficiencies: A Re-colouring Algorithm for Maps.” The Cartographic Journal 49(4): 302–311. doi: 10.1179/1743277412y.0000000030.
Golledge, R. G., R. L. Klatzky, and J. M. Loomis. 1996. “Cognitive Mapping and Wayfinding by Adults without Vision.” In Construction of Cognitive Maps, edited by J. Portugali, 215–246. Dordrecht: Kluwer Academic Pubishers. doi: 10.1007/978-0-585-33485-1_10.
Enerson, M. 2013. “User-Centered Design and User Participatory Design — What is the Difference.” Accessed December 13, 2016. http:// www.enervisionmedia.com/user-experiencemonitor/2013/08/User-Centered-Design-And-UserParticipatory-Design.
Guenga, M. L., J. Oliver, and A. Barbier. 2006. “Accessible Interfaces to Empower Users.” In Computers Helping People with Special Needs, edited by K. Miesenberger, J. Klaus, W. Zagler, and A. Karshmer, 279–286, Berlin, Heidelberg: Springer.
Ferguson, E. L., and M. Hegarty. 1994. “Properties of Cognitive Maps Constructed from Texts.” Memory & Cognition 22(4): 455–473. doi: 10.3758/BF03200870. Firesmith, D. 2007. “Common Requirements Problems, Their Negative Consequences, and the Industry Best Practices to Help Solve Them.” Journal of Object Technology 6(1): 17–33. doi: 10.5381/jot.2007.6.1.c2. Foote, K., and S. Crum. 1995. “Cartographic Communication.” Accessed December 13, 2016. http://www.colorado.edu/geography/gcraft/notes/ cartocom/cartocom_f.html. Fowler, A. 2011. “Transcript of Web Mapping Accessibility Presentation.” Accessed December 13, 2016. http://ajfowler.wordpress.com/2011/02/14/ transcript-of-web-mapping-accessibilitypresentation/. Galvin, K. 2014. “Online and Print Inclusive Design and Legibility Considerations.” Accessed July 31, 2017. http://www.visionaustralia.org/business-andprofessionals/digital-access-consulting/resources/ blog---accessibility-and-assistive-technology-blog/ blog/accessibility-blog/2014/12/03/online-and-printinclusive-design-and-legibility-considerations.
Cartographic Perspectives, FORTHCOMING
Harley, A. 2014. “Icon Usability.” Accessed July 31, 2017. https://www.nngroup.com/articles/icon-usability. Harris, J. 2010. “The Use, Role and Application of Advanced Technology in the Lives of Disabled People in the UK.” Disability & Society 25(4): 427–439. doi: 10.1080/09687591003755815. Harrower, M., and C. A. Brewer. 2003. “ColorBrewer. org: An Online Tool for Selecting Color Schemes for Maps.” The Cartographic Journal 40(1): 27–37. doi: 10.1.1.361.6082. Helal, A., S. E. Moore, and B. Ramachandran. 2004. “Drishti: An Integrated Navigation System for Visually Impaired and Disabled.” 2nd IEEE Annual Conference on Pervasive Computing and Communications, Orlando, March 14–17, 2004. doi: 10.1109/ iswc.2001.962119. Hennig, S., and R. Vogler. 2016. “User-Centred Map Applications Through Participatory Design: Experiences Gained During the ‘YouthMap 5020’ Project” The Cartographic Journal 53(3): 213–229. doi: 10.1080/00087041.2016.1148217.
Accessible Web Maps for Visually Impaired Users – Hennig et al. | 22
Hennig, S., R. Vogler, and I., Gryl. 2013. “Spatial Education for Different User Groups as a Prerequisite for Creating a Spatially Enabled Society and Leveraging SDI.” International Journal of Spatial Data Infrastructures Research 8: 98–127. Heuten, W., N. Henze, and S. Boll. 2007. “Interactive Exploration of City Maps with Auditory Torches.” CHI ‘07 Conference on Human Factors in Computing Systems, San Jose, April 30–May 03, 2007. doi: 10.1145/1240866.1240932. Höckner, K., D. Marano, J. Neuschmid, M. Schrenk, and W. Wasserburger. 2012. “AccessibleMap — Web-Based City Maps for Blind and Visually Impaired.” International Conference on Computers for Handicapped Persons 2012, Linz, July 11–13. Horstmann, M., W. Heuten, A. Miene, and S. Boll. 2006. “Automatic Annotation of Geographic Maps.” International Conference on Computers for Handicapped Persons 2006, Linz, July 11–13. doi: 10.1007/11788713_11. Hung, E. 2001. “Blind and Low Vision Users. Principles and Strategies for Practitioners Designing Universally Usable Sites TEWN.” Accessed December 13, 2016. http://www.co-bw.com/DMS_Web_universal_ usability_in_practice_blind_and_%20low_vision__ users.htm. Ienaga, T., M. Matsumoto, M. Shibata, N. Toyoda, Y. Kimura, H. Gotoh, and T. Yasukouchi. 2006. “A Study and Development of the Auditory Route Map Providing System for the Visually Impaired.” International Conference on Computers for Handicapped Persons 2006, Linz, July 9–11. doi: 10.1007/11788713_182. International Council of Ophthalmology (ICO). 2002. “Visual Standards, Aspects and Ranges of Vision Loss with Emphasis on Population Surveys.” 29th International Congress of Ophthalmology, Sydney, April 21–25.
Cartographic Perspectives, FORTHCOMING
ITU/G3ict (International Telecommunication Union/ Global Initiative for Inclusive ICTs). 2014a. “What is an Accessible Product?” Accessed December 13, 2016. http://www.e-accessibilitytoolkit. org/toolkit/product_development_and_design/ accessible_product. ———. 2014b. “Basic Accessibility Principles.” Accessed December 13, 2016. http://www.eaccessibilitytoolkit.org/toolkit/eaccessibility_basics/ basic_accessibility_principles. Jacobson, R. D. 1998. “Navigating Maps with Little or No Sight: A Novel Audio-Tactile Approach.” Content Visualization and Intermedia Representations, Montréal, August 15, 1998. ———. 2002. “Representing Spatial Information through Multimodal Interfaces.” Sixth International Conference on Information Visualisation (IV’02), London, July 10–12. doi: 10.1109/iv.2002.1028858. Jeffrey, C., and T. Fendley. 2011. “Accessible Maps: What We Should Leave Out.” Include 2011, London, April 17-19, 2011. Jenny, B., and N. V. Kelso. 2007. “Color Design for the Color Vision Impaired.” Cartographic Perspectives 58: 61–67. doi: 10.14714/CP58.270. Kalia, A. A., G. E. Legge, R. Roy, and A. Ogale. 2010. “Assessment of Indoor Route-finding Technology for People who are Visually Impaired.” Journal of Visual Impairment & Blindness, March 2010: 135–147. Karimi, A., L. Zang, and J. Benner. 2014. “Personalized accessibility map (PAM): a novel assisted wayfinding approach for people with disabilities.“ Annals of GIS, 20/2: 99-108. doi: 10.1080/19475683.2014.904438. Kraak, M., and F. Ormeling. 2010. Cartography: Visualisation of Spatial Data. New York: The Guilford Press. Krug, S. 2006. Don’t Make Me Think: a Common Sense Approach to Web Usability. Berkeley, California: New Riders Press.
Accessible Web Maps for Visually Impaired Users – Hennig et al. | 23
Langen, G., and B. Ballantyne. 2014. “Making Maps Accessible to the Blind and Partially Sighted.” ArcNews, Summer 2014. http://www.esri.com/esrinews/arcnews/summer14articles/making-mapsaccessible-to-the-blind-and-partially-sighted. Leporini, B., and F. Paterno. 2008. “Applying Web Usability Criteria for Vision-Impaired Users: Does It Really Improve Task Performance?” International Journal of Human-Computer Interaction 24(1): 17–47. doi: 10.1080/10447310701771472. Liu, J. 2010. “Color Blindness & Web Design.” Accessed July 31, 2017. https://www.usability.gov/get-involved/ blog/2010/02/color-blindness.html. Macdonald, S. J., and J. Clayton. 2013. “Back to the Future, Disability and the Digital Divide.” Disability & Society 28(5): 705–718. doi: 10.1080/09687599.2012.732538. Mazzone, E., and J. Read. 2005. “Not Just Bits of Paper — The Outcomes of Participatory Design Sessions with Children.” University of Central Lancaster Department of Computing Conference, Preston. Accessed November 5, 2017. http://www.chici.org/ references/not_just_bits_of_paper.pdf. Millonig, A., and K. Schechtner. 2005. “Developing Landmark-Based Pedestrian Navigation Systems.” 8th International IEEE Conference on Intelligent Transportation Systems, Las Vegas, June 6–8. doi: 10.1109/itsc.2005.1520046. Montello, D. R., and S. M. Freundschuh. 2005. “Cognition of Geographic Information.” In A Research Agenda for Geographic Information Science, edited by R. B. McMaster and E. L. Usery, 61–91. Boca Raton: CRC Press. Moustakas, K., G. Nikolakis, K. Kostopoulos, D. Tzovaras, and M. G. Strintzis. 2007. “Haptic Rendering of Visual Data for the Visually Impaired.” IEEE Multimedia 14: 62–72. doi: 10.1109/ MMUL.2007.10. Muehlenhaus, I. 2014. Web Cartography. Boca Raton: CRC Press.
Cartographic Perspectives, FORTHCOMING
Muller, M. J., and A. Druin. 2012. “Participatory Design. The Third Space in HCI.” In The Human-Computer Interaction Handbook, edited by J. Jacko, 1051–1068, Hillsdale, NJ: Lawrence Erlbaum Associates. Nemeth, C. P. 2004. Human Factors Methods for Design. Making Systems Human-Centered. Boca Raton, London, New York, Washington DC: CRC Press. Nielsen, J. 1994. Usability Engineering. San Francisco: Morgan Kaufmann Publishers. ———. 1996. “Accessible Design for Users with Disabilities.” Accessed July 31, 2017. https://www.nngroup.com/articles/ accessible-design-for-users-with-disabilities. ———. 2009. “Short-term Memory and Web Usability.” Accessed July 31, 2017. https://www.nngroup.com/ articles/short-term-memory-and-web-usability. Olson, J. M., and C. A. Brewer. 1997. “An Evaluation of Color Selections to Accommodate Map Users with Color-Vision Impairments.” Annals of the Association of American Geographers 87(1): 103–134. doi: 10.1111/0004-5608.00043. Parente, P., and G. Bishop. 2003. “BATS: The Blind Audio Tactile Mapping System.” Association for Computing Machinery South Eastern Conference, Savannah, March 7–8, 2003. Pascolini D., and S. P. M. Mariotti. 2012. “Global Estimates of Visual Impairment: 2010.” British Journal of Ophthalmology 96: 614–618. doi: 10.1136/ bjophthalmol-2012-301861. Penn State Accessibility. 2015a. “Maps.” Accessed July 31, 2017. http://accessibility.psu.edu/images/maps. ———. 2015b. “Image ALT Tag Tips for HTML.” Accessed July 31, 2017. http://accessibility.psu.edu/ images/imageshtml. Pernice, K., and J. Nielson. 2001. “Usability Guidelines for Accessible Web Design.” Accessed July 31, 2017. https://media.nngroup.com/media/reports/free/ Usability_Guidelines_for_Accessible_Web_Design. pdf.
Accessible Web Maps for Visually Impaired Users – Hennig et al. | 24
Poppinga, B., C. Magnusson, M. Pielot, and K. RassmusGröhn. 2011. “TouchOver Map: Audio-tactile Exploration of Interactive Maps.” 13th International Conference on Human Computer Interaction with Mobile Devices and Services, Stockholm, August 30– September 02. doi: 10.1145/2037373.2037458.
Tsou, M. H., and J. M. Curan. 2008. “User-Centered Design Approaches for Web Mapping Applications: A Case Study with USGS Hydrologic Data in the United States.” In International Perspectives on Maps and the Internet, edited by M. P. Peterson, 301–321. Berlin: Springer. doi: 10.1007/978-3-540-72029-4_20.
Rener, R. 2017. “The 3D Printing of Tactile Maps for Persons with Visual Impairment.” In Universal Access in Human–Computer Interaction. Designing Novel Interactions, edited by Margherita Antona and Constantine Stephanidis 335–350. Cham, Switzerland: Springer. doi: 10.1007/978-3-319-58703-5_25.
TTC (Toronto Transit Commision). 2013. “Web Accessibility.” Accessed December 13, 2016. http:// www.ttc.ca/TTC_Accessibility/Web_browser/index. jsp.
Rinner, C., and V. Fast. 2015. “A Classification of User Contributions on the Participatory Geoweb.” In Advances in Spatial Data Handling and Analysis, Selected Papers from the 16th IGU Spatial Data Handling Symposium, edited F. Harvey and Y. Leug, 35–50. Cham, Switzerland: Springer. doi: 10.1007/978-3-319-19950-4_3. Sánchez, J., and N. Torre. 2010. “Autonomous Navigation Through the City for the Blind.” ASSETS 2010, Orlando, October 25–27. doi: 10.1145/1878803.1878838. Siekierska, E., and W. McCurdy. 2008. “InternetBased mapping for the Blind and People with Visual Impairment.” International Perspectives on Maps and the Internet, edited by M. P. Peterson, 283–300. Berlin: Springer. doi: 10.1007/978-3-540-72029-4_19. Steen, M., L. Kuijt-Evers, and J. Klok. 2007. “Early user involvement in research and design projects – A Review of Methods and Practices.” 23rd EGOS Colloquium, Vienna, July 5–7. Tsou, M. H. 2003. “An Intelligent Software Agent Architecture for Distributed Cartographic Knowledge Bases and Internet Mapping Services.” In Maps and the Internet, edited by M. P. Peterson, 229–243. Oxford: Elsevier Press. doi: 10.1016/ b978-008044201-3/50016-5.
Tversky, B. 1993. “Cognitive Maps, Cognitive Collages, and Spatial Mental Models.” In Spatial Information Theory: A Theoretical Basis for GIS, edited by A.U. Frank, A. U. and I. Campari, 14–24. Berlin: Springer. doi: 10.1007/3-540-57207-4_2. Victorian Government. 2011. “Victorian Government Accessibility Toolkit.” Accessed July 31, 2017. http:// www.vic.gov.au/blog/wp-content/uploads/2013/11/ accessibility-toolkit-v3.1.1-mar2011-1.pdf. Wasserburger, W., J. Neuschmid, and M. Schrenk. 2011. “Web-based City Maps for Blind and Visually Impaired.” Real CORP, 2011, Essen, May 18–20. W3C (World Wide Web Consortium). 2005. “Introduction to Web Accessibility.” Accessed December, 13 2016. http://www.w3.org/WAI/intro/ accessibility.php. ———. 2008. “Web Content Accessibility Guidelines (WCAG) 2.0.” Accessed December, 13 2016. http:// www.w3.org/TR/WCAG20. ———. 2010. “Relationship Between Web Accessibility and Usability.” Accessed December 13, 2016. http://www.w3.org/WAI/EO/Drafts/access-use/ accessibility-n-usability2010-09Sept-23.html. ———. 2012. “Accessible Maps.” Accessed December 13, 2016. http://www.w3.org/WAI/RD/wiki/ Accessible_Maps. ———. 2016. “Accessibility Requirements for People with Low Vision.” Accessed July 31, 2017. https:// www.w3.org/TR/low-vision-needs.
Cartographic Perspectives, FORTHCOMING
Accessible Web Maps for Visually Impaired Users – Hennig et al. | 25
———. 2017. “Informational Graphic Contrast (Minimum).” Accessed July 31, 2017. https:// www.w3.org/WAI/GL/low-vision-a11y-tf/wiki/ Informational_Graphic_Contrast_(Minimum). Wang, Z., B. Li, T. Hedgpeth, and T. Haven. 2009. “Instant tactile-audio map: enabling access to digital maps for people with visual impairment.” 11th International ACM SIGACCESS Conference on Computers and Accessibility. Pittsburgh, October 26–28. doi: 10.1145/1639642.1639652. WAWG (Web Accessibility Working Group). 2014. “Web Accessibility Part 2: Manual Checks.” Accessed November 5, 2017. http://www.calstatela.edu/sites/ default/files/groups/Information%20Technology%20 Services/training/pdf/webaccessibilityp2.pdf. WebAIM. 2016. “Keyboard Accessibility.” Accessed December, 13 2016. http://webaim.org/techniques/ keyboard.
Cartographic Perspectives, FORTHCOMING
WHO (World Health Organization). 2007. Global AgeFriendly Cities: A Guide. Geneva: WHO Press. ———. 2013. “Visual Impairment and Blindness.” Fact Sheet Number 282. Accessed December 13, 2016. http://www.who.int/mediacentre/factsheets/fs282/en. Zeng, L., and G. Weber. 2010. “Audio-Haptic Browser for a Geographical Information System.” International Conference on Computers for Handicapped Persons 2010, Linz, July 13–15. doi: 10.1007/978-3-642-14100-3_70. ———. 2011. “Accessible Maps for the Visually Impaired.” ADDW 2011, Lisbon, September 5, 2011. Zhao, H., C. Plaisant, and B. Shneiderman. 2005. “I Hear the Pattern – Interactive Sonification of Geographical Data Patterns.” CHI ‘05 Conference on Human Factors in Computing Systems, Portland, April 2–7. doi: 10.1145/1056808.1057052.
Accessible Web Maps for Visually Impaired Users – Hennig et al. | 26