THE IMPORTENCE OF PEERS FOR VISUALLY IMPAIRED USERS OF SOCIAL MEDIA Ingvar Tjostheim, Ivar Solheim & Kristin S. Fuglerud Norwegian Computing Center Gaustadalleen 23, Oslo Norway Email:
[email protected] ABSTRACT For many social media is playing an important role in everyday life. People with visual impairments (VIs) are also using social media quite extensively. In this paper we analyze factors that might explain why social media is used, and the role of social media on better quality of life. We use a structural equation modeling technique to identify factors that are associated with a better life. KEY WORDS Blind and partially sighted, national representative study, social media, the importance of peers, structural equation modeling
1. Introduction Social media, or Web2.0 which is the term that some prefer to use about social network sites (SNS), Facebook in particular but also MySpace, Windows MSN, Twitter and others, is part of everyday life for many. The younger generations were the first to become frequent social media users, but today there are users in all age groups. People with visual impairments (VIs), that is those who are blind and or have low vision are also using mobile phones and the Internet, but they have some challenges that people with good vision do not have. There are usability and accessibility issues that are relevant for visually impaired people. In the following we use the term VIs, to include blind, and people with various levels of low vision. We live in an information society and access for all, or universal access, is a stated goal. This study is based on a survey among members of The Norwegian Association of the Blind and Partially Sighted (NABP). Not all visually impaired in Norway are members of NABP, but a very high percentage. The results from the survey provide information about the current state in a VI population, in this case the VI population in Norway. Secondly, data can be analyzed in order to get insight about factors that might explain how social media are perceived as important and relevant for VIs. This paper is organized as follows, first a literature review with research questions, then research methodology followed by results of the data-analysis and conclusion.
2. Literature Questions
Review
and
Research
2.1 Social Media, VIs and Peers Some previous studies about the social effects of Internet use have indicated that Internet use may lead to social isolation and loneliness, or that that people who are already lonely are more likely to be drawn toward Internet [1]. Results from the World Internet Project in 13 countries, suggest that heavy Internet users have larger and more diverse social networks and that Internet usage is positively correlated an enhanced social life [2]. In a recent study Valenzuela et al. [23] found moderate, positive relationships between intensity of Facebook use and students' life satisfaction, social trust, civic participation and political engagement. Research also shows high willingness to share and also to reveal personal information on social network sites [20, 22]. Some authors have investigated the relationship between personality traits and use of social media [19, 24, 8] in order to explain frequency of use. According to these studies there are personal traits that correlate with the use of social media. Other studies, such as Wu [25] study social media from a social capital perspective [7, 17]. There seems to be some factors that explain positive emotions to social networks sites and friends on social networks sites (SNS). Valenzuela et al. [23] found associations between Facebook usage and students' social capital even when taking demographic, socioeconomic and socialization variables into account. Moreover, Gangadharbatla [12] analyzed college students and their social media usage and found that the users' attitude toward SNS was related to their level of Internet selfefficacy, their need to belong, and their collective selfesteem. Ellison, Steinfield and Lampe [9] studied of users of Facebook, and found strong association between use of this social network site and social capital. Their results also indicate that use of Facebook provides greater benefits for users having low self-esteem and low life satisfaction. In a study of motives and use of Facebook, 241 users were asked to describe in their own words how they used Facebook, and what they enjoyed about their use. Factor analysis identified seven unique uses and gratifications: social connection, shared identities, content, social investigation, social network surfing and status updating. User demographics, site visit patterns and
the use of privacy settings were associated with different uses and gratifications [15]. Studies among visually impaired [14, 25] show that being able to use computers and the Internet, give VIs the ability to communicate with others, both individuals and groups of people, and it allows for the development of a sense of community. For some it is also a means to overcoming social isolation. In a study of VIs in Ireland in 2008 [17] , 52% agreed or agreed strongly to the statement “be part of a group of common interest”, and 44% “anticipated making of new friends or linking up with new ones.” The present study seeks to contribute to a more accurate understanding of social media as a tool for VIs by examining empirically various factors and whether or not they can contribute in explaining a better quality of life. Based on this review we formulate two research questions. First, are the motives of using social media among VIs’ related to age? And secondly, which factors or motives are associated with a better life? We adopt a structural equation modeling technique to analyze the inter-relationship between the motives, the factors and the.
90% of the population has access to Internet and 91% have access to a PC. The use of the mobile phone is also high, see the table 1. Table 1 The use of mobile phones Use mobile phone to make calls 15-24 years old 25-39 years old 40-59 years old N=110
Use apps
mobile
48% 40% 39%
The next tables (2-5) show the answer to the question about social media and frequency of use. Table 2 The use of Facebook 15-24 25-39 40-59 N=110
3. Research Methodology and Results 3.1 The sample and sampling procedure For blind and visually impaired, telephone interviews have an advantage to web-based surveys because the skills needed to participate are low, or non-existing. Therefore, telephone interviews were chosen as the datacollection mode. The market research company Synovate was commissioned to do interviews with 150 members of NABP. The NABP has used Synovate to do telephone interviews with their members on several occasions. This means that many of the NABP members knew the name of the market research company in advance. The national IRB organization with the name NSD approved the project, NABP provided Synovate with membership list and the interviews were done in December 2010. This list contained information about age and whether or not a member used Braille or big print. This information was used to draw samples per age group and distributed by degree of vision. This information was used to draw samples per age group representative for the total membership base. The survey has four age-groups; 15-24 years old, 25-39 years old, 40-59 years old, and 60-75 years old. Among the oldest, only 5 of 40 respondents reported that they use social media. Therefore the net sample used in this study is 110, that is, the 150 respondents excluding the age group 60 plus. Of the 110 respondent in the net sample 99 answered that they have access to a PC, that is 90%. In the youngest age group all have access to a PC, 91% in the group 15-39 years old, and 83% of the 40-59 years old. Thus the access seems to be close to the general population. According to national bureau of statistics [27]
100% 98% 94%
Use mphone send textmessages 91% 93% 86%
Daily
Weekly
82% 36% 25%
5% 19% 10%
Monthly 5% 15% 1%
Seldom
Never
0% 4% 3%
5% 21% 26%
Not Rel. 4% 5% 35%
Table 3 The use of Windows Messenger, MSN 15-24 25-39 40-59 N=110
Daily
Weekly
35% 9% 4%
25% 21% 11%
Monthly 0% 0% 3%
Seldom
Never
20% 12% 10%
15% 50% 36%
Not Rel. 5% 8% 35%
Table 4 The use of Twitter 15-24 25-39 40-59 N=110
Daily
Weekly
0% 0% 0%
5% 0% 4%
Monthly % 0% 7%
Seldom
Never
5% 8% 0%
85% 83% 53%
Not Rel. 5% 9% 36%
Table 5 The use of You Tube 15-24 25-39 40-59 N=110
Daily
Weekly
50% 12% 1%
20% 38% 18%
Monthly 10% 12% 2%
Seldom
Never
10% 18% 20%
10% 12% 25%
Not Rel. 5% 9% 35%
The tables 2-5 show that Facebook is by far the most popular social media. There are significant differences between the age groups, and Twitter is used by very few. There are challenges for VIs and table 6 and 7 present the answer to the question about how easy or difficult it is to use social media, and also to use the log on procedure.
Table 6 Use of social media and perceived level of difficulty. 15-24 years old 25-39 years old 40-59 years old N=110
Don’t know / not relevant 5% 10% 43%
Difficult
Easy
29% 28%
95% 62% 30%
Table 7 The use of codes in the log on procedure with social media 15-24 years old 25-39 years old 40-59 years old N=110
Don’t know / not relevant 10% 23% 49%
Difficult
Easy
15% 22%
90% 62% 29%
Also the tables 6 and 7 show that there is a significant difference between the age groups. To summarize this section, Facebook is not the only social network sites used by the VIs, but Facebook is by far the most popular. The youngest age group is similar the age-group in the national population. A national survey shows that 89% among the general Norwegian population between 15-29 years use Facebook weekly or more often [11]. It is not a surprise that VIs due to the impairment experience difficulties with ICT. However, the young VIs seems to have good skills and do not experience the difficulties that the older have. 3.2 Measurements and research model In order to measure the motivation for using social media and how these motives relates to a better life, a set of statements were developed by the authors in co-operation with NABP and based on a literature review. To the best of our knowledge there is no scale or validated measurement for social media and visually impaired, but we build on the Leahy & Broin [16] VI study with six different statements about social media. In our study the motives or factors are named; sharing my emotions, importance of peers, sharing what I think and receiving feedback, good friends and the importance of being online all the time. For each of these five, two statements were used to capture the factor, or the latent construct, the term used in structural equation modeling. These are the ten statements: 1) “I can pour out my feelings when blogging or writing on social media sites” 2) “I like to share from my life to others”, 3 “To me social media is important because I have no or very few friends where I am living”, 4) “Because I am using social media I get in touch with other VIs that I would not have been in contact with if it had not been for social media”, 5) “I look forward to others’ responses”, 6) “I share my views and have a lot of exchanges with my friends on social media”, 7) “I have many friends on social media, for instance Facebook”, 8) “I have good friends on social media” 9) “I enjoy being connected with my friends all
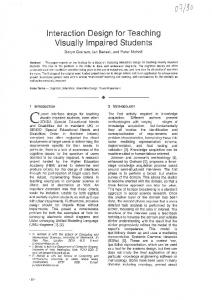
the time and in real time”, and 10) “I use social media frequently.” For these statements we used a 5-point Likert scale. For age we used the three groups as shown in table 1. Moreover, life satisfaction was measured with the statement “Social media gives me a better life” and “Social media is of great value to me”, and a 3-point Likert scale. The research model is presented in the next figure (Figure 1). With the exception of age, which is formative, all indicators are reflective. There are two indicators for each latent construct. They are hidden in the figure, but are presented in table 3.
Emotions
Feedback Age
Better Life Friends
Real Time
Peers
Figure 1 Research Model 3.3 Assessment of Structural modeling Structural modeling can be used to analyze interrelationship among a set of variables. This is useful when the purpose is to identify factors that significantly contribute to explaining a dependent variable. One statistical software package that is often used in Information Systems is partial least squares (PLS). The statistical software package for PLS, SmartPLS [18] is in this study used to analyze the data. PLS is based on iterative ordinary least squares regression. It is a structural equation modeling technique that can examine the psychometric properties of constructs and the relationships between constructs.
Constructs
Items
1
2
3
4
5
6
7
Age Grups
Age
1.00
-0.44
-0.39
-0.44
-0.38
-0.51
-0.43
Emotions
A38E1 A38E2
-0.43 -0.39
0.95 0.95
0.83 0.79
0.84 0.73
0.57 0.57
0.81 0.75
0.75 0.75
Feedback
A38Fe1 A38Fe2
-0.35 -0.39
0.83 0.77
0.93 0.94
0.80 0.92
0.57 0.62
0.81 0.85
0.77 0.78
Friends
A38Fr1 A38Fr2
-0.41 -0.45
0.79 0.81
0.88 0.91
0.97 0.97
0.65 0.66
0.86 0.91
0.80 0.82
Life Satisfaction
A42LS A42LS2
-0.38 -0.30
0.60 0.27
0.64 0.34
0.67 0.35
0.94 0.74
0.64 0.28
0.66 0.30
Real Time
A38R1 A38R2
-0.48 -0.48
0.79. 0.77
0.91 0.78
0.92 0.80
0.63 0.58
0.95 0.94
0.79 0.78
Peers
A38P1 A38P2
-0.45 -0.33
0.62 0.79
0.63 0.84
0.65 0.85
0.55 0.64
0.69 0.79
0.89 0.90
entred on the page like this. Table 8 PLS Confirmatory Please ensure that the surrounding text Factor flows Analysis in this order: 1. Top left column, 2. Bottom left column, 3. Top right column, 4. Bottom right column. If you cannot make the text flow like this, consider moving your oversized figure/table to the top or bottom of the page.
Discriminant validity is suggested if all measurement items load more strongly on their respective construct than on other constructs. The square root of Average Variance Extracted (AVE) of each construct should be higher than the inter-construct correlations, the correlations between that construct and any other constructs [10]. An average variance extracted (AVE) above the recommended 0.5 threshold indicates a satisfactory level of convergent validity. Table 5 and 6 show that the quality criteria are met thus supporting further analysis of the research questions.
There is a set of quality criteria recommended for PLS. The minimum sample size required by PLS is seven to ten times the larger number of paths leading to an endogenous construct. The sample size (N = 110) is adequate for estimating the proposed PLS path model [5]. We assess the convergent validity, reliability and discriminant validity of all latent constructs before testing the research models. Convergent validity is suggested if factor loadings are 0.60 or higher [3] and each item loads significantly on its latent construct [13].
Construct
1 Age
Age Composite reliability: 1 AVE: 1 Cronbach’s Alpha:1
1.
Emotions Composite reliability: 0.91 AVE: 0.95 Cronbach’s Alpha: 0.90
-0.44
0.97
Feedback Composite reliability: 0.93 AVE: 0.87 Cronbach’s Alpha: 0.86
-0.39
0.85
0.93
Friends Composite reliability: 0.97 AVE: 0.94 Cronbach’s Alpha:0.94
-0.44
0.83
0.92
0.97
Life Satisfaction Composite reliability: 0.93 AVE: 0.71 Cronbach’s Alpha: 0.63
-0.40
0.56
0.62
0.65
0.84
Real Time Composite reliability: 0.95 AVE: 0.90 Cronbach’s Alpha: 0.89
-0.51
0.82
0.89
0.91
0.59
0.95
Peers Composite reliability: 0.89 AVE: 0.80 Cronbach’s Alpha: 0.75
-0.43
0.79
0.83
0.83
0.62
0.83
2 Emotion
3 Feedback
4 Friends
5 Life Satisfaction
6 Real Time
7 Peers
0.89
Table 9 Discriminant validity test; composite reliability and convergent validity, correlations entred on the page like this. between latent constructs
Please ensure that the surrounding text flows in this order: 1. Top left column, 2. Bottom left column, 3. Top right column, 4. Bottom right column.
In summary, our measurement model appears to be valid in terms of reliability and convergent and discriminant validity. Then, the essential criterion for the assessment of the model is the coefficient of determination (R 2) of the endogenous latent variables. Chin [4] describes R 2 values of 0.67, 0.33, and 0.19 in PLS path models as substantial, moderate, and weak, respectively.
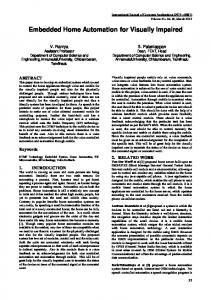
Emotions R2 = 19
-0.394 *
Age
Feedback R2 = 15
-0.443 *
0.007
0.461 *
Friends -0.508 *
3.3 Results The first research question concerns age motivations for using social media. The tables 2-5 show that age is related to who are using social media also for VIs. It is an expected result that age matters. This is in accordance with the findings in the studies cited in the literature review. The structural modeling shows that there are significant age differences related to the importance of the five factors, see figure 2. The negative number in front of the path means that the younger answered more favorably to the statements than the members of the older age groups. The highest explained variance (R–squared) is for the real-time factor. This indicates that it is in particular the young that are concerned with being online on social media in real-time. The second research question regards a better life, not as an objective measure, but measured with statements in a questionnaire. There might be a number of factors associated with a better life. It is a rich concept and better life quality is about much more than what can be achieved with using social media. In his study the respondents were asked about the use of social media and whether or not it has something to do with a better life and not about a better life per se. Within the boundaries of this study, it is possible to get an indication on which factors that matters the most when a better life is chosen as the dependent variable, and all factors are included in the same model. There seems to be a positive effect of using social media on a better life quality. The results indicate that two factors friends and peers contribute to a better life. For the VIs, making friends staying in touch with friends and getting to know other VIs that they would not have meet if it had not been for social media, are motivational factors.
-0.004
-0.435 *
-0.431 *
Better Life R2 = 44
R2 = 20 -0.114
Real Time R2 = 26
0.267 *
Peers R2 = 19
* = significant
N = 110
Figure 2 Significant paths in the Research Model A high variance explained indicate that the model is successful in explain the relationship between the factors. The explained variance (R–squared) in the model is 44. Chin [4] describes this as moderate. Given that many factors, and some not related to new technology, might contribute to life satisfaction, this result can be interpreted as good. In order to make the results from the statistical analysis more readable, we present four tables with crosstabulations of the factors that contribute to life satisfaction. The figures in table 10 should be read as follows: of those that answered agree to “social media gives me a better life”, 100% also answered “I have many friends on social media, for instance Facebook.” Table 10 Crosstabulation Better Life and Friends statement 1 Better Life Disagree Neither/ nor Agree
I have many friends on social media, for instance Facebook Disagree Neither /nor Agree 35% 0% 65% 26% 5% 69% 0% 0% 100%
Table11 Crosstabulation Better Life and Friends statement 2 I have good friends on social media Better Life Disagree Neither - nor Agree
Disagree 19% 3% 5%
Neither /nor 8% 7% 3%
Agree 65% 90% 92%
Table 12 Crosstabulation Better Life and Peers statement 1
Better Life Disagree Neither - nor Agree
Because I am using social media I get in touch with other VIs that I would not have been in contact with if I had not been for social media Disagree Neither /nor Agree 47% 2% 52% 26% 11% 64% 4% 13% 83%
Table 11 Crosstabulation Better Life and Peers statement 2 Better Life Disagree Neither - nor Agree
To me social media is important because I have no or very few friends where I am living Disagree Neither /nor Agree 92% 8% 0% 85% 0% 15% 65% 0% 35%
When someone agreed on one of these questions it is likely that the person also agrees on the other question, or disagreed and disagreed.
4. Conclusion This study was done in cooperation with the NABP. This is important for several reasons. First of all it made it possible to survey a national representative group of VIs. Not all answered the phone-call from the market research company and wanted to participate. This is always the case with telephone surveys, but to a lesser degree because of the cooperation with NABP. Secondly, in designing the survey NABP gave valuable input and suggestions, and made sure that the questions were relevant. The statistical analysis has little value if the research design is weak and the content of study lacks ecological validity. We believe that the findings touch upon something of particular relevance for VIs. For some of them, social media¨ means new friends, and friends that are similar to themselves. While the Irish study by Leahy & Broin [16] is based on a self-selection sampling, this study used random sampling based on best available sampling frame made the NABP. Hence, the findings are representative and give information of the national VI population. An important aspect for VIs is the possibility to participate in the same arenas as others. The youngest seems to do well, but in the age group 40-59 years old nearly 50% of the user answers that social media is difficult to use (tables 6 and 7). It indicates that many visually impaired people are willing to stretch far in order to be able to participate in the same arenas as sighted people. The fact that many use mobile apps is in this context worth mentioning. The mobile version m.Facebook is recommended by Facebook as “the accessible version. Therefore, it is quite possible that some VIs prefer m-Facebook through their mobile or PC to the main site facebook.com. Social media is by default about social interaction. Friendship is therefor important. The contribution of this study is, with structural modeling, to show the relationship between the factors for VIs and a better life. Finally, we have a cautionary comment. It is easy to answer a survey and some of the respondent might exaggerate or give a socially accepted answer. Observations and a research design that include actual use of social media in combination with interview might give deeper insight in the phenomenon. Acknowledgement
The work with this paper was partly financed by the Norwegian research council through the EVIIS project lead by Include-All, and data-collection was done as part of the project “Include the Visually Impaired in the Social Web” (IVIS) financed by NordForsk.
References [1] Y. Amichai-Hamburger, & E. Ben-Artzi, Loneliness and Internet use. Computers in Human Behavior, 19, 71– 80, 2003 [2] Y. Amichai-Hamburger, & Z. Hayat. "The impact of the Internet on the social lives of users: A representative sample from 13 countries." Computers in Human Behavior 27(1): 585-589, 2011 [3] R. P. Bagozzi, & Y. Yi, On the evaluation of structural equation models, Journal of the Academy of Marketing Science, Vol. 16 No. 1, 1988, 74-94 [4] W. W. Chin, The partial least squares approach to structural equation modeling. In GA Marcoulides (Ed.), Modern methods for business research: 295-358: Mahwah. 1998. [5] W. W. Chin, B. L., Marcolin, & P. R. Newsted, A Partial Least Squares Latent Variables Modeling Approach for Measuring Interaction Effects: Results from a Monte Carlo Simulation Study and an Electronic-Mail Emotion/Adoption Study. Information Systems Research (14:2) 2003, pp. 189-217 [6] J. Cohen, Statistical Power Analysis for the Behavioral Sciences (second edition), New Jersey: Lawrence Erlbaum. 1988 [7] J. S. Coleman, Social capital in the creation of human capital. American Journal of Sociology, 94, 1988.95-120 [8] T. Correa, Who interacts on the web 2010 Computers in Human Behavior 26, 2010, 247–253 [9] N. B. Ellison, C. Steinfield, C. Lampe, The benefits of facebook friends: social capital and college students use of online social network sites. Journal of ComputerMediated Communication, 12(4) 2007,1143–1168, [10] C. Fornell, & D. F. Larcker. Evaluating structural equation models with unobservable variables and measurement error, Journal of Marketing Research 18 (1), 1981. 39–50. [11] E. Fossbakken, Facebook-rekord i Norge (Eng: Facebook-record in Norway)." Kampanje Retrieved 22. January, 2011, from http://www.kampanje.com/medier/article5450029.ece [12] H. Gangadharbatla, Facebook me: collective selfesteem, need to belong, and internet self-efficacy as
predictors of the iGeneration's attitudes toward social networking sites Journal of Interactive Advertising, Vol 8 No 2, Spring 2008, 5-15. [13] D. Gefen, & D. Straub, A practical guide to factorial validity using PLS-Graph: Tutorial and annotated example Communications of the AIS, Vol. 16 No. 5, 2005, 91-109. [14] E. Gerber, The Benefits of and Barriers to Computer Use for Individuals Who Are Visually Impaired. Journal of Visual Impairment & Blindness, 97(9), 2003, [15] A. Joinson, Looking at, looking up or keeping up with people? Motives and use of Facebook. In Proceeding CHI '08 Proceeding of the twenty-sixth annual SIGCHI conference on Human factors in computing systems, 2008 [16] D. Leahy, U. O. Broin, Social Networking Sites and Equal Opportunity: The Impact of Accessibility, Proceedings 22nd Bled Conference, 2009 [17] R. D. Putnam, Bowling alone: The collapse and revival of American community. New York: Simon and Schuster 2000. [18] C. M., Ringle, S., Wende, & A. Will, SmartPLS2.0M3. Available at http://www.smartpls.de 2005. [19] C. Ross, E. S. Orr, M. Sisic, J. M. Arseneault, M. G. Simmering, R. R. Orr, Personality and motivations associated with Facebook use, Computers in Human Behavior, 25(2), 2009, 578–586 [20] F. Stutzman, An Evaluation of Identity-Sharing Behavior in Social Network Communities, Journal of the International Digital Media and Arts Association, 3 (1), 2006, 10-18. [21] M. Tollefsen, Ø. Dahle, M. Berg, & R.Nordby. Connected! A paper about the disabled and the use of social media. Project document, accessed January 6. 2011. http://medialt.no/dokumenter/956.aspx [22] Z. Tufekci, Can You See Me Now? Audience and Disclosure Regulation in Online Social Network Sites, Bulletin of Science, Technology & Society, 28 (1), 2008, 20-36. [23] S. Valenzuela, Namsu Park; Kerk F. Kee, Is There Social Capital in a Social Network Site? Facebook Use and College Students' Life Satisfaction, Trust, and Participation, Journal of Computer-Mediated Communication Volume 14, Issue 4, July 2009, 875–901, [24] J. Zywica, J., J. Danowski, The faces of Facebookers: Investigating social enhancement and social compensation
hypotheses. Journal of ComputerCommunication, 14(1), 2008, 1–34.
Mediated
[25] F. Winberg. Contextualizing accessibility: Interaction for blind computer users, PhD Thesis, (Human-Computer Interaction, KTH, Kungliga Tekniska högskolan, Stockholm, 2008 (p.109). [26] Y. Wu, S. Ryan, & J. Windsor, Influence of Social Context and Affect on Individuals’ Implemenation of Information Security Safeguards, ICIS Proceedings. Paper 70, 2009 [27] Statistics Norway, http://www.ssb.no/ikt/