The concept of acoustic feature conversion has been previ- ously used in robust automatic speech recognition (ASR) [11] and voice conversion (VC) [12].
ACOUSTIC FEATURE CONVERSION USING A POLYNOMIAL BASED FEATURE TRANSFERRING ALGORITHM Syu-Siang Wang1 , Payton Lin2 , Dau-Cheng Lyu3 , Yu Tsao2 , Hsin-Te Hwang4 , Borching Su1 , Hsin-Min Wang4 1
2
Graduate Institute of Communication Engineering, National Taiwan University, Taiwan Research Center for Information Technology Innovation, Academia Sinica, Taipei, Taiwan 3 ASUSTeK Computer Inc., Taiwan 4 Institute of Information Science, Academia Sinica, Taipei, Taiwan Abstract
This study proposes a polynomial based feature transferring (PFT) algorithm for acoustic feature conversion. The PFT process consists of estimation and conversion phases. The estimation phase aims to compute a polynomial based transfer function using only a small set of parallel source and target features. With the estimated transfer function, the conversion phase converts large sets of source features to target ones. This study evaluates the proposed PFT algorithm using a robust automatic speech recognition (ASR) task on the Aurora-2 database. The source features were MFCCs with cepstral mean and variance normalization (CMVN), and the target features were advanced front end features (AFE). Compared to CMVN, AFE provides better robust speech recognition performance but requires more complicated and expensive cost for feature extraction. By PFT, we intend to use a simple transfer function to obtain AFE-like acoustic features from the source CMVN features. Experimental results on Aurora-2 demonstrate that the PFT generated AFE-like features that can notably improve the CMVN performance and approach results achieved by AFE. Furthermore, the recognition accuracy of PFT was better than that of histogram equalization (HEQ) and polynomial based histogram equalization (PHEQ). The results confirm the effectiveness of PFT with just a few sets of parallel features. Index Terms: acoustic feature conversion, feature transformation, robust feature extraction, robust speech recognition.
1. INTRODUCTION In recent years, advances in acoustic event [1, 2], music [3–5], and speech [6, 7] recognition have led to a wide range of mainstream applications. For these applications, feature extraction schemes play a critical role for optimizing performance. Suitable acoustic features should be representative of audio signals and robust to distortions caused by environments or acoustic devices [8–10]. For previous feature extraction techniques, high performance can be achieved, but often at high computational cost or requiring authorization. Therefore, we propose a PFT algorithm to enable ASR deployment with limited resources while allowing flexible conversion between different types of acoustic features. Using the PFT algorithm, higher quality acoustic features can be obtained from standard features without a complex feature extraction procedure. The concept of acoustic feature conversion has been previously used in robust automatic speech recognition (ASR) [11] and voice conversion (VC) [12]. For robust ASR, a class of
approaches design a model to characterize the mismatch between the training and testing speech features. The model is computed based on some optimality criterion and is used to compensate testing features for handling the mismatch to thus improve recognition accuracy. Notable examples include the codeword dependent cepstral normalization (CDCN) algorithm [13], cepstral mean and variance normalization (CMVN) [14], histogram equalization (HEQ) [15], polynomial-fit histogram equalization (PHEQ) [16] and the stereo-based piecewise linear compensation environments (SPLICE) technique [17]. Similarly, feature-space maximum likelihood linear regression (fMLLR) [18] and feature space minimum phone error (fMPE) [19] calculate transformations to compensate noisy features based on the maximum likelihood (ML) and MPE criteria, respectively. VC is another successful application of acoustic feature conversion. The goal of VC is to transform a source speaker’s voice to that of a specific target speaker [12, 20, 21]. Gaussian mixture model (GMM) are widely used to model the conversion of two speakers. The mapping process is performed by the minimum mean-square error (MMSE) [20], maximum likelihood (ML) [21], or maximum mutually information (MMI) [22] criteria. The PFT algorithm provides two distinct features that are different from the previous acoustic feature conversion approaches. First, PFT does not assume a model, such as codebook, GMM, or HMM, but rather designs a polynomial based transfer function to directly convert the source features to target ones. Second, the goal of PFT is to convert different types of acoustic features, such as from Mel-frequency cepstral coefficients (MFCC) to advanced front end features (AFE) [23] or to an even more complex feature type. A direct extraction of large amounts of exquisite acoustic features can require high computational cost and may not be accessible for ASR systems with limited resources. Therefore, PFT provides a feasible solution to overcome these limitations. The PFT process consists of estimation and conversion phases. The estimation phase first prepares the same speech utterance but with a small set of parallel source and target features generated from two distinct feature extraction algorithms. Then, a polynomial based transfer function is estimated by the parallel feature set using the mean square error (MSE) criterion. In the conversion phase, large sets of source features are converted to target ones using the estimated transfer function. To evaluate the proposed PFT algorithm, we conducted a robust speech recognition experiment using the Aurora-2 database [24, 25]. In our experiment, MFCC-based CMVN feature is ap-
plied as the source feature and AFE as the target feature. The polynomial based transfer function is estimated using a small set of parallel CMVN and AFE features. With the estimated transfer function, a large set of CMVN features are further converted into AFE-like features. Recognition results show that the PFT generated AFE-like features can notably improve the CMVN performance and approach results achieved by AFE. The recognition accuracy of PFT performed better than other methods for feature transfer such as HEQ and PHEQ. The remaining sections are arranged as follows. Section 2 briefly introduces conventional HEQ and PHEQ algorithms. The details of the proposed PFT is shown in section 3. Experimental results and analyses are listed in section 4. Section 5 shows our conclusions.
(1) Estimation Phase Source Feature
SE
Source Feature
SC
Transfer Function Estimation
Acoustic Feature Conversion
Target Feature
TE
Target Feature
TC
(2) Conversion Phase
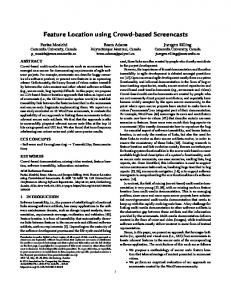
Figure 1: The overall procedure of the proposed PFT framework.
3. POLYNOMIAL BASED FEATURE TRANSFERRING
2. HISTROGRAM BASED EQUALIZATION In this section, the HEQ and PHEQ are introduced. HEQ is constructed by a mapping function and proved to have better performance with a simple table lookup algorithm. However, the table lookup algorithm uses a large amount of volume to preserve all the parameters. Therefore, PHEQ is proposed to solve this issue. By applying polynomial function to approximate the mapping function, the PHEQ can efficiently save the parameter number and volume. The following subsections will briefly introduce the HEQ and PHEQ algorithms.
The overall PFT framework is illustrated in figure 1, which consists of estimation and conversion phases. In the estimation phase, we prepare a small set of parallel source (SE in figure 1) and target (TE in figure 1) acoustic features. By using this set of parallel features, a polynomial based transfer functions is estimated. In the conversion phase, we convert the source feature set, SC , to target features, TC , using the estimated transfer function. In what follows, we introduce the two phases of PFT in more detail. 3.1. Estimation Phase
2.1. Histrogram Equalization The HEQ technique normalizes the probability distribution function (PDF) of both training and testing acoustic features into a common referenced distribution. The referenced PDF can be obtained from the target feature or any other well-defined PDF such as normal distribution. By viewing a source feature sequence s = {s | s ∈ s1 , s2 , · · · , sN }, where N is the total frame number, as a random variable S with PDF FS (s), the HEQ applies the mapping function in eq. (1) to transfer the source feature sequence to the referenced/target speech feature {t1 , t2 , · · · , tN } through the referenced PDF Fref (·). −1 (FS (s)), 1 ≤ i ≤ N. ti = Fref
(1)
2.2. Polyminal-Fit Histrogram Equalization Based on HEQ, PHEQ applies a polynomial function with degree-R to approximate the mapping function. −1 ti = Fref (FS (s))
= a0 s0 + a1 s1 + · · · + aR sR =
R X r=1
1 ≤ i ≤ N,
s ∈ s1 , s2 , · · · , sN ,
R X
i=1
r=1
(ti −
argmin{ a
ar sr )2 }
(4)
However, an issue arises that must be handled in advance: the lengths of the two feature sequences may be unequal (NS 6= NT in eq. (4)). To handle this issue, we adopt the dynamic time warping (DTW) while assuming that the feature pairs {SE , TE } and {SC , TC } have similar acoustic structures.
The DTW technique is applied to align the frame length of two features, SE and TE . {S˜E , T˜E } = DT W (SE , TE ),
where a = {a0 , a1 , · · · , aR } are coefficients for a polynomial function. The coefficients of a polynomial function can be derived by minimizing mean square error (MMSE) algorithm as show in eq. (3). N X
TE,d = Φd (SE,d ), d = 1, 2, · · · , D.
3.1.1. Dynamic time warping (2)
ar sr ,
As shown in figure 1, the estimation phase first prepares a pair of source and target feature sets extracted from the same speech utterances with two distinct feature extraction algorithms. We will refer to the set of paired source and target features as the estimation data set in the PFT framework. Then, the source and target feature sets are concatenated into two large matrices, SE ∈ RNS ×D and TE ∈ RNT ×D , respectively, where NS and NT are the total frame numbers for SE and TE ; and D is the dimension of each feature vector. For the d-th dimension in SE and TE , we have two long vectors SE,d ∈ RNS ×1 and TE,d ∈ RNT ×1 . Then, we applied SE,d and TE,d to estimate a transfer function, Φd (·), such that
(3)
(5)
where S˜E ∈ RNW ×D and T˜E ∈ RNW ×D are matrices of length-normalized source and target features, both containing NW feature frames. Based on the eqs. (4) and (5), we have T˜E,d = Φd (S˜E,d ),
(6)
where S˜E,d ∈ RNW ×1 and T˜E,d ∈ RNW ×1 , and S˜E,d and T˜E,d are the d-th column of S˜E and T˜E , respectively.
3.1.2. Transfer function estimation
4.1. Experimental Setup
The transfer function, Φd (·), can be modelled by any particular parametric function, either linear or non-linear. In this study, a polynomial function with the parameters set Pd = [ϕd,0 ϕd,1 · · · ϕd,R ]0 is adopted for the transfer function Φd (·). Then, eq. (6) can be represented as
Aurora-2 is a standard noise-robust speech recognition task. The original clean speech material in the Aurora-2 database was acquired from the TIDIGITs corpus [27]. Noisy training data was generated by artificially adding noise instances into the clean data. There are three test sets in Aurora-2: Sets A, B, and C. Noisy speech data in Set A and Set B were contaminated by eight distinct additive noises, and noisy speech data in Set C were distorted by two additive noises with additional channel interference. The noise instances were added to the clean speech at six SNR levels (-5 dB, 0 dB, 5 dB, 10 dB, 15 dB, and 20 dB). Finally, there are 70 specific test conditions. Two training sets were provided by Aurora-2: clean- and multi- condition training sets. The clean-condition training set includes 8,440 clean speech utterances, and the multi-condition training set includes the same 8,440 utterances artificially contaminated by the same four types of noise as those used in Set A, at 5 dB, 10 dB, 15 dB, and 20 dB, along with the clean speech data. In this paper, the multi-condition training set along with a complex back-end model topology [28] suggested in [29] was adopted to train acoustic models. The acoustic models include 11 whole word digit models with silence and short pause models. Each digit model was characterized by 16 states, with 20 Gaussian mixture components per state. Silence and short pause models are characterized by three and one states, respectively, both with 36 Gaussian mixture components per state. In the experiment, we designed the CMVN features based on MFCCs (denoted as CMVN for simplicity) as the source feature and AFE as the target feature. Previous studies have reported that AFE provides high-level recognition performance, with notably better performance than CMVN in Aurora-2 [22,24]. This study intends to verify the effectiveness of PFT by converting CMVN features to AFE ones. First, we prepared a set of training data consisting of parallel CMVN and AFE features generated from the same utterances. Then, we extracted the CMVN features for the entire training and testing sets in Aurora-2. By estimating a polynomial-based transfer function, CMVN features for both training and testing sets were converted to generate AFE-like features. Furthermore, the same utterances were applied to the HEQ technique as the sample set of a random variable with referenced PDF. Next, the referenced PDF is applied to both training and testing sets to retrieve the HEQ-based AFE-like features. Both PFT and HEQ generated AFE-like features corresponding to training and testing sets, respectively, and were then used to train acoustic models and test recognition. Finally, utterances, which were prepared for the parallel CMVN and AFE features were collected by a random selection from the training sets that evenly covered the four noise types, four SNRs plus clean condition, and two genders. The DTW introduced in Sections 3 was implemented. For both CMVN and AFE, each feature vector contains 39 components including 13 dimensional statistic features, and their first- and second-order dynamic features.
T˜E,d = Φd (S˜E,d ) = QS,d ˜ Pd ,
(7)
where QS,d = ˜ (˜ sE,d [1])0 . .. sE,d [nW ])0 (˜ .. . (˜ sE,d [NW ])0
(˜ sE,d [1])r . .. (˜ sE,d [nW ])r .. . (˜ sE,d [NW ])r
··· ··· ···
··· ··· ···
(˜ sE,d [1])R . .. (˜ sE,d [nW ])R .. . (˜ sE,d [NW ])R
,
R represents the degree of the polynomial function, and s˜E,d [nW ] represents an element belonging to the d-th dimension and nW -th frame of the S˜E feature. To estimate the parameter set Pd in eq. (7), the entire set of parallel source and target estimation data is used by minimizing the sum of squared error. The objective function is shown in eq. (8). ˜ 2 P˜d = arg m in{||T˜E,d − QS,d ˜ Pd || } ˜d P
(8)
The solution of eq. (8) is provided in eq. (9): −1 0 ˜ P˜d = (Q0S,d QS,d ˜ ) ˜ QS,d ˜ TE,d ,
(9)
where the superscript, 0 , represents the transpose operation and (·)−1 is an inverse operation of the matrix. More details about the MSE for a polynomial function Φd (·) can be found in [16, 26]. 3.2. Conversion Phase As demonstrated in figure 1, the conversion phase of PFT converts the source features to form the target-like ones. We call the source features in this phase the conversion data set in the PFT framework. To perform conversion, we first concatenate the entire set of conversion data into SC ∈ RNC ×D , where NC is the total frame number. The Φd (·) in eq. (6) is then applied for feature conversion. For the d-th row in SC , we have SC,d ∈ RNC ×1 . Then the estimated Φd (·) (from eq. (6)), is used to perform conversion by TC,d = Φd (SC,d ), d = 1, · · · , D (10) where TC,d , d = 1, · · · , D denotes the converted target features. Based on TC,d , we obtain the converted features TC ∈ RNC ×D .
4. EXPERIMENTS This section introduces the experimental setup and results. A robust ASR experiment was conducted on Aurora-2 to evaluate the proposed PFT algorithm. Word error rate (WER) is used to evaluate the performance. Lower WER represents a better recognition result.
4.2. Experimental Results and Analysis We first applied 40 utterances as the estimation set for PFT and show the recognition results under different polynomial degrees in figure 2. Each WER result in figure 2 represents the average result over test Sets A, B, and C over 0- to 20 dB SNRs in Aurora-2. Several degrees of the polynomial function (P˜d in eq. (6)) were evaluated. From figure 2, the WER result using degree 3 was optimal while degree 5 produced similar perfor-
mance. However, WER increased when a higher degree was used, suggesting that using too many parameters in the polynomial functions can cause over-fitting. Based on figure 2, we select the polynomial function of degree 3 for the PFT technique in the following experiments. 7.78
WER(%)
7.7 7.3
7.21
7.10
6.86
6.9
6.92
6.5 1
3
5
7
the CMVN features of all Aurora-2 training and testing sets into AFE-like features, and then these features were used to obtain the recognition results. Four different polynomial functions are obtained, so therefore four distinct recognition results are generated. In addition, each of the selected utterances were used to extract the AFE features. Similar to PFT, the parallel CMVN and AFE features extracted from the selected utterances were used to get the polynomial function for PHEQ and referenced distribution for HEQ; then, the polynomial function and the referenced distribution were applied to obtain the PHEQ-based and HEQ-based AFE-like features, respectively. The recognized results for all algorithms and utterance sets are shown in figure 3. The recognized results for the three algorithms and utterance sets are shown in figure
9
Degree
HEQ
Table 1: WER (%) for various test Sets in Aurora-2 Set Set A Set B Set C Avg. CMVN 6.87 7.50 7.31 7.21 PFT 6.64 7.13 6.73 6.86 AFE 5.86 6.65 7.06 6.42
From Table 1, The PFT process provides better results than CMVN for three test sets, with a significant 4.85% WER reduction (from 7.21% to 6.86%). The results indicates that the robustness of the PFT-generated features is notably improved. Moreover, if we consider the AFE result to be the performance upper bound, the improvement by PFT is 44.30% (from 0.79 to 0.44), where 0.79 = 7.21 − 6.42 (CMVN to AFE) and 0.44 = 6.86 − 6.42 (PFT to AFE). The result confirms the effectiveness of PFT on feature conversion to robust ASR. Furthermore Table 1 shows PFT outperforms AFE in Set C. The result suggest the mean and variance normalization in CMVN can effectively handle the channel interferences so that the advantages of source features may be retained in the PFT converted features. Future studies will be conducted to investigate this direction further. Recognition results of the proposed PFT were also compared with those of HEQ and PHEQ, since these methods are also based on designing mapping functions. For HEQ, PHEQ and PFT, various utterances (40, 80, 180 and 8440 (denoted as “All” in the following description)) randomly selected from noisy training set in Aurora-2 are provided to obtain the polynomial functions for PHEQ and PFT, and referenced distribution for HEQ. To compute the PFT transfer function, parallel CMVN and AFE features extracted from each selected utterances were used for estimating polynomial coefficients of a polynomial function. The polynomial function is further applied to transfer
WER(%)
Figure 2: WER (%) of PFT using various polynomial degrees. Table 1 shows the detailed WER results on the three test sets obtained using the PFT-converted features. The number of parallel training utterances was 40. The PFT process was performed by using a polynomial of degree 3. In addition, the results achieved using the original CMVN and AFE features are also listed for comparison. The results of Sets A, B, C, and overall (denoted as Avg.), over 0- to 20 dB SNRs are shown in Table 1. In addition, the recognition results of CMVN and AFE is also listed to consider lower and higher bounds, respectively.
PHEQ
PFT
7.30 7.10 6.90 6.70 40
80
180
All
Utterances
Figure 3: WER (%) of PFT using several estimation utterances. Figure 3 shows the performance of PFT was better than both HEQ and PHEQ under all different developing sets. In addition, the recognition results of HEQ were all better than those of PHEQ, implying that the polynomial function of degree 3 used by PHEQ can only provide a rough approximation of the mapping function used by HEQ. The results of PFT, PHEQ and HEQ algorithms show consistent performance under various estimation set. According to the figure, PFT, PHEQ and HEQ algorithms can be operated with less estimation utterances.
5. CONCLUSION This study proposes the PFT algorithm for acoustic feature conversion via a polynomial based transfer function obtained by MMSE. Results showed the degree of the polynomial function could be optimized for robust speech recognition on the Aurora2 task. The PFT converted features achieved better recognition results compared to CMVN and was able to approach AFE performance using only a few parallel training utterances. Furthermore, PFT outperformed AFE on test sets with channel interference, suggesting the advantages of CMVN features can be retained in order to reduce channel distortions. With just a few estimation utterances, PFT outperformed other methods based on designing mapping functions such as HEQ and PHEQ. The PFT algorithm can also be used with other transfer functions, optimality criterion, or even classification methods to transfer features more precisely. Due to the simple and flexible feature conversion of the PFT algorithm, alternative pairs of acoustic feature types can be applied in addition to CMVN and AFE in future studies.
6. Acknowledgements This study was partially supported by Project 103-EC-17-A24-0617 conducted by ITRI under the sponsorship of Taiwan’s Ministry of Economic Affairs.
7. References [1]
[2]
[3]
[4]
Zhuang X., Zhou X., Hasegawa-Johnson M. A., and Huang T. S., “Real-world acoustic event detection”, Pattern Recognition Letters, 31(12):1543–1551, 2010. Chu S., Narayanan S., and Kuo C.-C., “Environmental sound recognition with time-frequency audio features”, IEEE Trans. Audio, Speech, and Language Processing, 17(6):1142–1158, 2009. Tzanetakis G. and Cook P., “Musical genre classification of audio signals”, IEEE Trans. Speech and Audio Processing, 10(5):293–302, 2002 Scaringella N., Zoia G., and Mlynek D., “Automatic genre classification of music content: a survey”, IEEE Trans. Signal Processing Magazine, 23(2):133–141, 2006
[5]
Pouyanfar S. and Sameti H., “Music emotion recognition using two level classification”, in Proc. ICIS, 1–6, 2014
[6]
Huang X., Acero A., and Hon H.-W., “Spoken Language Processing: A Guide to Theory, Algorithm and System Development”, Prentice Hall PTR, 2001
[7]
Lee C.-h., Li H., Lee L.-S., Wang R.-H., and Huo Q., “Advances in Chinese spoken language processing”, World Scientific Publishing Co., Inc., 2006
[8]
Hasan T. and Hansen J. H. L., “Acoustic factor analysis for robust speaker verification”, IEEE Trans. Audio, Speech and Language Processing, 21(4):842–853, 2013.
[9]
Pardede H. F., Iwano K., and Shinoda K., “Feature normalization based on non-extensive statistics for speech recognition”, Speech Communication, 55(5):587–599, 2013.
[10] Suzuki M., Yoshioka T., Watanabe S., Minematsu N., and Hirose K., “Mfcc enhancement using joint corrupted and noise feature space for highly non-stationary noise environments”, in Proc. ICASSP, 4109–4112, 2012. [11] Li J., Deng L., Gong Y., and Haeb-Umbach R., “An overview of noise-robust automatic speech recognition”, IEEE Trans. Audio, Speech, and Language Processing, 22(4):745–777, 2014. [12] Stylianou Y., Capp´e O., and Moulines E., “Continuous probabilistic transform for voice conversion”, IEEE Trans. Speech and Audio Processing, 6(2):131–142, 1998. [13] Acero A., “Acoustical and environmental robustness in automatic speech recognition”, Springer, 1993. [14] Tibrewala S. and Hermansky H., “Multi-band and adaptation approaches to robust speech recognition”, in Proc. Eurospeech Communication and Technology, 2619–2622, 1997. [15] Hilger F. and Ney H., “Quantile based histogram equalization for noise robust large vocabulary speech recognition”, IEEE Trans. Audio, Speech, and Language Processing, 14(3):845–854, 2006. [16] Lin S.-H., Yeh Y.-M., and Chen B., “Exploiting polynomial-fit histogram equalization and temporal average for robust speech recognition”, in Proc. INTERSPEECH, 2522–2524, 2006. [17] Deng L., Droppo J., and Acero A., “Recursive estimation of nonstationary noise using iterative stochastic approximation for robust speech recognition”, IEEE Trans. Speech and Audio Processing, 11(6):568–580, 2003.
[18] Gales M. J., ”Maximum likelihood linear transformations for hmm-based speech recognition”, Computer speech and language, 12(2):75–98, 1998. [19] Povey D., Kingsbury B., Mangu L., Saon G., Soltau H., and Zweig G., “fmpe: Discriminatively trained features for speech recognition”, in Proc. ICASSP, 961–964, 2005. [20] Kain A. and Macon M.W., “Spectral voice conversion for text-to-speech synthesis”, in Proc. ICASSP, 285–288, 1998. [21] Toda T., Black A. W., and Tokuda K., “Voice conversion based on maximum-likelihood estimation of spectral parameter trajectory”, IEEE Trans. Audio, Speech, and Language Processing, 15(8):2222–2235, 2007. [22] Hwang H.-T., Tsao Y., Wang H.-M., Wang Y.-R., and Chen S.-H., “A study of mutual information for gmmbased spectral conversion”, in Proc. INTERSPEECH, 2012. [23] Standard E., “Speech processing, transmission and quality aspects (stq); distributed speech recognition; advanced front-end feature extraction algorithm; compression algorithms”, ETSI ES, 202(50):v1, 2007. [24] Macho D., Mauuary L., NoE` B., Cheng Y. M., Ealey D., Jouvet D., Kelleher H., Pearce D., and Saadoun F., “Evaluation of a noise-robust dsr front-end on aurora databases”, in Proc. INTERSPEECH, 17–20, 2002. [25] Hirsch H.-G. and Pearce D., “The aurora experimental framework for the performance evaluation of speech recognition systems under noisy conditions”, in ASR2000-Automatic Speech Recognition: Challenges for the new Millenium ISCA Tutorial and Research Workshop, 2000. ˚ “Numerical methods for least squares prob[26] Bj¨orck A., lems”, Siam, 1996. [27] Leonard R., “A database for speaker-independent digit recognition”, in Proc. ICASSP, 328331, 1984. [28] Young S., Evermann G., Gales M., Hain T., Kershaw D., Moore G., Odell J., Ollason D., Povey D., Valtchev V., and Woodland P., “The HTK Book (for HTK Version 3.3)”, Cambridge University Engineering Department, 2005. [29] Wu J. and Huo Q., “Several hku approaches for robust speech recognition and their evaluation on aurora connected digit recognition tasks”, in Proc. INTERSPEECH, 21–24 2003.