Feature Location using Crowd-based Screencasts Parisa Moslehi
Bram Adams
Juergen Rilling
Concordia University, Canada
[email protected]
Polytechnique Montreal, Canada
[email protected]
Concordia University, Canada
[email protected]
ABSTRACT
used, these links are often created by people who directly contribute to the project development. However, the importance of formal documentation and therefore traceability in agile development is debated amongst practitioners [12]. Open source and agile development mostly focus on system functionality and informal documentation in the form of bug or issue tracking repositories, emails, source control repositories and crowd-based mult-imedia documents (e.g., screencasts and videos). Crowd-based multi-media documents are created by people who are not necessarily direct project contributors, and especially have become widely accepted by the open source community, to the point where open source projects have started to make how-to videos (“screencasts”) an integrated part of their documentation. For example, WordPress [46] encourages its users and contributors to create new how-to videos [47] that describe certain use-case scenarios or features. Some users even enrich their bug reports via a screencast [8] to exactly demonstrate how to reproduce the bug. An essential aspect of software traceability, and hence feature location, is not only the creation of links, but also the need for these links to evolve as their source artifacts evolve, in order to ensure the consistency of these links [22]. Existing research in feature location and link evolution mainly focuses on techniques for locating system functionalities in the source code based on some available high-level description of a system’s functionality, such as source code comments, use-case scenarios, mailing lists, bug reports, etc. Once identified, this information is used to support various maintenance tasks such as, localizing bugs described in bug reports [25, 26], source code navigation [14], or to support software immigrants in comprehending the core functionalities of a software system [14]. In contrast, the field of mining (crowd-based) multi-media documentation is very young [27, 28], with no existing work on feature location from multi-media documentation. This is an emerging problem, since more and more open source projects have substantial crowd-generated multi-media documentation that needs to keep up with the rapidly evolving code base. A key challenge for linking multi-media documentation to other software artifacts is the abstraction gap between those artifacts and the information provided by the screencasts. Multi-media documentation delivers content in the form of voice and video (images), while traditional software artifacts mostly deliver content in some form of textual representation. Hence, in this paper, we present an approach that leverages both audio (i.e., speech) and visual cues (i.e., GUI) from screencasts to locate relevant features in the source code of the corresponding software application. The contributions of this work are as follows:
Crowd-based multi-media documents such as screencasts have emerged as a source for documenting requirements of agile software projects. For example, screencasts can describe buggy scenarios of a software product, or present new features in an upcoming release. Unfortunately, the binary format of videos makes traceability between the video content and other related software artifacts (e.g., source code, bug reports) difficult. In this paper, we propose an LDA-based feature location approach that takes as input a set of screencasts (i.e., the GUI text and/or spoken words) to establish traceability link between the features described in the screencasts and source code fragments implementing them. We report on a case study conducted on 10 WordPress screencasts, to evaluate the applicability of our approach in linking these screencasts to their relevant source code artifacts. We find that the approach is able to successfully pinpoint relevant source code files at the top 10 hits using speech and GUI text. We also found that term frequency rebalancing can reduce noise and yield more precise results.
CCS CONCEPTS • Software and its engineering → Traceability; Documentation;
KEYWORDS Crowd-based documentation, mining video content, feature location, software traceability, information extraction ACM Reference Format: Parisa Moslehi, Bram Adams, and Juergen Rilling. 2018. Feature Location using Crowd-based Screencasts. In MSR ’18: MSR ’18: 15th International Conference on Mining Software Repositories , May 28–29, 2018, Gothenburg, Sweden. ACM, New York, NY, USA, 11 pages. https://doi.org/10.1145/3196398. 3196439
1
INTRODUCTION
Software traceability, i.e., the process of establishing bi-directional links among software artifacts, has many applications in the software maintenance domain, such as change impact analysis, documentation, requirements coverage, verification and validation [40]. Feature location is a form of traceability that automatically discovers links between features in the source code and different software artifacts, such as requirements [2]. Depending on the maturity of the software development process and the life-cycle model being Permission to make digital or hard copies of all or part of this work for personal or classroom use is granted without fee provided that copies are not made or distributed for profit or commercial advantage and that copies bear this notice and the full citation on the first page. Copyrights for components of this work owned by others than ACM must be honored. Abstracting with credit is permitted. To copy otherwise, or republish, to post on servers or to redistribute to lists, requires prior specific permission and/or a fee. Request permissions from
[email protected]. MSR ’18, May 28–29, 2018, Gothenburg, Sweden © 2018 Association for Computing Machinery. ACM ISBN 978-1-4503-5716-6/18/05. . . $15.00 https://doi.org/10.1145/3196398.3196439
• We propose a methodology of source code feature location that takes advantage of content presented in screencast videos. • We perform an empirical evaluation of our approach on screencasts created by the WordPress community. 1
MSR ’18, May 28–29, 2018, Gothenburg, Sweden
P. Moslehi et al.
• We empirically compare the impact of different information sources extracted from screencasts. The rest of the paper is structured as follows. Section 2 lays out the motivation and research questions of our work. Section 3 describes our research methodology, data, and data extraction techniques. Section 4 presents the setup of our case study, followed in Section 5 by answers to our research questions obtained through the case study. Section 6 discusses threats to validity, while Section 7 compares our work with related work. Finally, Section 8 concludes the paper.
2
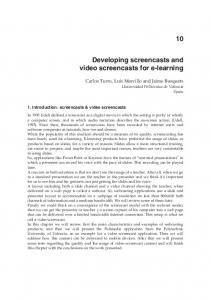
Figure 1: How source code feature location within screencasts helps WordPress users or developers.
MOTIVATION
Popular open source software systems such as Firefox, Eclipse or WordPress, have numerous how-to videos (“screencasts”) available online. For example, screencasts exist that explain how to use a new feature, document an observed bug, or even provide a workaround for a known problem. While such screencasts demonstrate buggy scenarios or workarounds, developers who want to resolve such bugs or integrate the described workarounds into the application still need to manually trace the screencast content to the application’s source code. Our work aims to help developers in tracing such features described in screencast content to source code, by automatically recommending source code files that are related to the implementation of these features. For example, Sara, a new contributor to WordPress, wants to customize WordPress for her own usage, by adding an additional menu option (Figure 1). Since she is still unfamiliar with WordPress, she decides to search on the Internet for screencasts about “how to add menus to WordPress”. While watching a screencast for this scenario, the narrator briefly highlights a WordPress bug related to the feature’s implementation. Sara decides to contribute to the WordPress project by fixing the bug described in the screencast. For her to be able to fix this bug, she first has to locate the source code relevant to the screencast content. While feature location from textual documents such as requirements is an established field [14], such techniques cannot directly be applied to content from screencasts, due to a number of major challenges: The abstraction level: The content of a screencast is typically captured by a narrator who is describing verbally (through speech) and images (by visually demonstrating) the screencast content. As a result, the content representation in a screencast differs significantly from other software artifacts, where content is often captured in structured or semi-structured formats that simplify the linking of content across these structured artifacts. Furthermore, even technical screencasts tend to be at a higher level of abstraction, only sparsely providing low-level implementation details of the demonstrated features. Dynamic vs. Static: Screencasts are dynamic by nature, i.e., every couple of image frames the screen changes as the narrator is manipulating the GUI of the demonstrated software application [37]. In contrast, the source code of the demonstrated version of the software application is static, with feature implementations crosscutting multiple methods, files or even components of a system [20]. This crosscutting makes it inherently difficult to manually identify and link code fragments relevant to the dynamic content of a screencast shown at some point in a screencast.
Information resources: Screencasts can contain different information resources (e.g., images, speech, captions, sequence of GUI events, user actions) [28], which differ significantly from those found in source code (e.g., language-specific syntax, comments, function names, identifiers, file names, string literals). However, the availability and quality of the screencasts’ resources will differ from screencast to screencast.
3
FEATURE LOCATION METHODOLOGY
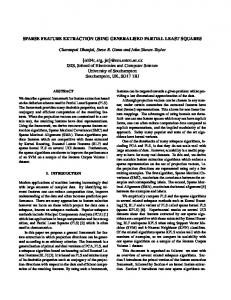
In this section, we present a general overview of our proposed methodology for source code feature location using tutorial screencasts. Given a set of screencasts related to a given feature (use-case scenario), our objective is to locate the source code artifacts executed by it. The proposed methodology (Figure 2) is independent of the underlying application or use-case and includes three main steps. Before outlining each of these steps in more detail, we describe first the datasets involved.
3.1
Data Sets
We use two types of data sets: data extracted from screencasts and source code data. As explained by MacLeod et al. [28], there are various important elements of information inside screencasts. In what follows, we discuss their potential use for feature location: • Speech: Tutorial screencasts often have a narrator who explains each step of a feature (use-case scenario), while demonstrating the feature on screen. Generally, parts of the speech not only will match labels or content in the image frames shown in the screencast but also keywords found in the source code. Figure 3 shows an example of such matching keywords between screencast content (top) and source code (bottom half). • GUI frames: Screencasts capture the GUI interactions with a software application, with each screencast containing a long sequence of images (frames) played at a constant frame rate. Since a typical GUI contains both textual and graphical information, the GUI text on a screencast frame can be matched to corresponding string literals in the source code, unless this content is generated dynamically at run-time (e.g., user input). Furthermore, icons and graphical information such as edges, layout of the visual content and color changes that occur in an image frame can be used as visual information clues to identify what particular parts of a feature the narrator is currently focusing on. 2
Feature Location using Crowd-based Screencasts
MSR ’18, May 28–29, 2018, Gothenburg, Sweden
Figure 2: Methodology for feature location from screencast data. to the screencast. Such metadata provides additional information for linking screencast and source code content. Our second data set corresponds to the source code of the software release exercised in the screencasts. In contrast to the screencast dataset, the textual code information is straightforward to extract from the software’s version control system. Yet, since it mostly contains low-level information such as source code text and comments, the extraction and abstraction of semantic information from the code is inherently difficult. Given this semantic mismatch between the vocabulary used by screencasts and by the source code, one should exploit any source code information hinting at semantics of the developers’ objectives [1, 9, 26, 39], such as: • Source code comments: Comments explain or annotate parts of the source code, usually in higher-level terms than the code itself. • Variables and identifiers: Variable names usually relate to the scenario-related information stored within them. • String literals: Static string literals often appear on GUI widgets. • Method and class names: Developers choose class names and method names closer to the software’s domain. • File names: In the absence of object oriented code, file names are another useful source of information for feature location.
Figure 3: Matching keywords between speech, GUI and source code.
• User actions: The screen shown by a tutorial screencast and the textual, graphical and speech information that it contains dynamically change as a result of the narrator’s actions in the screencast, such as pressing a button, clicking on a menu item or opening another window. These actions make up the different steps of a use-case scenario and often correspond to event handlers and GUI widget labels in the source code. • Sequence of events: The order in which user actions occur in a screencast forms a sequence of events that can provide both essential use-case steps (common across all screencasts of a given scenario) or optional (occurring only in a few screencasts of the scenario). This sequence could correspond to a chain of event handler executions or sometimes a function call graph. • Metadata: When screencasts are uploaded to video portals like YouTube, they are typically provided with a title, description, upload date, comments, number of likes and dislikes, closed captioning (if enabled) and other information related
3.2
Extracting Relevant Text from Source Code and Screencasts
Source Code Preprocessing: For every source code file, we extract the source code elements mentioned above using Exuberant Ctags [18], then further process them by removing noise in the form of special characters, numbers, punctuations and stop words. Finally, we also perform stemming on the remaining tokens. Screencast Preprocessing: Screencasts are composed of an audio component and image frames. In what follows, we describe how we extract the speech and GUI data. 3
MSR ’18, May 28–29, 2018, Gothenburg, Sweden
P. Moslehi et al.
Speech: Tutorial screencasts usually have a narrator who explains the steps involved in performing a certain feature (use-case scenario). For screencasts with closed captioning available, text extraction tools can be used to extract a screencast’s subtitle. For screencasts published without closed captioning, automatic speech recognition tools to transcribe the speech information can be used [33]. Once the transcribed text is available, the same preprocessing steps as for source code can be performed. Image processing and user actions: To extract text from video frames, one needs to first extract key image frames of the screencasts, then extract text fragments from them relevant to the use-case scenario. Such relevant text fragments typically are either found in the image frames or in text/labels associated with them. Given the many frames within a typical video, only those in which a major event happens (e.g., mouse click or button press) should be targeted. Unfortunately, identifying these text fragments and frames is the most challenging data to obtain. We experimented with three different image processing approaches, before settling with a simpler, textual approach. First, we used Template Matching [7], where one should provide a template image of a mouse pointer (both the clicking and neutral version) to be able to automatically locate the mouse pointer in video frames and any mouse actions being performed. We also experimented with image pixel subtraction [34],which subtracts the pixels of neighboring frames to detect changes occurring between image frames, typically caused by mouse movements. Finally, we also used connected components detection [35], which exploits the fact that neighboring pixels typically have similar pixel values to locate different logical areas in the image frames (e.g., a “text field”, or “button”). However, the above image processing approaches have a number of drawbacks, namely large overhead, strong dependence on image quality or resolution, and possible information loss due to image binarization or transformations. For example, if we binarize a colored image, it will be transformed to a black and white image. Areas with light background and white text will vanish. Similarly, the template matching technique fails due to users customizing their mouse pointer as well as due to the mouse pointer hiding the label of the clicked button during the actual clicking motion. Instead, we opted for a simpler, pure textual approach, where we directly perform common Optical Character Recognition (OCR) [11] on each frame to recognize all the text on the frame, then subtract the text (instead of the pixels) of every 2 subsequent image frames: Di f f = T ext(imдi ) − T ext(imдi−1 )
Figure 4: GUI text difference after a user action happens.
Figure 5: Log likelihood values vs. Number of Topics (K).
Dirichlet Allocation (LDA) [6]. This is an unsupervised statistical approach that models semantics of words based on topics. Each latent topic is characterized by a statistical distribution over a bag of words, and documents are represented as random mixtures over these topics. As such, LDA allows to transform each document into vectors of topic probabilities, which are then compared to each other. In our case, documents are either source code files or text files containing information (GUI, speech or both) from a screencast. To use LDA, one needs to first determine the number of topics to be used in the topic modeling process. The smaller the corpus, the fewer topics should be generated [26]. We applied the approach used by Thomas et al. [44], who suggest to use different numbers of topics and evaluate the resulting models based on the topics’ log likelihood values. The optimal number of topics is determined by the point where the log likelihood values start to get diminishing returns (i.e., a “knee” in the corresponding plot), which represents a good balance between topic richness and overspecialized topics (Figure 5). The quality of the topic modeling also depends on the quality of the data used as input. During our initial evaluation of the topic modeling approach, we observed that even after our preprocessing steps, the screencast data still requires additional preprocessing. In particular, in a single screencast document containing GUI, speech or both kinds of data, certain words might be less important yet occur more frequently than a word crucial to the use-case scenario under study. Such frequent words often occur throughout the dataset and not only in a single document. Therefore, one would want to rebalance the occurrences of words within documents. In the specific case of a screencast document containing both GUI and speech data, such rebalancing also helps to avoid that the more voluminous GUI data would dominate the speech data. For this rebalancing, we use a weighting algorithm to modify the frequency of the words in a screencast document. The well-known tf-idf (term frequency-inverse document frequency) [31] approach does not apply in our case, since it weights down frequent terms (in favour of important words that are rare across the whole corpus),
(1)
The OCR returns all the text enclosed within neighboring pixels on the images as a sentence or word along with the coordinates of the words on the images. An advantage of this approach is that it only uses a bag of words during the analysis. For example, if a user clicks on a button, the GUI will change to open a dialog menu or new text field, which will be reflected in the text recovered through OCR. Di f f then contains the bag of words shown on the second image frame (Text(imдi )) but not on the first one (Text(imдi−1 )). Figure 4 illustrates how the above algorithm works.
3.3
Extracting Structured Information from Source Code and Screencast Text
To extract additional semantic structures from the textual source code and screencast data, we apply topic modeling using Latent 4
Feature Location using Crowd-based Screencasts
MSR ’18, May 28–29, 2018, Gothenburg, Sweden
3.4
yet in our case frequent words (e.g., “post”, “menu”, “add” or “new”) often turn out to be good indicators for feature location. Hence, in a preliminary study, applying the tf-idf term weighting on the datasets resulted in poor performance of the approach. Instead, we focused on rank-order weighting approaches [41], which consider the rank of each term in a document according to some ranking formula involving the term frequency of each word. Since LDA works based on the co-occurrence frequency of the words, this way we can increase the chance of documents containing terms relevant to the scenario to appear as top hits. In particular, we use the Rank-Order Centroid (ROC) approach, which is generally considered to be the most accurate [41]. This approach assumes that the weights are uniformly distributed in a way that w r 1 ≥ w r 2 ≥ · · · ≥ w r n , where w r 1 + w r 2 + · · · + w r n = 1 and r i is a rank position of w r i . The weights are calculated using the following formula: n 1Õ 1 Wj = (2) n rk
The methodology of Figure 2 performs feature location using screencasts as queries and source code as corpus. For this, we use the cosine similarity measure [30] to compare the document-topic vector of a screencast with each document-topic vector of the source code corpus obtained in the previous step. Then, the source code vectors are ranked from highest to lowest similarity with the screencast vector. Ideally, the highest ranked vector should correspond to a file most closely related to the screencast’s use-case scenario, and hence be a starting point (seed) for feature location.
4
• RQ1. How accurately can source code files be located from screencasts? • RQ2. What is the optimal balance between GUI and speech data for feature location? • RQ3. Do we need both speech and GUI text to perform feature location?
. . . , where n is the number of unique terms in the whole screencast corpus and rank r j is calculated based on the descending order of the frequency of the terms in the original corpus. Here, the top term has j = 1 and gets more terms in the summation than the last one, where k = n. For instance, imagine the corpus comprises {(menu, 3), (open, 2), (project, 1)}. The word “menu” has the highest term frequency and therefore the highest rank (1), yielding a ROC value of 0.6. The terms of each GUI, speech or GUI/speech document, extracted from each screencast in the corpus will be ranked, in a descending order, based on their term frequencies within the document. We then modify the term frequencies in the documents of each screencast in the dataset using the following formula: 1 ) rj
CASE STUDY SETUP
In this section, we evaluate our feature location methodology to address the following research questions:
k =j
N ew_T F j = round(T F j ×
Source Code Feature Location using Screencasts
4.1
Data Preparation
For our case study, we considered the popular WordPress open source project, for which many screencasts are available on sites like YouTube. Unfortunately, not all of these screencasts are of equally high quality. To have a higher accuracy, we only considered High Definition (HD) videos. Furthermore, our case study requires multiple screencasts on a common scenario, ideally on the same version of WordPress. Hence, to make sure enough screencasts would be available, we performed different queries on YouTube to find the most popular use-case scenarios of WordPress. Then, for each use-case, we searched for the relevant screencasts on YouTube and grouped them by upload year. The upload year with the most HD screencasts relevant to the same use-cases was 2015, which is they year in which WordPress 4.3 was released. We found out that “How to add menus to WordPress” and “How to create a post in WordPress” are the 2 most common use-cases whose videos also meet our criteria. The first scenario considers an administrative task in WordPress in which the user inputs only a limited amount of text, while the second scenario requires the user to enter a substantial amount of text, possibly in another language. Hence, the second scenario provides more noisy data, which is bound to provide a larger challenge for our approach than the first scenario. This will allow us to explore the applicability of the approach on videos with different quality or signal-to-noise ratios. To avoid having unbalanced data, by mixing too long and too short videos in the dataset, we specified a range between 2 to 8 minutes for the duration of the videos. Therefore, maximum number of screencasts that could be found for both use-case scenarios was 5, we downloaded 5 screencasts using the same version of WordPress (version 4.3). Having lengthy videos would lead to having more noise and also would require more resources to be preprocessed. We downloaded version 4.3 of WordPress from the project’s GitHub repository, and used Exuberant Ctags to extract the required source code data. The code base consisted of 554 PHP files, with
(3)
Here, the round() function, rounds off the new value of N ew_T F j to the nearest integer. In our example, N ew_T Fmenu is calculated as round(3 × 11 ) = 3. The idea is that wherever the term “menu” occurs in the text, we repeat it 3 times. Using this approach, the frequency of the important terms increases. At the same time, ROC’s assumption of uniformly distributed weights Wj guarantees that less important (i.e., irrelevant) words will be either way less frequent than the important ones or removed from the document (N ew_T F j = 0). For example, the term “open” obtains a new term frequency value of 1, and “project” obtains 0 (marking it for removal from the document). After determining the number of topics and possible rebalancing of terms within the GUI and/or speech documents, we then train a topic model using the source code corpus, which creates documenttopic vectors from the source code documents. Each element of these vectors corresponds to the probability that a given topic occurs in a document. Then, we use the trained topic model to infer the topics of a new document, in this case the GUI and/or speech text extracted from a screencast (using formula (1) applied on all images of a single screencast). The inferred screencast topics again yield document-topic vectors, this time for the screencast documents. 5
MSR ’18, May 28–29, 2018, Gothenburg, Sweden
P. Moslehi et al.
median size of 162 lines of code (25th/75th percentiles of 52 and 511).
4.2
implementation of the essential steps in a scenario, while files in the All baseline tend to be closer to the high-level implementations of the scenario. Therefore, we consider both baselines in our study. Since feature location aims to find the starting point (seed) in the source code for manual exploration, we use evaluation measures that are able to assess the ability of the approach in retrieving true positives at the top of the result set [23]. In other words, since the goal is not to retrieve all relevant results, we did not consider recall for evaluation purposes, but instead used Average Precision (AP) and Reciprocal Rank (RR): n 1 Õ Precision at k (4) AP = |R|
Applying our Methodology
For this study, we focused on the following screencast data: user actions, the GUI text and the narrator speech. As explained in Section 3.1, the other data elements of screencasts are more challenging to extract and left as future work. Since closed captioning was not enabled for the screencasts in our data set, we used IBM Watson’s speech-to-text service [42] to automatically transcribe the audio part of the screencast. Moslehi et al. manually compared this service against 4 other services or tools, obtaining the highest precision and recall values (0.75 and 0.88 respectively) [33]. Regarding the visual content of the screencasts, we extracted image frames at 1 frame per second rate using FFmpeg [19], yielding 1,561 video frames to be analyzed for the Menu screencasts and 749 for the Post screencasts. We then OCRed the frames to obtain their textual content. To perform OCR, we first explored the Tesseract tool [43] used by Ponzanelli et al. [37]. However, it has a number of limitations, such as the need to improve the quality of images by removing the image background, to keep only the areas with text or to resize the images. Resolving these issues either resulted in data set-specific scripts or substantial manual effort. Instead, we opted for Google Vision API’s Text Recognition service [21]. It does not require these preprocessing steps and is able to recognize and output the text on the images along with the (x,y) coordinates of the area in which the text appears. It also outputs a confidence score with the OCRed text, which can be used to filter out false positives. A nice characteristic of our textual frame diff-ing approach in (1) is that incorrect OCR output might still be discarded if it occurs across all the frames. We used MALLET [29], a popular topic modeling tool, to perform LDA. To determine the best number of topics for the experiments, we split the source code dataset into 90% training and 10% test portion. We used MALLET’s evaluate-topic command on the test data for a range of topics. By evaluating the models based on their log likelihood values, we obtained Figure 5. This figure allows to find the “knee” point K where one gets diminishing returns in log likelihood as we increase the number of topics. In this case, K = 80, which is the number of topics used in our case study.
4.3
k ∈R
1 (5) rank of the first tp . . . , where R is the set of all relevant retrieved items and k is the number of retrieved items. We use AP, since it considers the position of the true positives in the ranking. This mainly helps in ranking applications such as feature location where relevant items occur among top hits of the search results, since the users of feature location tend to only browse the first page, i.e., the top 10 hits. We chose AP over the “Precision at k” measure, because AP is generalizable over multiple queries (values of k)— if we calculate the mean value for all queries— and it can compute precision at every correctly returned result. For instance, to have a fair evaluation using “Precision at 10”, at least 10 actual relevant items must exist in the corpus for all executed queries [23], while we may not have this number of relevant items in our corpus for each query. We also use RR, since it considers the position of the first true positive in the search results, and is best applied when one has very few true positives, some of which occurring in the top k of the search results. In feature location, we indeed risk to have a low number of true positives, since we are looking for the top ranked result across different levels of abstraction (GUI and Speech text versus source code text). In such cases, the AP measure by itself is not enough, since its value depends on the ranks of all true positives. Therefore, having true positives at the bottom of the top k list will penalize the value of AP, and RR should be used as a complementary measure to AP. In general, RR can be used to evaluate whether the most relevant hits are among the top ones, while AP can be used to find out how well the approach is able to retrieve the relevant results and rank them among top hits. RR =
Evaluation Measures
The retrieved ranking results will be evaluated against an oracle (baseline) created by manually executing the essential steps of a use-case scenario (shared amongst all screencasts of a scenario) and generating an execution trace using Xdebug [48], which is a popular PHP profiler. The execution trace then was parsed to extract the PHP files whose functions were called. Some extracted source code files are common across both analyzed scenarios of WordPress and form the “All” baseline. Other files are unique to a given scenario and hence more indicative of that scenario. We call this set of files the “Unique” baseline. Note that, while the files in the All baseline are shared between different scenarios, in each one of them a different subset of methods could be executed, since the granularity of our analysis is file-level. We consider the Unique baseline to be more relevant to the technical
5 CASE STUDY RESULTS 5.1 RQ1. How accurately can source code files be located from screencasts? To answer this research question, we focus on the leftmost blue boxplots on Figure 6 and 7 (i.e., “na.gs”), which shows the results when both GUI and speech data are used as is (without rebalancing). Results on “menu” Scenario: Figure 6 shows that the median AP for the All baseline is 0.8 and for the Unique baseline is 0.55, which means that for the All baseline, every 5th result will be a false positive, while for the Unique baseline every 3rd or 4th item on the search results will be a false positive. Having an AP of more than 0.5 means that we have more true positives than false positives in the top 10 hits, which is a good sign for a feature 6
Feature Location using Crowd-based Screencasts
MSR ’18, May 28–29, 2018, Gothenburg, Sweden
(a) Menu - Average Precision - All Baseline
(b) Menu - Reciprocal Rank - All Baseline
(c) Menu - Average Precision - Unique Baseline
(d) Menu - Reciprocal Rank - Unique Baseline
Figure 6: Boxplots of RR and AP for the Menu scenario evaluated against All and Unique execution trace files, using both GUI/speech data (“gs”), only GUI (“g”) or speech (“s”), either with weighted (“w”) or original (“na”) metrics. Table 1: Random guess probability of the baseline files out of the total corpus of 554 source code files. use-case Scenario
Baseline
#files
Random Guess
Post
All Unique All Unique
92 14 92 13
0.17 0.03 0.17 0.02
Menu
In most of the cases, the approach can successfully rank the first relevant item at the top of the result set when using both GUI and speech dataset. In general, the results for the “menu” scenario are more precise because there is less noise in this data set. Having less noise (e.g., less user content input into the GUI) allows to have more terms in common with the source code dataset. However, even for the noisy scenario, the approach performs better than random guessing, being able to retrieve more than 50% of the true positives in the top 10 results.
location approach. Considering that there are only 13 PHP files in the Unique baseline, having a median of only 3 or 4 false positives in the top 10 hits means that the approach can give a higher rank to the most relevant files. More importantly, all screencasts had an RR value of 100% for the All baseline, while half of them had such a high RR value for the Unique baseline. The fact that the first true positive in the majority of the cases has rank 1 indicates that the approach provides useful seeds in this scenario. Results on “post” Scenario: Figure 7 shows that the median of RR is 100% for both baselines, which means that even when using a noisy dataset such as the “post” scenario, the approach still is able in the majority of cases to rank the most relevant result in first position. Also, the median of AP is 0.67 for the All baseline and 0.63 for the unique baseline, which means that we will have more true positives than false positives in the top 10 hits. Further evaluations for both baselines in Table 1 show that the approach always outperforms random guessing, where one would try to correctly guess all relevant files in each baseline. Conclusion:
5.2
RQ2. What is the optimal balance between GUI and speech data for feature location?
To answer this research question, we focus on the two blue boxplots in the figures (“na.gs” and “w.gs”) to understand if adjusting the term frequencies of the GUI/speech dataset using ROC (see Section 4.1), improves the results. Results on “menu” Scenario : The boxplots in Figure 6 show that, when term frequencies are adjusted, the median of RR for both All and Unique baselines is always 100%, which means that the approach is still able to rank the relevant results at the top of the result set in most of the cases. Also in the Unique baseline, all RR values are 100% with zero variance. This means that, in this scenario, rebalancing the combined GUI and speech data of screencasts improves the RR compared to the initial data. Evaluation of AP values against the All baseline shows that there is an overlap between the blue boxplots, which 7
MSR ’18, May 28–29, 2018, Gothenburg, Sweden
P. Moslehi et al.
(a) Post - Average Precision - All Baseline
(b) Post - Reciprocal Rank - All Baseline
(c) Post - Average Precision - Unique Baseline
(d) Post - Reciprocal Rank - Unique Baseline
Figure 7: Boxplots of RR and AP for the Post scenario evaluated against All and Unique execution trace files, using both GUI/speech data (“gs”), only GUI (“g”) or speech (“s”), either with weighted (“w”) or original (“na”) metrics. means that applying a weighting method does not noticeably increase the performance compared to the unweighted method. Nevertheless, in the unique scenario, applying a weighting method increases the median AP by around 20%, which again means that by modifying the frequency of the important terms performance can be improved. Results on “post” Scenario: Similar to the menu scenario, Figure 7 again shows that, for the All baseline, modifying the term frequencies increases the median AP to 100% and yields an RR value of 100% for all screencasts. However, applying the weighting method on the speech and GUI dataset decreases the median AP and RR for the Unique baseline. This contradicting finding seems to stem from the fact that the weighted documents are shorter due to removal of less important words (noise) and the fact that the weights Wj in equation (3) are smaller than 1 and hence decrease T F j , possibly leading to less occurrences of words. As such, the shorter GUI/speech documents, whose words typically are high-level, have more difficulty linking to the low-level and technical source code documents in the Unique baseline (such as post-new.php). Furthermore, that baseline contains only the files unique to a given scenario. This shows how reducing the amount of noise in the input data can both improve or degenerate the results. Indeed, in the All baseline there are files such as post.php that are ranked at the top of the results since they contain methods related to the high-level aspects of the scenario and therefore have a more similar term frequency with the GUI and speech text. Conclusion: In case of the “menu” scenario, which has less input noise, applying a weighting method improves most of the AP and RR
results due to the presence of more similar terms with both high-level and low-level vocabulary. However, in a more noisy scenario, weights could lead to too many low-level terms to be filtered out, making it harder to identify more technical scenario-specific files.
5.3
RQ3. Do we need both speech and GUI text to perform feature location?
Here, we compare the performance of feature location using either GUI (red boxplots) or speech (gray) screencast data to the performance of using GUI/speech data together (blue). Results on “menu” Scenario: Using the speech dataset: The gray boxplots in Figure 6 show that for both baselines the median AP and RR drop drastically to between 0.2 and 0.25. While still better than random guessing (Table 1), the speech data set by itself does not seem powerful enough. However, modifying the term frequencies fixes these issues by increasing the median AP and RR values to 100%. It seems like the many noisy words in the unbalanced speech data introduced false positives and negatives.Using the GUI dataset: For both baselines, the median of RR is 100%, while the median AP value is around 0.85 for the All baseline and 0.6 for the Unique baseline. In contrast to the speech-only case, rebalancing the GUI-only screencast data does not change these results much. Therefore, removing noisy words through rebalancing had no major effect for the menu use-case. Results on “post” Scenario: Using the speech dataset: As the gray boxplots in Figure 7 show, the AP and RR performance again drops substantially 8
Feature Location using Crowd-based Screencasts
MSR ’18, May 28–29, 2018, Gothenburg, Sweden
for unbalanced speech data. The median of AP and RR is around 0.15 and 0.1 respectively for the All baseline, and plain 0 for the Unique baseline! In contrast to the menu scenario, modifying the term frequencies still fails to rank the first true positive at the top of the hits, even though the median AP and RR are increased for the All baseline. This again shows that noise in the speech dataset (before adjusting term weights) and/or small data volume (after adjusting term weights) could reduce the performance of our approach because less terms are shared with the source code. Using the GUI dataset: Similar to the speech-only data set for the post scenario, the median AP and RR for the GUI-only data set is rather low for both baselines (around 0.5). While rebalancing can fix this issue for the All baseline, increasing median AP and RR to 100%, the performance for the Unique baseline using only GUI data cannot be repaired and even deteriorates. Conclusion: In videos with relatively low noise levels, GUI data by itself suffices for effective feature location, while the speech data (which typically is smaller) requires rebalancing to work. When screencasts become more noisy, such as in the post scenario, the speech and GUI data sets by themselves do not consistently perform well. Rebalanced GUI data sets can work well for location of more high-level files (All baseline), but not for more technical ones (Unique baseline), but only when combined with speech data performance is more consistent.
6
Construct Validity. Our approach is able to successfully retrieve relevant results in the top 10 hits of the feature location process. However, the speech-to-text and OCR tools used in this work may have noise or false positives in their output. To some extent, using the ROC term weighting approach alleviates the effect of such noise in the dataset. Nonetheless, to further reduce the effect of such errors, one can extend the proposed approach by using more advanced speech-to-text or OCR approaches. Also, to extract text from the source code, using parsers that are designed for a specific language (e.g., the PHP parser used in [17]) may help extracting more data with less noise. One other threat to construct validity is the use of LDA on short documents. Applying LDA approaches that are specifically designed for such documents (e.g., [10, 24]) could improve the topic models. Internal Validity. We used two types of baselines to evaluate the performance of the approach. Since the creation of the Unique baseline requires to compare the files shared across use-cases, considering more use-cases will reduce the size of the set of unique files. In our evaluation, the exact size of the Unique baseline does not matter, since we mainly compare the performance across the All and Unique baselines instead of focusing only on the absolute performance values. Also, we used log likelihood values for different numbers of topics to determine the best number of topics to be used in our experiments. Future work should explore the sensitivity of the work to the number of topics in more detail.
THREATS TO VALIDITY
This work is the first attempt on using crowd-based tutorial screencasts for feature location. Our case study results show that the approach can successfully locate relevant source code files using a combination of the speech and GUI, or either dataset. Nonetheless, there are some threats to external, internal and construct validity regarding the datasets and the methodology that need to be addressed in future work. External Validity. In this work, two datasets, each containing 5 screencasts of WordPress (the most popular CMS platform) are used in the case studies. This limitation comes from the need to find similar numbers of screencasts for different scenarios, on top of additional criteria such as being uploaded in the same year (likely sharing same WordPress version), being of high quality, and containing both speech and GUI. Furthermore, we had to manually validate the results of for example the text mined from speech and image frames. Future work should consider more videos and scenarios within the WordPress project and outside. Furthermore, in this work we mined only textual screencast information from speech and GUI elements. We also captured user actions through textual difference between every two subsequent image frames, and from the source code we only used textual information in the form of comments, identifiers, string literals and file names. Although these information sources already provide promising results, incorporating other information sources, such as the sequence of user events or for example call graphs from the source code should be considered for further improving the approach. Applying the feature location approach on projects developed in other programming languages can help evaluate its generalizability. Our exploratory study considers file-level as granularity. Since this requires the developers to spend more time to find the relevant method in large source code files, future work should consider method- or even line-level granularity.
7
RELATED WORK
The increase in the usage of crowd-based tutorial screencasts to learn software development related skills has motivated researchers to analyze how and why these tutorials are created [27, 28] or how to make their content searchable [37, 38]. Other work focused on making it easier for users to understand the purpose of such tutorials [16], or on helping screencast creators to produce videos that are more relevant to what users need [27, 36]. While all of this research (e.g., [3, 4, 16, 28, 33, 36–38]) focuses on creating, analyzing and extracting information from screencasts, no research work has used screencasts for feature location. In what follows, we present closely related research in analyzing screencasts and textual feature location (e.g., [5, 15, 26, 32, 45]).
7.1
Analyzing Software Engineering Screencasts
The first study in the area of using crowd-based screencasts to share and document developer knowledge was conducted by MacLeod et al. [28]. They investigated the goals and techniques of developers in creating screencasts, and the benefits and challenges of this type of knowledge sharing by analyzing 20 tutorial screencasts and interviewing 10 developer/YouTubers. They found that by using screencasts developers demonstrate and share how to customize a program, the challenges they encountered and their development experiences, solutions to problems, how to apply design patterns, and their programming language knowledge. They also found that developers are creating these screencasts to promote themselves and gain reputation by helping others. An extension of this study [27] compared how Ruby on Rails screencasts are hosted and shared on YouTube (a free platform) to how they are shared on a formal screencast site like RailsCasts, which is a paid platform. 9
MSR ’18, May 28–29, 2018, Gothenburg, Sweden
P. Moslehi et al.
Finally, they extracted guidelines for screencast creators to produce clear and understandable screencasts. There are other studies on the usage of crowd-based tutorial screencasts in the software engineering domain. Amongst the earliest research works in this area, Bao et al. [3, 4] developed a video scraping tool, scvRipper, to automatically extract developers’ behavior from screen-captured videos. They detect and extract actions of a developer by employing key point based template matching to detect visual cues in an image (e.g., icons that appear in a window). Although scvRipper is not sensitive to screen resolutions and window color schema, the approach is database dependent since the applications in screencasts need to use the same layout and window structures, which reduces the generalizability of the approach. The speech component of screencasts has been proven to be highly informative by Moslehi et al. [33]. By leveraging information extraction techniques (e.g., LDA), they only used spoken text to extract the different steps of use-case scenarios. No image frame content was exploited. Other work [36] classified tutorial video comments using Support Vector Machines (SVM) in order to summarize the comments to content creators. The need for designing short video tutorials is addressed in [27, 37, 38]. Ponzanelli et al. [37, 38] developed an approach to extract relevant fragments of software development tutorial videos and link them to relevant StackOverflow discussions by mining the (captioned) speech and GUI content of the video tutorials. In line with the aforementioned works on software development tutorial videos, Yadid et al. [49] developed an approach to extract code from programming video tutorials to enable deep indexing of them. They attempted to consolidate code across multiple image frames of the videos and used statistical language models to make corrections on the extracted code. Escobar- Avila et al. [16] presented new text retrieval-based tagging approaches, to help users to identify whether the content of a tutorial might be relevant to their needs or not. In this paper, we propose an approach that is database independent. To the best of our knowledge, there is no research work on linking high-level information of how-to screencasts (i.e., speech and GUI text) to the source code of a software project.
7.2
words. Instead, since we use LDA, which works based on the cooccurrence frequency of terms, we aimed for keeping more frequent terms in the dataset and considered rare ones as noise. To improve feature location results and overcome limitations of applying tf-idf in source code-related text in the preprocessing step, Bassett et al. [5] proposed a new term weighting technique that uses the structural information in the source code (i.e., function names and method calls extracted from call graphs). They applied an LDA-based approach to evaluate their technique and found more accurate results. Eddy et al. [15] expanded this work and explored a broader range of variables in source code (e.g., leading comments, method names, parameters, body comments, and local variables) and weighted them according to their position in a method. However, these approaches are programming language-specific and mostly suitable for feature location using low-level information, while in our work we try to link high-level information that appears in screencasts to the source code. Also, Basset et al. [5] only use Mean Reciprocal Rank (MRR) as an evaluation measure, while we use RR and Average Precision (AP) to evaluate the the approach. Lukins et al. [26] proposed an LDA-based bug localization technique using user-provided queries that are formulated out of bug reports. They evaluated their approach by calculating the percentage of the bug queries whose first relevant result is in the top 10 or top 1,000 results, which requires the baseline to have at least 10 or 1,000 actual relevant items. None of the above studies use speech and GUI content of a screencast as input of feature location. We also used a different preprocessing technique to rebalance the query dataset. Furthermore, we used 2 complementary measures in our evaluations to get a better insight into the success of the approach.
8
CONCLUSION
This work presents the first feature location approach that uses crowd-based screencasts of a given use-case scenario to locate the scenario’s implementation in the source code. Our methodology takes as input source code-level textual information (e.g., comments, identifiers and string literals) and the high-level text extracted from the audio and visual components of screencasts (i.e., speech and GUI text). It uses LDA to structure this information to output seeds in the source code that could form a good starting point for exploring the implementation of the screencasts’ scenarios. In case studies on 10 Wordpress screencasts spread across two scenarios, we evaluated the success of the approach in retrieving the most relevant result at the top 10 search results. We then examined how modifying term frequencies, based on the importance of the terms, affects the feature location results. Eventually, we determined which information source from screencasts (GUI, speech, or a combination of both) is sufficient to be used in the feature location process. In general, our findings show that a combination of GUI and speech data performs well across different levels of noise in the screencasts, while a GUI-only data set with rebalanced terms could still perform well in screencasts with limited amounts of noise. Future work should analyze screencasts belonging to different scenarios and software applications. Since we now have established that screencasts carry enough textual signal, future work should also compare our approach with other text retrieval-based approaches for feature location.
Text Retrieval-based Feature Location
Several feature location techniques have been proposed that use different types of information in source code or different user inputs. We refer to elsewhere for a detailed overview [14], however here we discuss the relevant work that, similar to ours, takes the user input and maps it to the textual information of source code (i.e., comments, identifiers, etc.) using information retrieval (IR) or natural language processing (NLP) approaches. Marcus et al. [32] leveraged Latent Semantic Indexing (LSI) [13] to find semantic similarities between a query that is either automatically generated or provided by the user to locate source code features. Van der Spek et al. [45] also used LSI to find features in source code. They applied different preprocessing and text normalization methods, such as stemming, stop word removal of common terms and term weighting to the datasets and evaluated their effect. The term weighting approach they used is different from ours, since they aim for finding a balance between having frequent and rare 10
Feature Location using Crowd-based Screencasts
MSR ’18, May 28–29, 2018, Gothenburg, Sweden
REFERENCES
Working Conference on Reverse Engineering (2008), 155–164. [26] Stacy K. Lukins, Nicholas A. Kraft, and Letha H. Etzkorn. 2010. Bug localization using latent Dirichlet allocation. Information and Software Technology 52, 9 (2010), 972–990. [27] Laura MacLeod, Andreas Bergen, and Margaret-Anne Storey. 2017. Documenting and sharing software knowledge using screencasts. Empirical Software Engineering 22, 3 (01 Jun 2017), 1478–1507. [28] Laura MacLeod, Margaret-Anne Storey, and Andreas Bergen. 2015. Code, Camera, Action: How Software Developers Document and Share Program Knowledge Using YouTube. In Proceedings of the 2015 IEEE 23rd International Conference on Program Comprehension (ICPC ’15). IEEE Press, Piscataway, NJ, USA, 104–114. MALLET: MAchine Learning for LanguagE Toolkit. [29] mallet [n. d.]. http://mallet.cs.umass.edu/. ([n. d.]). [30] Christopher D. Manning, Prabhakar Raghavan, and Hinrich Sch??tze. 2008. Introduction to Information Retrieval. Cambridge University Press, Cambridge, UK. [31] Christopher D. Manning, Prabhakar Raghavan, and Hinrich Schütze. 2008. Introduction to Information Retrieval. Cambridge University Press, New York, NY, USA. [32] A. Marcus, A. Sergeyev, V. Rajlich, and J. I. Maletic. 2004. An information retrieval approach to concept location in source code. In 11th Working Conference on Reverse Engineering. 214–223. [33] P. Moslehi, B. Adams, and J. Rilling. 2016. On Mining Crowd-Based Speech Documentation. In 2016 IEEE/ACM 13th Working Conference on Mining Software Repositories (MSR). 259–268. [34] Mark S. Nixon and Alberto S. Aguado. 2012. Chapter 5 - High-level feature extraction: fixed shape matching. In Feature Extraction and Image Processing for Computer Vision (Third edition) (third edition ed.), Mark S. Nixon and Alberto S. Aguado (Eds.). Academic Press, Oxford, 217 – 291. [35] Mark S. Nixon and Alberto S. Aguado. 2012. Chapter 7 - Object description. In Feature Extraction and Image Processing for Computer Vision (Third edition) (third edition ed.), Mark S. Nixon and Alberto S. Aguado (Eds.). Academic Press, Oxford, 343 – 397. [36] Elizabeth Poché, Nishant Jha, Grant Williams, Jazmine Staten, Miles Vesper, and Anas Mahmoud. 2017. Analyzing User Comments on YouTube Coding Tutorial Videos. In Proceedings of the 25th International Conference on Program Comprehension (ICPC ’17). IEEE Press, Piscataway, NJ, USA, 196–206. https: //doi.org/10.1109/ICPC.2017.26 [37] Luca Ponzanelli, Gabriele Bavota, Andrea Mocci, Massimiliano Di Penta, Rocco Oliveto, Mir Hasan, Barbara Russo, Sonia Haiduc, and Michele Lanza. 2016. Too long; didn’t watch!. In Proceedings of the 38th International Conference on Software Engineering - ICSE ’16. ACM Press, New York, New York, USA, 261–272. [38] L. Ponzanelli, G. Bavota, A. Mocci, R. Oliveto, M. Di Penta, S. C. Haiduc, B. Russo, and M. Lanza. 2017. Automatic Identification and Classification of Software Development Video Tutorial Fragments. IEEE Transactions on Software Engineering PP, 99 (2017), 1–1. [39] D. Poshyvanyk, Y. G. Gueheneuc, A. Marcus, G. Antoniol, and V. Rajlich. 2007. Feature Location Using Probabilistic Ranking of Methods Based on Execution Scenarios and Information Retrieval. IEEE Transactions on Software Engineering 33, 6 (June 2007), 420–432. [40] George Spanoudakis and Andrea Zisman. 2004. Software Traceability: A Roadmap. In Handbook of Software Engineering and Knowledge Engineering. World Scientific Publishing, 395–428. [41] William G Stillwell, David A Seaver, and Ward Edwards. 1981. A comparison of weight approximation techniques in multiattribute utility decision making. Organizational Behavior and Human Performance 28, 1 (1981), 62–77. [42] stt [n. d.]. IBM Watson Speech To Text. https://www.ibm.com/watson/services/speech-to-text/. ([n. d.]). [43] tesseract [n. d.]. Tesseract. https://github.com/tesseract-ocr/tesseract. ([n. d.]). [44] Stephen W. Thomas. 2012. Mining Unstructured Software Repositories Using IR Models. Ph.D. Dissertation. Queen’s University. [45] P. van der Spek, S. Klusener, and P. van de Laar. 2008. Towards Recovering Architectural Concepts Using Latent Semantic Indexing. In 2008 12th European Conference on Software Maintenance and Reengineering. 253–257. [46] wpress [n. d.]. WordPress. https://WordPress.com/. ([n. d.]). [47] wpTutorials [n. d.]. WordPress Video Tutorials. https://en.support.WordPress.com/video-tutorials/. ([n. d.]). [48] xdebug [n. d.]. Xdebug Extension for PHP. https://xdebug.org/. ([n. d.]). [49] Shir Yadid and Eran Yahav. 2016. Extracting Code from Programming Tutorial Videos. In Proceedings of the 2016 ACM International Symposium on New Ideas, New Paradigms, and Reflections on Programming and Software (Onward! 2016). ACM, New York, NY, USA, 98–111.
[1] Surafel Lemma Abebe, Anita Alicante, Anna Corazza, and Paolo Tonella. 2013. Supporting concept location through identifier parsing and ontology extraction. Journal of Systems and Software 86, 11 (2013), 2919 – 2938. [2] Kenneth M. Anderson, Susanne A. Sherba, and William V. Lepthien. 2002. Towards large-scale information integration. In Proceedings of the 24th international conference on Software engineering - ICSE ’02. ACM Press, New York, New York, USA, 524. [3] Lingfeng Bao, Jing Li, Zhenchang Xing, Xinyu Wang, Xin Xia, and Bo Zhou. 2017. Extracting and analyzing time-series HCI data from screen-captured task videos. Empirical Software Engineering 22, 1 (01 Feb 2017), 134–174. [4] Lingfeng Bao, Jing Li, Z. Xing, Xinyu Wang, and Bo Zhou. 2015. Reverse engineering time-series interaction data from screen-captured videos. In 2015 IEEE 22nd International Conference on Software Analysis, Evolution, and Reengineering (SANER). 399–408. [5] B. Bassett and N. A. Kraft. 2013. Structural information based term weighting in text retrieval for feature location. In 2013 21st International Conference on Program Comprehension (ICPC). 133–141. [6] David M. Blei, Andrew Y. Ng, and Michael I. Jordan. 2001. Journal of machine learning research : JMLR. Vol. 3. MIT Press. 993–1022 pages. [7] R. Brunelli and T. Poggio. 1993. Face recognition: features versus templates. IEEE Transactions on Pattern Analysis and Machine Intelligence 15, 10 (Oct 1993), 1042–1052. [8] bugVideo [n. d.]. YouTube Video Describing a Bug. https://youtu.be/Am9SNUhSz4w. ([n. d.]). [9] Tse-Hsun Chen, Stephen W Thomas, and Ahmed E Hassan. 2016. A survey on the use of topic models when mining software repositories. Empirical Software Engineering 21, 5 (oct 2016), 1843–1919. [10] X. Cheng, X. Yan, Y. Lan, and J. Guo. 2014. BTM: Topic Modeling over Short Texts. IEEE Transactions on Knowledge and Data Engineering 26, 12 (Dec 2014), 2928–2941. [11] Mohammed Cheriet, Nawwaf Kharma, Cheng-lin Liu, and Ching Suen. 2007. Character Recognition Systems: A Guide for Students and Practitioners. WileyInterscience. [12] Jane Cleland-Huang, Orlena C. Z. Gotel, Jane Huffman Hayes, Patrick Mäder, and Andrea Zisman. 2014. Software traceability: trends and future directions. In Proceedings of the on Future of Software Engineering - FOSE 2014. ACM Press, New York, New York, USA, 55–69. [13] Scott Deerwester, Susan T. Dumais, George W. Furnas, Thomas K. Landauer, and Richard Harshman. 1990. Indexing by latent semantic analysis. Journal of the American Society for Information Science 41, 6 (1990), 391–407. [14] Bogdan Dit, Meghan Revelle, Malcom Gethers, and Denys Poshyvanyk. 2013. Feature location in source code: A taxonomy and survey. Journal of software: Evolution and Process 25, 1 (2013), 53–95. arXiv:1408.1293 [15] Brian P. Eddy, Nicholas A. Kraft, and Jeff Gray. 2018. Impact of structural weighting on a latent Dirichlet allocation???based feature location technique. Journal of Software: Evolution and Process 30, 1 (2018), e1892–n/a. e1892 smr.1892. [16] J. Escobar-Avila, E. Parra, and S. Haiduc. 2017. Text Retrieval-Based Tagging of Software Engineering Video Tutorials. In 2017 IEEE/ACM 39th International Conference on Software Engineering Companion (ICSE-C). 341–343. https://doi. org/10.1109/ICSE-C.2017.121 [17] Laleh Eshkevari, Giuliano Antoniol, James R. Cordy, and Massimiliano Di Penta. 2014. Identifying and Locating Interference Issues in PHP Applications: The Case of WordPress. In Proceedings of the 22Nd International Conference on Program Comprehension (ICPC 2014). ACM, New York, NY, USA, 157–167. [18] ExuberantCtags [n. d.]. Exuberant Ctags. http://ctags.sourceforge.net/. ([n. d.]). [19] ffmpeg [n. d.]. FFmpeg. https://www.ffmpeg.org/. ([n. d.]). [20] K. Gallaba, A. Mesbah, and I. Beschastnikh. 2015. Don’t Call Us, We’ll Call You: Characterizing Callbacks in Javascript. In 2015 ACM/IEEE International Symposium on Empirical Software Engineering and Measurement (ESEM). 1–10. [21] google [n. d.]. Google Cloud Vision API. https://cloud.google.com/vision/. ([n. d.]). [22] H. Kagdi, J. I. Maletic, and B. Sharif. 2007. Mining software repositories for traceability links. In 15th IEEE International Conference on Program Comprehension (ICPC ’07). 145–154. [23] Iman Keivanloo. 2013. Source Code Similarity and Clone Search. (2013). [24] Chenliang Li, Haoran Wang, Zhiqian Zhang, Aixin Sun, and Zongyang Ma. 2016. Topic Modeling for Short Texts with Auxiliary Word Embeddings. In Proceedings of the 39th International ACM SIGIR Conference on Research and Development in Information Retrieval (SIGIR ’16). ACM, New York, NY, USA, 165–174. [25] Stacy K. Lukins, Nicholas A. Kraft, and Letha H. Etzkorn. 2008. Source Code Retrieval for Bug Localization Using Latent Dirichlet Allocation. 2008 15th
11