Journal of Experimental Psychology: Applied 2000, Vol. 6, No. 1,44-58
Copyright 2000 by the American Psychological Association, Inc. 0278-7393/00/55.00 DOI: 10.1037//0278-7393.6.1.44
Adaptive Automation, Trust, and Self-Confidence in Fault Management of Time-Critical Tasks Neville Moray University of Surrey
Toshiyuki Inagaki and Makoto Itoh University of Tsukuba
An experiment on adaptive automation is described. Reliability of automated fault diagnosis, mode of fault management (manual vs. automated), and fault dynamics affect variables including root mean square error, avoidance of accidents and false shutdowns, subjective trust in the system, and operator self-confidence. Results are discussed in relation to levels of automation, models of trust and self-confidence, and theories of human-machine function allocation. Trust in automation but not self-confidence was strongly affected by automation reliability. Operators controlled a continuous process with difficulty only while performing fault management but could prevent unnecessary shutdowns. Final authority for decisions and action must be allocated to automation in time-critical situations.
Automation is any sensing, detection, informationprocessing, decision-making, or control action that could be performed by humans but is actually performed by machine. In supervisory control, an automated control system is monitored by human operators, who intervene only if they believe that the system is faulty or want to improve efficiency (Sheridan, 1976, 1997; Sheridan & Johannsen, 1976). Only recently has significant research appeared on what level of automation best combines human and automation skills (Billings, 1991, 1997; Endsley & Kiris, 1995; Hancock & Scallen, 1998; Kantowitz & Sorkin, 1987; Scerbo, 1996). The first taxonomy of automation levels was published by Sheridan and Verplank (1978; Sheridan, 1987, 1992; see Figure 1). Alternative taxonomies (Billings, 1991, 1997; Endsley & Kaber, in press; Endsley & Kiris, 1995; Hancock & Chignell, 1989; Inagaki, 1993, 1995) do not offer any marked advantage over the original scale (Wei, 1997, pp. 43, 47, 48), often covering only a subset of the original levels (and unfortunately, seldom referencing Sheridan & Verplank's original work). We call Sheridan and Verplank's (1978) classification Sheridan-Verplank levels (SVLs). Below SVL 5, humans have responsibility for decision making and for controlling machines. Above SVL 7 is the fully autonomous robot. Between SVLs 5 and 7 lie SVLs with genuine collaboration
between human and machine at the price of considerable mental or computational workload. Some researchers have investigated how one might choose an appropriate level from the Sheridan-Verplank scale for a human-machine system (Billings, 1991, 1997; Endsley & Kaber, in press; Endsley & Kiris, 1995; Kaber, Omal, & Endsley, 1999; Sanderson, 1989). However, there are few detailed models of the dynamics of human-machine relations (Amalberti, 1992; Norman, 1990; Sarter & Woods, 1995; Scerbo, 1996; Wickens, 1995; Wiener, 1989). Although it is widely believed that humans should always have ultimate decision-making authority in human-machine systems (Billings, 1991, 1997; Woods, 1989; Woods & Roth, 1988), Inagaki (Inagaki, 1993, 1995; Inagaki & Itoh, 1996; Inagaki & Johannsen, 1992) has proposed that the choice of the SVL should change dynamically, depending on the situation, and that SVL 6 or higher should be adopted to maintain system safety. Wei (1997) showed that some operational or control functions already lie at SVL 7 in aircraft and nuclear power plants. The present article examines adaptive automation (AA; Mouloua & Koonce, 1997; Mouloua & Parasuraman, 1994; Parasuraman & Mouloua, 1996; Parasuraman & Riley, 1997; Scerbo & Mouloua, 1999; and particularly Scerbo, 1996) during fault management in a thermal-hydraulic environment and emphasizes conditions in which control is preempted by automation when a time-critical fault occurs. We pose the following questions: 1. Should human operators always be responsible for decision making in fault management, or should automation take control in time-critical situations? 2. If the role of automation is to perform fault management and to assist human operators in performing fault management, how does the reliability of automated fault diagnosis affect performance and the relation of operators to machines (issues of trust and self-confidence)? 3. How does the severity of faults affect the success of human fault management? 4. Does the severity of faults affect the choice of SVL automation?
Neville Moray, Department of Psychology, University of Surrey, Surrey, Guildford, United Kingdom; Toshiyuki Inagaki and Makoto Itoh, Institute of Information Sciences and the Center for TARA, University of Tsukuba, Tsukuba, Japan. This research was supported in part by a grant from the Center for TARA at the University of Tsukuba and Grants-in-Aid 08650458 and 09650437 of the Japanese Ministry of Education. Neville Moray was supported, in part, by funds from the United Kingdom Defence Evaluation and Research Agency. Correspondence concerning this article should be addressed to Neville Moray, Department of Psychology, University of Surrey, Guildford, Surrey GU2 5XH, United Kingdom. Electronic mail may be sent to
[email protected].
44
ADAPTIVE AUTOMATION SHERIDAN-VERPLANK SCALE OF HUMAN-MACHINE FUNCTION ALLOCATION IN AUTOMATEDSYSTEMS
1.
The human does the whole job of planning, selecting options, and preparing the machine, up to the point of switching on the machine to carry out the action.
2.
1 he human asks computer to suggest options and selects from those options.
3
The computer spontaneously suggests options to human.
4.
The computer suggests options and proposes one of them for the human to use.
5.
The computer selects an action and performs it if the human signals approval.
6.
The computer selects an action and performs it unless the human intervenes to cancel it.
7.
The computer chooses an action, performs it, and informs the human.
10.
The computer does the entire task autonomously.
Figure I. An example of the Sheridan-Verplank taxonomy of human-machine interaction. 5. Can operators' trust in the automation and their self-confidence in their manual control ability be modeled in a similar way to that developed earlier by Lee and Moray (1992, 1994) for dynamic allocation of function?
Method To improve the possibility of generalizing from laboratory experiments to real industrial tasks, we used an experimental microworld (a representation of a physical system with many physical characteristics of the real world). Newtonian mechanics applied, heat transfer followed the laws of thermodynamics, time constants were similar to those in real systems, and control loops could be closed either through the automation or the operator.
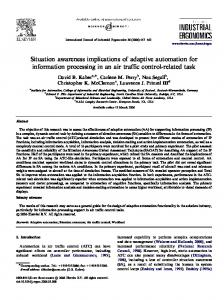
Supervisory Control and Response to Leaks: TARA at Tsukuba (SCARLETT)—A Central Heating System The microworld is called SCARLETT and is realized in G2 code on a Sun Microsystems workstation (Palo Alto, CA). The interface is shown in Figure 2. Although the thermal equations, mass-energy exchanges, and so forth are physically correct, no real system would have exactly this combination of gravity feed and pumped flow, but we believe on the basis of the literature and our prior experience that behavior here resembles that of operators working in real systems (see Rasmussen, Pejtersen, & Goodstein, 1995, for a discussion of this problem). Operators have two tasks: (a) control the temperature of the central heating system in the apartment complex (AP) in the bottom right of Figure 2 and (b) perform fault management when leaks or breaks occur in pipes. Operators must learn the dynamics of the system under normal operating conditions, how pumps and valves function, the nature and effect of leaks and breaks and die appropriate
45
steps to counter them, and the reliability and performance of the automated fault-management system (diagnosis and control).
Task 1: Temperature Control of Central Heating A heat exchanger (HX) takes heat from the plant and transfers it to cool water coming from AP. The desired temperature (set point) and the actual temperature of the input and output on this secondary side of the HX are shown on the interface. To control the temperature of the fluid going to AP, the operator controls the rate of flow and temperature of fluid on the primary side of HX. The fluid inventory depends on Reservoirs 1,2, and 3 (Rl, R2, and R3), which are heated respectively by heaters 1, 2, and 3 (HI, H2, and H3). The flow from Rl and R2 into R3 is by gravity, so that the greater the inventory in Rl or R2, the faster the flow into R3. The circulation from R3 to the HX primary side is by means of Sucking Pump 3 (P3) pulling hot water from R3 through the HX. A switching valve (SV) returns water from the HX either to Rl or to R2. All valves are fully open or fully closed except for SV. The target and actual speed of P3 in liters per second is shown in the windows adjacent to the pump. Operators can enter values to set this speed. The target and current values of the preheaters for Rl and R2 and the heater for R3 are shown in the boxes below them and can be changed by selecting them with a cursor and typing in values. The levels, temperatures, and rates of outgoing fluid are shown on meters adjacent to each reservoir. It takes about 200 s to empty Rl or R2 under gravity feed in the absence of any input and about 200 s to empty R3 when full with no input and P3 running at full speed. To change the temperature of a full R3 by 10° with the heater on full power takes about 30 s. The total fluid inventory can be topped up using Pumps 1 or 2 (P1 or P2) and reduced through the waste valve at the bottom of the figure. A pump must never suck from a dry pipe, and no reservoir should become empty of fluid while hot. Operators are instructed that those events constitute accidents that severely damage the plant, causing the run to be halted.
Task 2: Fault Management In this experiment, we investigated the effects of leaks and breaks in pipes. Their characteristics are shown in Table 1. The measures of fault-management efficiency are the amount of fluid lost, whether an accident with inadvertent plant shutdown occurs, and whether the plant is shut down unnecessarily. We also recorded operator response times. Fault Management 1: Leaks. A leak may occur in one of the pipes (site locations [L] 1-6, depending on the trial), and from the point of view of the operators, randomly. A suspected leak should always be repaired immediately without shutting down the plant by clicking the appropriate button with the cursor to instruct a repair crew to go to the site. Fault Management 2: Breaks. If a pipe breaks, the flow beyond the break immediately falls to zero: All fluid flowing through the pipe is lost. The plant must be shut down immediately. No repair is possible. Breaks also can occur at sites LI—L6, depending on the trial, and from the point of view of the operators, randomly. Suppose, for example, that a break occurs at LI. No heat now reaches the HX, and the temperature of the flow to the AP drops. The outflow from R3 is now a gravity flow and is proportional to the water level in R3. The discrepancy between the target flow rate and the actual flow rate at P3 is a cue that a pipe break has occurred. If P3 is left running, severe damage will occur as soon as the pipe has emptied.
46
MORAY, INAGAKJ, AND ITOH
SIMULA TION-CLOCK
| Information from Auto: | 'Leak! Send repair crew.' \
Figure 2. The Supervisory Control and Response to Leaks: TARA at Tsukuba (SCARLETT) central heating microworld. Buttons for repairing leaks are adjacent to the site of faults, together with a "Disagree" button for vetoing automation. Buttons for stopping pumps and cutting off heaters are adjacent to their respective components. Buttons for opening and closing valves are adjacent to their valves. Requested and actual temperature of building are shown to the lower right of the heat exchanger (HX). The "Message Window" shows a typical warning message following a leak. Levels, temperatures, and flows are shown digitally in windows. O = inflow rate to pump; P = pump; F = flow rate through pipe; R = reservoir; L = location of leak or break; T = temperature of input to central heating (output of heat exchanger); opn = open; els = close; V = valve; H = heater; rep = indicates a repair has been made; dis = button to dispatch a repair crew to that location; AP = apartment complex. Fault Management 3: Accidents. Operators were trained to avoid certain consequences of leaks or breaks, which counted as accidents. Accidents are as follows: a reservoir dries out when heated, a pump runs with no incoming fluid, more than 1,000 L of fluid from a pipe floods the floor following a break (approximately 3 L/s are lost in leaks and from 6 to 50 L/s in breaks), and the temperature of fluid to the AP is too high or too low (> 75° or < 15° for more than 5 s at the output of the secondary side of HX). These characteristics of accidents allow 10-60 s between a break and its related accident, except for the one very time-critical break in LI. They do not mimic values in a particular real system. When faults are absent, operators must maintain the temperature of the output of the HX at set point, but the avoidance of accidents has a higher priority than continuing to maintain the temperature of the output of the HX because an accident will damage the plant. This is emphasized during training. Operators are instructed that if they believe that a break has occurred, then they must abandon temperature control and concentrate on fault management, which becomes the only goal. When leaks occur, operators should continue to control temperature in the heating circuit because a
repair is effected on-line; the "Send repair crew" command is given immediately by humans or automation. Special buttons are provided for emergency shutdowns. These permit operators to cut the power to the preheaters and the heater, to stop the pumps instantaneously, and to change the state of a valve. Although the interface provides sufficient information for operators to diagnose leaks and breaks, fault diagnosis is also always performed automatically and a message identifying the problem appears in the window below the interface (see Figure 2). Examples of such messages are "Leak at L2! Send a repair crew." (SVL 4), "Break at L2! 1 will shut down the plant in 10 seconds. You can veto this by using the Disagree button." (SVL 6), and "Break at LI! I have shut down the plant." (time-critical fault, SVL 7). To use Sheridan's (1987) terminology, input and diagnosis are always automated in parallel with operators. In this experiment, it is the choice and performance of action that are traded between human and machine. Operators must either follow the suggestion of the automation or take what other action they think appropriate. If they think the
ADAPTIVE AUTOMATION
Table 1 Characteristics of Faults: Location (L) of Leaks and Breaks, Temporal Dynamics, Period Allowed for Veto, and Expected Loss of Fluid by Shutdown
Fault LI leak LI break L21eak L2 break L31eak L3 break L41eak L4 break LSleak L5 break L61eak L6 break
Time until accident (seconds)
334 10 334 15 334 a^ 334 ^80"
334 >80»
334 15
Expected fluid loss (liters)
285'
250 285»
375 285' 1,000 285" 1,000 285' 1,000 285"
375
Delay to allow veto (seconds)
25 0 25 10 25 18 25 18 25 18 25 10
"Values that would have been collected had an accident ever occurred with leaks, which never happened. 'Values depend on the state of the plant at the moment when the fault occurs.
automated diagnosis is incorrect, then they should act according to their beliefs, regardless of what is displayed in the message window. If they think that although the diagnostic message asserts that a leak is present it is really a break, then they should shut the plant down; however, if a break is signaled but they believe that it is really a leak, then they should send a repair crew and continue to control the temperature of AP. At SVL 6, if the period allowed for veto elapses with no action by the operator, the automation always carries out the action proposed: Automated control never fails, but the resulting action may be wrong from a fault-management point of view if the automated diagnosis was incorrect. The same is true of SVL 7. All unreliable messages are misdiagnoses: There are no misses and no false alarms because of the automated faultdiagnosis system.
47
Reliability in this experiment was the percentage of trials on which the automated diagnosis was correct and suggested the correct action, 70%, 90%, or 100%. It is strictly the automated fault diagnosis that is unreliable. The automated control always acts in accordance with the diagnosis, with 100% reliability. Thus, automated fault management may be less than 100% reliable because the initial diagnosis may be faulty. Reliability of automation, automation reliability, and reliability of automated fault diagnosis are used interchangeably. Each operator experienced only one level of reliability. They were not told the probability of unreliable diagnosis but were told, in all conditions of reliability, that sometimes the automation might misdiagnose a leak as a break, or vice versa. Trials typically lasted 2.5 min. The rates of fluid loss in leaks and breaks were chosen to cover a range from very slow and easy to control to very fast (time critical). It was not possible to set exact rates in advance because the rate that an operator experienced was dependent on the state of the plant when the fault occurred, and that, in turn, depended on the strategies adopted by the operator. For example, suppose that the experimenter implemented a break at L4 but that just before the break was scheduled, the operator changed the position of the S V to direct all flow to R2. The result of the break would be very different from what would happen if all the flow were directed to Rl. This kind of problem in experimental design is characteristic of realistic systems that resemble real systems with many degrees of freedom, in which almost any problem can be attacked using several different strategies. The cost of realism is that loss rates due to faults cannot be entirely under the control of the experimenter. All information presented on the screen was in English, and all participants were fluent in English.
Operators Operators were 30 volunteer undergraduate and graduate students of the University of Tsukuha computer science program who were paid ¥3000 (approximately $30) for participating for 90 min on each of 3 successive days. Ten operators were randomly assigned to each level of reliability, and of these, half received the order of condition in which M followed AA and half the reverse, randomly assigned.
Experimental Design The experimental design was a 2 x 2 x 3 x 2 factorial, mapping onto Mode of Control X Type of Fault X Level of Reliability X Order of Condition. Level of reliability was treated as a random factor, and all others were treated as fixed factors. Mode of control and type of fault were within-operators factors and reliability and order of condition were between-operator factors. Mode of control was either manual (M) or AA and was relevant only to fault management (Task 2). Temperature control (Task 1) was always manual. Type of fault was leak or break (see Table 1). Order of condition meant that half the operators received all M trials before AA trials, and half received the opposite. All operators experienced every leak and every break twice, both in M and AA modes of control. There was one fault during each trial. We used the following procedures. AA is a system that adapts its SVL of interaction as a function of the situation. If the automated diagnosis indicates that the situation is extremely time-critical, then SVL 7 is selected, and the automation takes control. If automated diagnosis indicates that there is time for human intervention, then SVL 6 is adopted, but if the human does not act or veto the automation, the latter acts. When the control mode is M, automated diagnoses are displayed, but control is left to the human (SVL 4). For convenience, we refer to SVL 4 as M and both SVL 6 or 7 as AA.
Training On Day 1, we explained and demonstrated the purpose of the experiment, the physical properties of the simulated plant, the interface, the displays, the possible control actions, and the operating procedures. Ten trials with no faults familiarized the operators with plant dynamics, possible actions, how to manipulate the controls, and so forth. Five trials then demonstrated the phenomena that typically occur under fault conditions with leaks, and another five trials demonstrated the effects of pipe breaks. Two trials were given to learn control modes with leaks under M and AA control, and two trials were given to learn control modes under break conditions. At the end of the training period, all operators were asked if they had any questions about the task or how to operate the plant, and any such questions were answered.
Control for Learning: Pretrials On Day 2, three no-fault trials were given to measure performance on the first task (controlling the central heating system). These are called the pretrials.
48
MORAY, INAGAKI, AND ITOH
Trials With Leaks and Breaks Each operator then performed 40 trials at one level of reliability, either all M trials first and then all AA trials or the reverse order. Within these conditions, the sequence of fault types and the particular fault (L1-L6) were randomized. A fault occurred on every trial between 10 and 100 s, randomly after the start.
Subjective Ratings After each trial, 10-point rating scales appeared on the screen, on the basis of those successfully used in the past by Muir (1989, 1994), Lee (1991), and Lee and Moray not at all and 10 indicating completely. scales with a mouse-driven cursor to trusted the automation to perform its
(1994), with 1 indicating Operators clicked on the indicate how much they task well and their self-
confidence in their ability to control the plant by themselves without automation.
Control for Learning: Posttrial At the end of Day 3, three no-fault posttrials were run to check for significant learning during the experiment.
Feedback At the end of each trial, operators were told whether there had been an accident, the values of their root mean square error (RMSE) and fluid loss, and whether there had been a false shutdown.
Results We report three aspects of the results: the temperature control task (minimizing the RMSE of the central heating plant), the fault-management task, and the subjective judgments about the relations between the operators and SCARLETT. The relevant dependent variables are as follows: temperature control task (RMSE), fault management (probability of accident, magnitude of fluid loss, probability of false shutdowns, proportion of shutdowns performed by automation, response time of operators, and frequency of humans incorrectly disagreeing with automated fault diagnosis), and subjective judgments (trust in efficacy of the automation and self-confidence in manual control). Unless stated to the contrary, all analyses of variance (ANOVAs) were four-way (over the four factors of the experimental design).
Control of Temperature of Central Heating System There were no automatic control loops closed around the central heating system. All actions on heaters, pumps, and valves to keep the temperature at a set point were manual control actions. The automation was not intended to minimize RMSE of the central heating system.
RMSE in Controlling the Temperature of Fluid Leaving the HX (in Degrees) We can use the RMSE when the plant is allowed to run with fault management at 100% reliability in the absence of
a human controller as a baseline: A significant reduction from this RMSE represents the value of the human as a controller. Without human operators, we would expect the RMSE up to the moment when the faults occur to be approximately equal to the baseline RMSE. The RMSE after a leak (but not after a break; see below) can be used to measure the impact of the fault on the operators. The fourth measure of RMSE of interest is the difference between pretrials and posttrials, which indicates whether there was a large effect of learning, suggesting a change in manual temperature control strategy. The RMSE data are summarized in Table 2. A three-way ANOVA on the pretrial versus posttrial RMSE showed only a main effect of pretrial versus posttrial, F(l, 2)1 = 10.33, p = 0.031 (pretrial mean = 2.07, SD = 0.83; posttrial mean = 1.64, SD = 0.34). Operator skill in controlling the temperature of the fluid leaving the HX did improve during the experiment. There is no evidence that this interacted with other measures, and it seems to have occurred independently of the skills exercised in fault management. In tasks and systems such as SCARLETT, it takes many hours of practice to reach asymptotic skill. Lee and Moray's (1992, 1994) operators were still not at asymptote after 6 hr of practice, Muir (1989) trained her operators for more than 12 hr in each condition, and Towill (1974) modeled the acquisition of industrial skills as an exponential learning curve and estimated that in real industrial tasks, the time constant was anywhere between 20 and 200 hr. It is not cost or time effective to practice participants over such long periods unless there are strong reasons to believe that the residual learning during the experiment will distort the findings on other variables, and this is not the case in this experiment. The difference between the pretrial RMSE and the RMSE with no operator before any fault is large and significant, ;(38) = 11.70, p < .001 (no operator mean = 3.64, SD = 0.19), indicating that in this system, human operators make a significant contribution to controlling the temperature of the central heating. For the main trials data, an ANOVA showed that there was the expected main effect of fault type (trials with a leak vs. trials with a break), F(l, 2) = 175.84, p .006. There was also an interaction of fault type with order of control, that is, whether operators experienced AA before M conditions or vice versa, F(l, 2) = 88.00, p = .011. However, although this is statistically significant, the absolute magnitude is negligible, averaging less than 1% per trial. Moreover, as discussed later, the order of control condition factor, while needed to control experimental variance, is largely meaningless in an applied context.
1 The apparent loss of degrees of freedom in this and several other tests is due to the way factors are nested in the experimental design. With reliability as a between-subjects random factor, order as a between-subjects fixed factor, and all other factors fixed and within-subjects, the resulting mixed model uses an interaction term that involves reliability (the random factor; Winer, Brown, & Michels, 1991, p. 326) as the error term. The result is a denominator with a much smaller degree of freedom than might be expected from the number of participants taking part in the experiment.
49
ADAPTIVE AUTOMATION
Table 2 Performance on Control of Heating System: Root Mean Square Error (RMSE) Scores in Degrees Condition
M
SD
RMSE pretrial RMSE posttrial RMSE no operator Before fault After fault RMSE with operator Before leak, AA-M Before leak, M-AA Before break, AA-M Before break, M-AA After leak, AA-M After leak, M-AA After leak, 100% reliability After leak, 100%, M After leak, 100%, AA After leak, 90% reliability After leak, 90%, M After leak, 90%, AA After leak, 70% reliability After leak, 70%, M After leak, 70%, AA
2.07 1.64
0.83 0.34
3.64 6.18
0.19 6.23
2.81 2.77 2.84 2.82 2.75 2.31 1.86 1.60 2.12 2.62 2.85 2.38 3.12 3.80 2.43
0.39 0.22 0.40 0.28 1.33 1.03 0.92 0.55 1.16 1.05 1.07 1.03 1.28 1.47 0.51
Note. Means and standard deviations of RMSE scores are functions of training, system reliability, type of fault, presence or absence of operator intervention, mode of control (manual [M] or automated [AA]), and order of experiencing control condition (manual before automated [M-AA] or vice versa [AA-M]). Data after a break are not meaningful and are omitted.
After a leak, operators had to manage the fault and continue to control the temperature of the HX output, but after a break, they had to shut down the plant. For leaks only can we analyze the effects of the fault on RMSE. An ANOVA on the RMSE after the occurrence of a leak showed a main effect of reliability, F(2, 24) = 6.35, p = .006, a main effect of order, F(l, 2) = 20.13, p = .046, and a Reliability X Mode of Control interaction, F(2,24) = 4.76, p = .018. Table 2 shows the magnitude of these effects. The RMSE nearly doubles as the automated fault-management reliability changes from 100% to 70%. RMSE is slightly lower if the M condition is encountered before the AA condition, and whereas under AA the RMSE is almost identical at all levels of reliability, there is a great increase in RMSE as reliability decreases if control is M. Almost all the change seen in the main effect of reliability are due to changes under M control, but M control is not totally unsatisfactory. When the plant is very reliable, RMSE is actually lower under M than under AA; there is little difference between the two modes of control when the reliability is 90%, and only when reliability falls to 70% does the RMSE in M become substantially greater than the mean in AA. A post hoc SchefK test on the interaction revealed that the significant differences arise because both the M and AA RMSE at 100% reliability are lower than the M RMSE at 70% reliability, p = .029 and p = .002, respectively. There was no difference between the RMSE under AA as a function of reliability, but the RMSE under M increased progressively with falling reliability. Apparently, even when automated diagnosis is rather unreli-
able, automation is still valuable because the efficiency of dealing with leaks using automation outweighs the automated diagnostic unreliability. When fault diagnosis is unreliable, operators scan many of SCARLETT'S components to estimate flow rates, pump settings, pressure heads, and so forth, to decide whether the diagnosis is correct, diverting attention from the temperature control. Operators seem poor at dividing their attention between temperature control and fault management. More evidence for this is presented in relation to false shutdowns. Second Task: Fault Management Probability of Accidents In this analysis, we treated all the accidents defined in the Method section as equivalent. An ANOVA showed a main effect of reliability, F(2, 24) = 9.83, p < .001, and a main effect of mode of control, F(l, 2) = 438.86, p = .002 (see Table 3). As reliability falls from 100% to 70%, the probability of an accident increases from .19 to .41. Accidents are far more probable in the M mode of control than in the AA mode of control, indicating that automation is justified for fault management. There was an implicit main effect of type of fault and implicit interactions of fault type and mode of control because no accidents occurred during leaks. The difference between the AA and M conditions varied with faults. When we considered the response times, the probability of accidents was related to fault dynamics, which differ greatly depending on where in the system the break occurs. Of the 218 shutdowns that were handled by the AA fault-management system, there were 50 cases in which the shutdown was performed prior to warning the operator (BreakLl,SVL7). Loss of Fluid During Faults Operators were told to minimize die loss of fluid because a large loss of fluid would damage the plant, either by flooding the installation, by emptying a hot reservoir, or by allowing the circulation pump to suck air with consequent mechanical damage because of vibration. Loss of fluid, measured in liters, was a measure of operator efficiency.
Table 3 The Probability of Accidents as a Function of the Reliability of the Automated Fault Management System and Mode of Control Condition Reliability 100% 90% 70% Mode AA M Note.
M
SD
0.19 0.25 0.41
0.20 0.25 0.20
0.12 0.44
0.15 0.19
AA = adaptive automation; M = manual control.
50
MORAY, INAGAKI, AND ITOH
An ANOVA on the amount of fluid lost showed a main effect of the type of fault, with breaks losing more fluid than leaks, F(l, 2) = 2160.22, p < .001, and a three-way interaction of Reliability X Control Mode X Fault Type, F(2, 23) = 4.63, p = .020. The data are shown in Table 4, and the three-way interaction is shown in Figure 3. The three-way interaction is straightforward. When a leak caused a slow loss of fluid, less fluid was lost under M control than under AA, but only if the AA fault-management system was more than 70% reliable. As AA became less reliable and the probability of incorrect diagnoses increased (hence automated actions might be inappropriate), this advantage disappeared, although the effect was slight. The maximum loss for a leak (when the AA is in control and 90% reliable) is just over 100 L, and the minimum loss (in M control and 100% reliable) is about 44 L. In the case of a break, the rapid loss of fluid is five to six times greater, and at all levels of reliability, the loss under AA control is substantially less than under M control. Under the AA control at 100% reliability, the loss is reduced by nearly 40%. By contrast, under M control, changing reliability has no effect on the loss of fluid during breaks, which is around 300 L in all cases. None of the fluid losses showed ceiling effects. In this system, humans are more efficient in managing fluid loss during small faults (leaks), especially when alarms are reliable; for severe problems with rapid dynamics, whether or not the displayed information is reliable, AA is more effective. This conclusion is certainly dependent on the dynamics of the system and the design of the human-machine coupling. The response to an alarm involves three stages of information processing: detection, diagnosis, and action. The total tune required for all three determines the fluid loss. In most cases, die AA has a built-in delay to allow time for the human to override a proposed intervention (see Table 1), and because rate of loss is low in leaks, operators can complete their decision before much fluid is lost, apparently in less time than the delay built into the AA. Hence, operators have an edge in these conditions. By contrast, when a pipe breaks, the rate of loss is so great that even when the AA waits to allow a veto by the operator, it will still implement the necessary shutdown action faster than the operators for a net
350
300-
250
250-
s 1 £
200-
100-
50
50-
0-
70%
70%
90% 100%
Figure 3. Means and standard errors of fluid loss in the three-way interaction between reliability of automated fault-management system, mode of control (adaptive automation [AA] and manual [M]), and type of fault Filled circles represent breaks and open circles represent leaks.
gain in performance. This is particularly true when the AA fault-management system is 100% reliable. The importance of the dynamics of the AA faultmanagement system relative to that of the operators and of both relative to the dynamics of the plant under fault conditions is emphasized if we look at the response times of the operators. Figure 4 is a time-reliability plot (Dougherty & Fragola, 1988) for response to leaks, showing the proportion of operators who have responded as a function of
Reliability 70%
Adaptive automation Leak Break Manual Leak Break
M
100%
90%
SD
100%
CONTROL: M
CONTROL: AA
Table 4 Quantity (in Liters) of Fluid Lost During Leaks and Breaks as a Function of the Reliability of the Automated Fault Management System and the Mode of Control
Mode and fault
90%
M
SD
M
SD
76.65 266.10
29.85 56.02
106.05 284.08
79.73 114.74
56.22 189.37
22.43 38.59
90.00 305.16
40.45 105.88
78.63 323.87
63.66 77.62
43.95 306.69
17.76 70.04
ADAPTIVE AUTOMATION
100
>§, 10
0.01
0.05
0.10
0.25
0.5 075
090
095
099
Proportion of responses completed Figure 4. Time-reliability curve in response to leaks. Each point represents the mean performance of one operator. The curve shows the proportion of operators who have responded as a Junction of time elapsed since the alarm.
time since the warning that a leak has occurred, combined for all leaks. Each point represents the average performance for one operator over all conditions. Even the slowest operators responded within about 15 s, which is adequate to control loss of fluid in leaks; there is a delay of 25 s to allow operators to override the AA, and the loss rate is only about 3 L/s. This is also reflected in the fact that in AA mode, the automation only intervened on 42 out of 300 possible occasions when leaks occurred. By contrast, Figure 5 shows a series of survival functions for operator response times to breaks in M mode. These show the proportion of operators who had not yet shut down the plant as a function of time elapsed since die "Break!" alarm. In controlling breaks, the AA system shut the system down on
20
51
218 of 300 possible occasions, showing that operators were relatively slow to respond. The delays before the AA fault-management system intervened for the six different breaks are shown in Table 1: Break 1, 0 s (computer then informs operator post hoc that it has had to act), accident would occur at 10 s; Break 2 and Break 6, 10 s delay to permit override command, accident would occur at 15 s; Break 3, Break 4, and Break 5,18 s delay to permit override command, accident would occur between 20 and 120 s. Figure 5 shows that only about 30% of operators managed to complete a manual shutdown for Break 1 in less than 10s. About 75% managed to control Break 2,90% Break 6,95% Break 3,95% Break 4, but only 70% Break 5, even though it has a long time constant. There was a complex interaction between fault dynamics, plant complexity (where in the plant the fault occurs), and the limitations of human information processing as a function of the particular fault. The degree of generalization that one can make from a single experiment, even a microworld, is restricted. Different experimental scenarios can produce very different impressions in realistic tasks. (For examples of this problem hi the area of nuclear power interface design, see Moray et al., 1993; Vicente etal., 1996.) Probability of False Shutdowns A false shutdown was defined as a shutdown performed either by a human or by the AA fault-management system when a leak occurred, was diagnosed by the system as a break, and, therefore, the system was shut down unnecessarily. (There were no shutdowns by human operators in the absence of alarms and warning messages.) The data are shown in Table 5. The ANOVA showed a significant main effect of reliability, F(2, 24) = 25.56, p < .0001. The probability of a false shutdown declined from .25 at 70%
30
40
Time since Break In seconds
Figure 5. Survival function curves in response to breaks at locations L1-L6. Each curve represents the proportion of people who have not yet responded to the break as time passes since the alarm. Each curve ends at the time when the accident occurs for that break.
52
MORAY, INAGAKI, AND ITOH
Tables Probability of False Shutdowns as a Function of the Reliability of the Automated Fault Management System and the Mode of Control Reliability 90%
70%
100%
Mode
M
SD
M
SD
M
SD
Adaptive automation Manual
0.32 0.20
0.09 0.09
0.11 0.11
0.10 0.09
0.03 0.03
0.07 0.05
reliability to effectively 0 at 100% reliability, where the small nonzero value represents false shutdowns in M mode. There was also an interaction of reliability and mode of control, F(2, 24) = 4.80, p = .018. At high levels of reliability, there was no difference between M and AA control on the probability of false shutdowns (p = .03 vs. p = .10). When AA was only 70% reliable, more false shutdowns occurred in AA mode than in M (p - .33 vs. p = .20). The conclusion is that if the payoff structure of the task makes it important to avoid false shutdowns, then human operators should be retained, particularly if there is any unreliability in the automated fault-diagnosis systems. An interesting question is raised by comparing this interaction with that found in the RMSE measures of the temperature control task. Those data showed a considerable increase in the RMSE after the occurrence of a leak, mainly at the 70% level of reliability. Is there a link between these two interactions?2 The calculation of the RMSE scores after a leak in Table 2 used data from all trials, whether the leak was correctly diagnosed or was falsely diagnosed as a break. If we divide such data into those obtained from trials with a correct leak diagnosis and those obtained from a false diagnosis of a leak as a break, we can account for the two interactions occurring together. Table 6 shows the RMSE and the time to respond (1TK) after the warning diagnosis was posted on the SCARLETT interface. We concentrate on the M control mode in the following analysis. The large overall RMSE scores for leaks at 70% reliability in Table 2 are caused by the way in which operators handled the leaks falsely diagnosed as breaks (1 as b). In Table 6, the RMSE scores at all levels of reliability following leaks correctly diagnosed as leaks (1 as 1) are very similar to the RMSE scores before leaks occurred, about 2.25°. However, after a leak diagnosed as a break, the RMSE value increased to more than 7°. Because there were only 10 cases of this increased RMSE compared with 90 cases of the leak diagnosed as a leak value at 90% reliability, the overall average in Table 2 does not differ significantly from the preleak value. However, at 70% reliability, there were 30 cases of leak diagnosed as break and only 70 cases of leak diagnosed as leak, and the resulting pooled average produces the significantly greater mean RMSE in Table 2. From Table 6, we can see, then, that the cause of the increase is solely the problem of handling leaks as breaks.
The TTR data show that there is a higher increased TTR to leaks as breaks. Operators respond to leaks as leaks in about 13 s at all levels of reliability, but the response time to leaks as breaks was around 25 s, with considerable variance. This would be dangerously long if there really were a break. It suggests that operators, particularly those who experience a high probability (p = .30) of false diagnoses, are prepared to make a real effort to detect false diagnoses to keep the temperature control task running. They spend considerable time examining what is happening, confirming that the dynamics are those of a leak, even when the automated diagnosis claims it is a break. Moray and Rotenberg (1989) and Wei, Macwan, and Wieringa (1998) have shown that operators faced with more than one task at a time in a complex system are very reluctant to time share control between them. In those experiments, operators saw that there were two simultaneous problems to solve but apparently preferred to perform them sequentially. This effect is sometimes called "cognitive lockup" (Sheridan, 1981) or "cognitive tunnel vision" (Moray, 1981) and would account for the fact that operators are efficient at avoiding false shutdowns but do so at the expense of an increased RMSE on the temperature control task. Subjective Judgments: Trust and
Self-Confidence
Recent work has shown that where operators can choose between manual and automated control, the relation between their trust in the efficacy of the automation and their self-confidence in their ability to exercise manual control plays a major role in dynamic allocation of function (Lee & Moray, 1992, 1994; Muir & Moray, 1996; Tan & Lewandowsky, 1996). We follow that research by analyzing trust and self-confidence to better understand the dynamics of function allocation. Trust The data are shown in Table 7. The chief effect is a highly significant main effect of reliability on the trust given by the operators to the automation, F(2, 24) = 25.80, p < .0001. The system is trusted less as reliability declines, with trust falling from over 8 to under 5 on a 10-point scale. There was also a statistically significant interaction of reliability with fault type, F(2, 24) = 6.83, p = .004, but the magnitude of the effect is less than 0.25 units on the 10-point subjective scale (3% of the range), is of no practical importance (Neter, Wasserman, & Kutner, 1998, p. 689), and is not discussed further, except to note that it is the unreliable diagnosis rather than any differential impact of different faults that is involved. This is shown in the time-series model described later. Combining these data with other measures in this study, we found that there seems to be little difference above 90% reliability, but changes in reliability had an increasingly strong effect below 90%. This may be due to poor calibra2
This analysis was suggested by one of the reviewers, to whom we are very grateful.
53
ADAPTIVE AUTOMATION
Table 6 Root Mean Square Error (RMSE) and Time to Respond (TTR) Means and Standard Deviations After Leaks, Divided Into Cases of True and False Diagnosis at Three Levels of Reliability and Two Modes of Control RMSE
TTR
Reliability
Mode
Diagnosis
M
SD
No. of cases
M
SD
70% 70% 70% 70% 90% 90% 90% 90% 100% 100%
AA AA M M AA AA M M AA M
lasl lasb lasl lasb lasl lasb lasl lasb lasl lasl
2.40 2.95 2.28 7.35 2.52 1.16 2.24 8.30 2.12 1.60
2.86 2.07 2.00 6.72 3.03 1.61 2.64 7.54 2.88 1.63
67 28 70 30 90 10 90 10 100 100
15.9 13.2 14.2 23.4 13.1 11.3 12.0 28.7 14.0 11.9
10.8 3.4 6.3 12.3 5.1 2.7 4.7 16.4 8.0 6.1
Note. True diagnosis of a leak as a leak is labeled 1 as 1, and false diagnosis of a leak as a break is labeled 1 as b. There were no cases of 1 as b at 100% reliability. RMSE is in degrees, and TTR is in seconds after the warning is displayed.
tion for the probability of unreliable diagnosis rather than an insensitivity to unreliability. If data were collected over many hours of interaction with SCARLETT, a difference between 100% and 90% reliability might appear as operators learned the real probability of faults in automated diagnosis. Self- Confidence Self-confidence was affected by order (whether M control trials were done before or after AA control trials), F(l, 2) = 19.97, p = .047. There were nearly significant effects of mode of control and fault type, but the magnitudes of these effects are less than 0.50 of a step on the 10-point rating scale (0.25 of the standard deviation, 5% of the range), and they are not further discussed. Self-confidence was independent of automation reliability, which seems at first surprising and is discussed later.
dynamic allocation of function. When T - SC was positive, operators in their experiments used automatic control; when it was negative, the operators used manual control. The value of T - SC in the current study can be found by combining the data of the last two analyses in Figure 6. Although T - SC is always positive, which suggests that operators would always use automation, Figure 6 suggests that if system reliability fell below 70%, T - SC would go negative, and operators would then, on the basis of odier studies cited, use manual control. However, there are several differences between the earlier studies and the present one,
Trust - Self-Control and the Allocation of Function In earlier studies by Lee and Moray (1992) and Tan and Lewandowsky (1996), the difference between trust and self-confidence (T - SC) played a key role in determining
Table 7 Operator's Subjective Trust in the Capability of the SCARLETT System as a Function of the Reliability of the Automated Fault-Management System and the Mode of Control
5-''
Reliability 70%
100%
90%
Mode
M
SD
Adaptive automation Manual
4.77 5.82
1.33 1.34
M
SD
7.58 7.50
1.34 1.00
M
H 08
70%
90%
100%
SD RELIABILITY
8.35 8.63
0.87 0.85
Note. SCARLETT = Supervisory Control and Response to Leaks: TARA at Tsukuba.
Figure 6. Means and standard errors of trust (T), self-confidence (SC), and the value of T - SC as a function of reliability of automated fault-management system. Open circles represent T, filled circles represent SC, and open squares represent T — SC.
54
MORAY, INAGAKI, AND ITOH
which make it impossible to pursue the analogy. In the studies by Lee and Moray (1992,1994) using the PASTEURISER microworld, there was no automated fault diagnosis, no possibility of preemption of control by the automation, no time-critical deadline, and all active subsystems of the process could be controlled either automatically or manually. The task in PASTEURISER was a continuous process control task, similar to, although more complex than, the temperature control task in SCARLETT. In SCARLETT, the automation can explicitly make a bid to take control (SVL 6 or 7), which was not the case in the PASTEURISER studies, which were all at SVL 3. It is therefore not fruitful to pursue the analysis of the value of (T - SC) in the present study. Why does trust, but not self-confidence, change dramatically as a function of reliability? We follow Lee (1991) and Lee and Moray (1994) and model the dynamics of trust and self-confidence using time-series analysis.
Time-Series Model of Trust and
Self-Confidence
Using STATISTICA, we applied a backward stepwise multiple regression analysis to 13 variables to identify the causal variables affecting trust and self-confidence, and a time-series model was developed for each, using the variables that significantly explained the variance in the regression model. The results were as follows. For trust, Tn = 2.78R/100 + 0.69Tn . , - 1.01Fn - 0.33F,, _ i - 0.46D, 0.32D, _ j (r2 = 0.752), where T is the rating of trust, R is the percentage reliability of automation, F is the occurrence of a false diagnosis, and D is the occurrence of a disagreement between the operator and the automation as to the diagnosis. F and D are treated as discrete (0,1) variables (F = 1 if there is a false diagnosis, otherwise F = 0; D = 1 if the operator disagrees with the diagnosis, otherwise D = 0). The subscripts (n and n - 1) indicate the current trial and the previous trial. For self-confidence, Sn = 0.69R/100 + 0.88Sn _ , - 0.92An + 0.72A, _ l (r2 = 0.73), where S is the rating of self-confidence, and A is the occurrence of an accident. A is a discrete (0, 1) variable (A = 1 if an accident happens, otherwise A = 0). Again, n and n - 1 are trial subscripts. An interesting property of the equations is that they converge, either from above or from below. If we assume that there are no disagreements (vetoes) and no false diagnoses, then the final value of trust tends asymptotically toward 2.78R/(100 [1 - 0.69]) = 0.09R = 9.0. In the limit, subjective trust would be self-calibrating to a level slightly below the objective reliability of the system. For selfconfidence, the series converges to 0.06R, giving an asymptotic value for self-confidence of around 6.00 if there are no accidents. The relative insensitivity of self-confidence to reliability is reflected in the small coefficient of R in the time-series equation. These models show that the causal factors driving the dynamics of trust are different from those driving selfconfidence. Trust seems to be reduced by properties of the system (real or apparent false diagnoses), whereas serfconfidence is reduced by experiences of the operator (experience of accidents). Reliability plays no part in the dynam-
ics of self-confidence, although exactly the same variables were entered into the multiple regression analysis for trust and for self-confidence. It is not surprising that Figure 6 shows an effectively flat self-confidence curve. Apparently, operators did not feel that automation unreliability reflected on their manual control ability: As Muir (1989) and Muir and Moray (1996) reported, operators can identify which subsystems of a complex plant are responsible for problems and can judge them independently of the system as a whole. The time-series models of trust and self-confidence dynamics were derived from the experimental data. The coefficients are valid only for those data, although we believe that the qualitative form of the relations are valid for other experiments, given appropriate values of the coefficients. Although the differences between the systems mean that the equations cannot be identical to those of Lee (1991), the role played by faults and accidents is interesting because Lee (1991) and Lee and Moray (1992) found that trust depended strongly on fault magnitude only in the recent (n, n - 1) past.3 Furthermore, the mathematical form of our equation means that trust changes rather slowly and steadily in the absence of false diagnoses and vetoes (at 100% reliability) but is markedly affected by the occasional occurrence of a false diagnosis, which is also evident in Lee's (1991) data on the occurrence of transient faults. It is also striking that as with Lee's model, only values at n and n - 1 contribute significantly to the current value of the predicted variable. Including earlier values further reduces the variance by only 5%. These similarities encourage us to believe that such models represent psychological factors that are more than task specific. There was one other significant effect in the ANOVA on self-confidence: the effect of order (whether M control trials are done before or after AA control trials), F(\, 2) = 19.97, p = .047. Operators felt more self-confident if they performed the task manually before performing it in AA mode. Order is not of great interest because people do not generally face balanced order conditions during training in real industrial systems; its importance here is an artifact of experimental design. We now consider the effects of different SVLs of automation. We have already discussed the difference between SVL 4 and the other levels because the M mode of intervention is SVL 4 (although detection and diagnosis was always automated, in principle, operators could also diagnose the system state from the display). We can distinguish SVL 6 from SVL 7 by examining the responses to Break LI, which was controlled at SVL 7, where the automation acts and then informs the operators of what it has done. It is particularly striking that there were no differences in trust or self-confidence ratings between SVL 7 and the other levels. The transfer of authority in the face of fast dynamic faults appears to be well tolerated. Some operators indicated
3 The Lee and Moray (1992) model of trust is as follows: Tn = 0.57Tn_! +0.06Perforaiancen-0.01Performancen_,-0.74Faultn + 0.30Fault,,_i, where performance is the percentage of possible product produced and fault is the magnitude of the fault (a continuous variable).
ADAPTIVE AUTOMATION
informally that when the severe Break LI was controlled automatically by SVL 7 automation, their feeling of selfconfidence increased, whereas others stated the contrary. Some dynamics of subjective attitudes have not been caught by our quantitative analyses.
Discussion What is the best balance between humans and automation, what is the best SVL, and how should it be implemented? There is no simple answer. The overall effectiveness of the human-machine system depends first on the complexity, difficulty, and dynamics of the incidents that have to be managed. Complexity here means that a leak or break of a given size may be much harder to understand when it occurs in one part of the plant than when it occurs in another. In one case, there may be a simple and immediate effect, whereas elsewhere, lags, integration, and so forth may render diagnosis opaque and management difficult (see also Moray et ah, 1993; Vicente et al., 1996). A leak at a given location will not always cause the same sequence of events because the pressure heads, pump rates, and so forth, which are current at the time of the fault, depend not on a predetermined experimental setting but on the behavior of the operator since the run began. In some respects, these experiments resemble field studies as much as classical factorial experiments, which is desirable so that the behavior and experience of operators resemble real work. Inagaki (1993, 1995) suggested that some faults occur so rapidly that manual intervention is impossible and gave proof of the necessity for automated preemption of control; Break LI here requires an instant reaction that can only be reliably performed by automation (70% of operators failed to avoid an accident). One is reminded of the difference between the accident at Three Mile Island, where the operators were able to manage the postincident shutdown using manual intervention over a period of many hours, and that at Chernobyl, where the runaway of the reactor in an unstable operating regime occurred far too fast for any manual intervention to be possible. The preferred mode of control also depends on the goal. SVL 7 has obvious advantages when dynamics are fast and safe shutdown has absolute priority. In such a case, control must be allocated to automation, as shown by Inagaki (1993, 1995). To avoid SVL 7 automation, one must guarantee that never will a hazardous event occur with dynamics too fast for human operators to manage, even in unforeseen beyonddesign-basis accidents. In the present case, automation was more effective than manual control in avoiding severe accidents, especially when the dynamics were fast, but operators were better at avoiding false shutdowns. Here again, there are parallels with industry. False shutdowns of nuclear or chemical plants are extremely costly. To decide which agent should have the final authority means examining the dynamics of the plant processes and prioritizing the costs and payoffs associated with different outcomes, in this case, the cost of accidents versus the cost of false shutdowns. SVL 4, or M control, even with diagnostic assistance, should be used only when one can guarantee that there will
55
be no time-critical hazardous events that may develop faster than the human can respond. SVL 6 is, in many ways, the most interesting. This level has the tightest coupling between human and automation and is the highest at which the demand that ultimate authority should be left with the human can be implemented. Again, the tradeoffs depend critically on properties of the system being controlled. If it is unreliable and if false shutdowns are to be avoided, SVL 6 allows the intelligence of the human to be used. However, time is again critical because the analysis of false diagnoses produces cognitive lockup in the operator. The answers to the questions posed earlier are as follows. 1. In at least some time-critical situations, overriding authority must be given to automation and appropriate sensors and safe decision rules implemented. This is already done in the nuclear industry, where a 20-min rule is widespread: When a scram occurs, operators must monitor the automatic safety systems for 20 min rather man trying to intervene immediately because of the known high error rates of operators under stress. 2. Trust is strongly affected by system reliability, but self-confidence is not, at least in a system in which operators can distinguish the tasks they perform manually from those performed by the automation and in which it is the latter mat are mainly affected by unreliability. In at least some systems, the factors affecting self-confidence are different from those affecting trust. 3. There is little effect of unreliability if reliability is at least 90%. Somewhere below that level, the effects of unreliability become widespread and important. (This result may change with prolonged experience by operators of low probability faults.) 4. Time-series models similar to those developed by Lee (1991) can be developed here. The rapid discounting of past events is common to the two investigations, despite differences in the plants and tasks, and both models emphasize the effects on trust of faulty or unreliable automation. Lewandowsky (personal communication, October 22,1998), who has been using neural nets to model trust and selfconfidence using PASTEURISER, points out that such nets can show rapid loss of the distant past. 5. Severe fast faults cause more accidents under fault management by humans than under AA in the system investigated here. 6. At least in SCARLETT, as fault-diagnosis reliability falls, humans are valuable for detecting false diagnoses and preventing false shutdowns. In a real system, the choice of SVL depends on the relative values and costs of accidents and false shutdowns. The balance between human control and AA and the choice of SVL is strongly affected by plant dynamics and the reliability of automated fault management. This last conclusion we believe to be valid far beyond this experiment. Experiments such as that described here are important for a theory of human-machine system design. As Rasmussen (Rasmussen et al., 1995), Vicente (1999), and others have often stated, no general feed-forward design solution exists. Allocation of function is not optimal if it is a once-and-forall decision made during design. AA in real time is necessary
56
MORAY, INAGAKI, AND 1TOH
for effective performance and fault management. In complex systems, control of allocation of function by feedback is required as well as the usual closed loop feedback control of process error. Dynamic allocation by AA is likely to be valuable, especially in complex systems in which priorities change rapidly under strong environmental constraints, high risk, and hazard. No context-free psychological laws exist that are sufficiently strong to predict performance in real industrial tasks and that, in general context, are at least as powerful as inherent contextual mechanisms throughout applied psychology and, indeed, biology as a whole (Cohen & Stewart, 1994, p. 285). This emphasizes the need to understand AA and the psychodynamics of trust, selfconfidence, and human-machine interaction. The classic problem of laboratory research remains: Can we generalize from this extremely constrained world to the real world of industry? Similar results have now been reported from different laboratories using different systems. These include Muir (1989) and Muir and Moray (1996), using the first version of PASTEURISER; Lee (1991) and Lee and Moray (1992, 1994), using a different version of PASTEURISER; Tan and Lewandowsky (1996), using another version of PASTEURISER; and Hiskes (1994) and Moray, Lee, and Hiskes (1994), using UIUC-CIM, a discrete manufacturing microworld. The findings, particularly with regard to the dynamics of trust and selfconfidence, are strikingly similar and suggest that we have here a real basis for understanding factors that make operators perform real-time dynamic allocation of function when exercising supervisory control. The present experiment includes an examination of where ultimate authority should lie (see also Parasuraman, 1993; Endsley, 1996; Scerbo, 1996). One of the most challenging questions for implementing AA is, "Which should control dynamic allocation, human or computer?" It is not easy to answer the question. Many support operator-initiated invocation of automation (Billings, 1991; Billings & Woods, 1994; Harris, Hancock, Arthur, & Caird, 1991; Hilburn, MoUoy, Wong, & Parasuraman, 1993; Scerbo, 1996), but some support system-initiated invocation of automation under time-critical or hazardous conditions (Harris, Goernert, Hancock, & Arthur, 1994; Sarter & Woods, 1994; Scerbo, 1996). Such results suggest that authority for function allocation should be situation dependent. Our results have been discussed with and accepted as ecologically valid by people in a variety of extralaboratory professions, including the military, civil aviation, various industries, and commerce, and are regarded as important by those concerned with real systems, not laboratory research. With the steady increase of automation and supervisory control throughout society, there is a real need for a scientific basis for defining the role of human operators, using quantitative as well as qualitative modeling. We believe that the time is ripe for moving from the laboratory to full scope simulator and even to industrial field studies and experiments, justifying the projected cost and risk by experiments conducted in complex but manageable laboratory settings such as SCARLETT.
References Amalberti, R. (1992). Safety in process-control: An operatorcentered point of view. Reliability Engineering and System Safety, 38,99-108. Billings, C. E. (1991). Human-centered aircraft automation philosophy: A concept and guidelines (Tech. Memo. No. 103885). Moffett Field, CA: National Aeronautics and Space Administration. Billings, C. E. (1997). Aviation automation: The search for a human-centered approach. Mahwah, NJ: Erlbaum, Billings, C. E., & Woods, D. D. (1994). Concerns about adaptive automation in aviation systems. In M. Mouloua & R. Parasuraman (Eds.), Human performance in automated systems: Current research and trends (pp. 264-269). Hillsdale, NJ: Erlbaum. Cohen, J., & Stewart, I. (1994). The collapse of chaos. New York: Viking. Dougherty, E. M., & Fragola, J. R. (1988). Human reliability analysis. New York: Wiley. Endsley, M. R. (1996). Automation and situation awareness. In R. Parasuraman & M. Mouloua (Eds.), Automation and human performance: Theory and applications (pp. 163-181). Mahwah, NJ: Erlbaum. Endsley, M. R., & Kaber, D. B. (in press). Level of automation effects on performance, situation awareness and workload in a dynamic control task. Ergonomics. Endsley, M. R., & Kiris, E. O. (1995). The out-of-the-loop performance problem and level of control in automation. Human Factors, 37, 381-394. Hancock, P. A., & Chignell, M. H. (Eds.). (1989). Intelligent interfaces: Theory, research, and design. Amsterdam: NorthHolland. Hancock, P. A., & Scallen, S. F. (1998). Allocating functions in human-machine systems. In R. Hoffman, M. Sherrick, & J. Warm (Eds.), Viewing psychology as a whole: The integrative science of William N. Dember (pp. 509-539). Washington, DC: American Psychological Association. Harris, W. C., Goernert, P. N., Hancock, P. A., & Arthur, E. (1994). The comparative effectiveness of adaptive automation and operator initiated automation during anticipated and unanticipated task load increases. In M. Mouloua & R. Parasuraman (Eds.), Human performance in automated systems: Current research and trends (pp. 40-44). Hillsdale, NJ: Erlbaum. Harris, W. C., Hancock, P. A., Arthur, E., & Caird, J. K. (1991, September). Automation influences on performance, workload, and fatigue. Paper presented at the 35th annual meeting of the Human Factors Society, San Francisco. Hilburn, B., Molloy, R., Wong, D., & Parasuraman, R. (1993). Operator versus computer control of adaptive automation. Proceedings of the Seventh International Symposium on Aviation Psychology, 161-166. Hiskes, D. J. (1994). Trust, self-confidence, and the allocation of function in discrete manufacturing systems (Tech. Rep. No. EPRL-94-02). Engineering Psychology Research Laboratory, Mechanical Engineering Department, University of Illinois at Urbana-Champaign. Inagaki, T. (1993). Situation-adaptive degree of automation for system safety. Proceedings of the 2nd IEEE International workshop on Robot and Human Communication, 231-236. Inagaki, T. (1995). Situation-adaptive responsibility allocation for human-centered automation. Transactions of the Society of Instrument and Control Engineers of Japan, 31(3), 292-298. Inagaki, T., & Itoh, M. (1996). Trust, autonomy, and authority in human-machine systems: Situation-adaptive coordination for
ADAPTIVE AUTOMATION
systems safety. Proceedings of Meeting on Cognitive Systems Engineering for Process Control, 176-183. Inagaki, T., & Johannsen G. (1992). Human-computer interaction and cooperation for supervisory control of large-complex systems. In F. Pichler & R. Moreno Diaz (Eds.), Computer aided system theory, proceedings EUROCAST '91: Second international workshop on computer aided systems theory (pp. 281— 294). Krems, Austria: Springer-Verlag. Kaber, D. B., Omal, E., & Endsley, M. R. (1999). Level of automation effects on telerobot performance and human operator situation awareness and subjective workload. In M. W. Scerbo & M. Mouloua (Eds.), Automation technology and human performance: Current research and trends (pp. 165169). Mahwah, NJ: Erlbaum. Kantowitz, B. H., & Sorkin, R. D. (1987). Allocation of functions. In G. Salvendy (Ed.), Handbook of human factors (pp. 355369). New York: Wiley. Lee, J. D. (1991). Trust, self-confidence and operators'adaptation to automation. Unpublished doctoral dissertation, University of Illinois at Urbana-Champaign. Lee, J. D., & Moray, N. (1992). Trust, control strategies and allocation of function in human-machine systems. Ergonomics, 35,1243-1270. Lee, J. D., & Moray, N. (1994). Trust, self confidence and operators' adaptation to automation. International Journal of Human-Computer Studies, 40, 153-184. Moray, N. (1981). The role of attention in the detection of errors and the diagnosis of failures in man-machine systems. In J. Rasmussen & W. B. Rouse (Eds.), Human detection and diagnosis of system failures (pp. 185—198). New York: Plenum Press. Moray, N., Jones, B., Rasmussen, J., Lee, J., Vicente, K., Brock, R., & Djemil, T. (1993). Development of a performance indicator for the effectiveness of human-machine interfaces for nuclear power plants (Tech. Rep. No. UILU-ENG-92-4007). Washington, DC: U.S. Nuclear Regulatory Commission. Moray, N., Lee, J. D., & Hiskes, D. (1994). Why do people intervene in the control of automated systems? In M. Mouloua & R. Parasuraman (Eds.), Human performance in automated systems: Current research and trends (pp. 15-21). Hillsdale, NJ: Erlbaum. Moray, N., & Rotenberg, I. (1989). Fault management in process control: Eye movements and action. Ergonomics, 32, 13191342. Mouloua, M., & Koonce, J. M. (Eds.). (1997). Human-automation interaction: Research and practice. Mahwah, NJ: Erlbaum. Mouloua, M., & Parasuraman, R. (Eds.). (1994). Human performance in automated systems: Current research and trends. Hillsdale, NJ: Erlbaum. Muir, B. M. (1989). Operators' trust in and use of automatic controllers in a supervisory process control task. Unpublished doctoral dissertation. University of Toronto, Toronto, Ontario, Canada. Muir, B. M. (1994). Trust in automation: Part 1. Theoretical issues in the study of trust and human intervention in automated systems. Ergonomics, 37, 1905-1923. Muir, B. M., & Moray, N. (1996). Trust in automation: Part H Experimental studies of (rust and human intervention in a process control simulation. Ergonomics, 39, 429-461. Neter, J., Wasserman, W., & Kutner, M. H. (1998). Applied linear statistical models. Homewood, IL: Irwin. Norman, D. A. (1990). The "problem" with automation: Inappropriate feedback and interaction, not "over-automation." Philosophical Transactions of the Royal Society of London, Series B, 327, 585-593.
57
Parasuraman, R. (1993). Effects of adaptive function allocation on human performance. In D. J. Garland & J. A. Wise (Eds.), Human factors and advanced aviation technologies (pp. 147158). Daytona Beach, FL: Embry-Riddle Aeronautical University Press. Parasuraman, R., & Mouloua, M. (Eds.). (1996). Automation and human performance: Theory and applications. Mahwah, NJ: Erlbaum. Parasuraman, R., & Riley, V. (1997). Humans and automation: Use, misuse, disuse, abuse. Human Factors, 39,230-252. Rasmussen, J., Pejtersen, A-M., & Goodstein, L. (1995). Cognitive engineering: Concepts and applications. New York: Wiley. Sanderson, P. M. (1989). The human planning and scheduling role in advanced manufacturing systems: An emerging human factors role. Human Factors, 31, 635-666. Sarter, N., & Woods, D. D. (1994). Pilot intention with cockpit automation II: An experimental study of pilot's mental model and awareness of the Flight Management System (FMS). International Journal of Aviation Psychology, 4,1-28. Sarter, N., & Woods, D. D. (1995). Autonomy, authority, and observability: Properties of advanced automation and their impact on human-machine coordination. In Proceedings of the 6th IFAC/1FIP/IFORS/IEA symposium on analysis, design and evaluation of man-machine systems (pp. 149-152). Cambridge, MA: Pergamon Press. Scerbo, M. W. (1996). Theoretical perspectives on adaptive automation. In R. Parasuraman & M. Mouloua (Eds.), Automation and human performance: Theory and applications (pp. 267-280). Mahwah, NJ: Erlbaum. Scerbo, M. W, & Mouloua, M. (Eds.). (1999). Automation technology and human performance: Current research and trends. Mahwah, NJ: Erlbaum. Sheridan, T. B. (1976). Towards a general model of supervisory control. In. T. B. Sheridan & G. Johannsen (Eds.), Monitoring behavior and supervisory control (pp. 271-282). New York: Plenum Press. Sheridan, T. B. (1981). Understanding human error and aiding diagnostic behavior in nuclear power plants. In J. Rasmussen & W. B. Rouse (Eds.), Human detection and diagnosis of system failures (pp. 19-36). New York: Plenum Press. Sheridan, T. B. (1987). Supervisory control. In G. Salvendy (Ed.), Handbook of human factors (pp. 1243-1268). New York: Wiley. Sheridan, T. B. (1992). Telerobotics, automation, and human supervisory control. Cambridge, MA: MIT Press. Sheridan, T. B. (1997). Supervisory control. In G. Salvendy (Ed.), Handbook of human factors (2nd ed., pp. 1295-1327). New York: Wiley. Sheridan, T. B., & Johannsen, G. (Eds.). (1976). Monitoring behavior and supervisory control. New York: Plenum Press. Sheridan, T. B., & Verplank, W. L. (1978;. Human and computer control of undersea teleoperators (Tech. Rep.). Man—Machine Systems Laboratory, Department of Mechanical Engineering, Massachusetts Institute of Technology, Cambridge, Massachusetts. Tan, G., & Lewandowsky, S. (1996). A comparison of operator trust in humans vs. machines. Cyberg International Electronic Ergonomics Conference. Available: http://www.curtin.edu.au/ coirference/cyberg/centre/outline.cgi/frame?dir=tan. Towill, D. R. (1974). A model for describing process operator performance. In E. Edwards & F. Lees (Eds.), The human operator in process control. London: Taylor and Francis. Vicente, K. J. (1999). Cognitive work analysis: Towards safe, productive and healthy computer-based work. Mahwah, NJ: Erlbaum.
58
MORAY, INAGAKI, AND ITOH
Vicente, K. J., Moray, N., Lee, J. D., Rasmussen, J. D., Jones, B. G., Brock, R., & Djemil, T. (1996). Evaluation of a Rankine cycle display for nuclear power plant monitoring and diagnosis. Human Factors, 33, 506-523. Wei, Z-G. (1997). Mental load and performance at different automation levels. Delft, Netherlands: Delft University of Technology. Wei, Z-G., Macwan, A. P., & Wieringa, P. A. (1998). A quantitative measure for the degree of automation and its relation to system performance and mental load. Human Factors, 40, 277-295. Wickens, C. D. (1995). Designing for situation awareness and trust in automation. In G. Johannsen (Ed.), Integrated systems engineering (pp. 365-370). Oxford, England: Elsevier Science. Wiener, E. L. (1989). Human/actors of advanced technology ("glass cockpit") transport aircraft (Tech. Rep. No. 177528). Moffet Field, CA: National Aeronautics and Space Administration.
Winer, B. J., Brown, D. R., & Michels, K. M. (1991). Statistical principles in experimental design (3rd ed.). New York: McGraw-Hill. Woods, D. D. (1989). The effects of automation on human's role: Experience from non-aviation industries. In D. A. Norman & H. Orlady (Eds.), Flight deck automation: Promises and realities (NASA Publication No. CP-10036, pp. 61-85). Moffet Field, CA: National Aeronautics and Space Administration. Woods, D. D., & Roth, E. M. (1988). Cognitive systems engineering. In M. Helander (Ed.), Handbook of human-computer interaction (pp. 3^t3). Amsterdam: North-Holland.
Received April 23, 1998 Revision received April 16, 1999 Accepted April 27, 1999
New Editors Appointed, 2001-2006 The Publications and Communications Board of the American Psychological Association announces the appointment of seven new editors for 6-year terms beginning in 2001. As of January 1,2000, manuscripts should be directed as follows: •
For the Journal of Abnormal Psychology, submit manuscripts to Timothy B. Baker, PhD, Department of Psychology and CTRI, 7255 Medical Sciences Center, BOO University Avenue, University of Wisconsin Medical School, Madison, WI53706.
•
For the Journal of Comparative Psychology, submit manuscripts to Meredith West, PhD, Department of Psychology, 1101 E. 10th Street, Indiana University, Bloomington, IN47405-7007. • For the Journal of Experimental Psychology: Learning, Memory, and Cognition, submit manuscripts to Thomas O. Nelson, PhD, Psychology Department, University •
of Mary land, College Park, MD 20742-4411. For the Journal of Personality and Social Psychology: Attitudes and Social Cognition section, submit manuscripts to Patricia Devine, PhD, Department of Psychology, University of Wisconsin—Madison, 1202 West Johnson Street, Madison, WI 53706-1696.
•
For Professional Psychology: Research and Practice, submit manuscripts to Mary Beth Kenkel, PhD, California School of Professional Psychology—Fresno, 5130 East Clinton Way, Fresno, CA 93727. • For Psychological Review, submit manuscripts to Walter Mischel, PhD, Department of Psychology, 406 Schermerhorn Hall, Columbia University, New York, NY 10027. • For Psychology, Public Policy, and Law, submit manuscripts to Jane GoodmanDelahunty, JD, PhD, 2407 Calle Madiera, San Clemente, CA 92672. Manuscript submission patterns make the precise date of completion of the 2000 volumes uncertain. Current editors, Milton E. Strauss, PhD; Charles T. Snowdon, PhD; James H. Neely, PhD; Arie Kruglanski, PhD; Patrick H. DeLeon, PhD, JD; Robert A. Bjork, PhD; and Bruce D. Sales, JD, PhD, respectively, will receive and consider manuscripts through December 31,1999. Should 2000 volumes be completed before that date, manuscripts will be redirected to the new editors for consideration in 2001 volumes.