Computing, Information Systems & Development Informatics Vol. 3 No. 5 , December , 2012
ADAPTIVE GENETIC ALGORITHM FOR STUDENTS’ ALLOCATION TO HALLS OF RESIDENCE USING ENERGY CONSUMPTION AS DISCRIMINANT Ibitola, A. Department of Computer Science Lead City University Ibadan, Nigeria
[email protected] Monyei, G.C. Department of Electrical and Electronic Engineering University of Ibadan Ibadan, Nigeria
[email protected]
ABSTRACT Enjoying the benefits of Distributed Generation (DG) is consequent on its flexibility and ability for control. Incorporating Distributed Energy Resources (DERs) into existing power grid through a Virtual Power Plant (VPP) in a bid to decentralizing power generation by generating at load centers provides a frame work for influencing its operation. This control via software thus offers us an opportunity in exploiting the varied benefits DG seeks to offer. This paper thus examines such exploitation of DG in Independence Hall, in the University of Ibadan. In exploiting this benefit, the controllability of the DG and its subsequent upgrade is used in influencing the allocation of students into Independence Hall. Constraints such as hall size (minimum and maximum), per unit and total hall allocation in terms of energy and the difference between the cost of upgrade and energy savings are used in feeding a Genetic Algorithm (GA) in generating varied options from which choice can be made based on prevailing circumstances. Keywords: genetic algorithm, distributed generation, distributed energy resources, virtual power plant, exploiting.
1. INTRODUCTION The University of Ibadan has in recent years seen an upsurge in the number of students’ application and subsequent admittance into the varied disciplines the University offers. This rise no doubt yields a concurrent increase in the number of students, ‘freshers’, which are being allocated to the halls of residence scattered within the University Community. In trying to manually allocate students to residential halls, a lot of problems are being faced by the Management Information System (MIS) Department of the University. Adequately allocating eligible fresh students, reserving adequate bed spaces for eligible ‘stale’ students, ensuring that available facilities like kitchenettes, bathrooms, cafeteria, butteries etc. are not overstretched, creating a balance between ‘fresh’ and ‘stale’ students, ensuring an even distribution of bed spaces among the different categories of ‘stale’ students, ensuring that the prescribed energy allocation to each hall is not exceeded etc. are some of the criteria used in students’ allocation. The daunting enormousness of this task thus presents a challenge to the University. As the University grapples with this enormous task of students’ allocation to residential halls, reducing its Green House Gas (GHG) Emissions by sourcing an increasing part of its energy from alternative energy sources (renewables) like Photovoltaic (PV) arrays, wind turbines, micro hydro and biomass is paramount. As surmised by Odubiyi [5], demand will continue to outstrip supply (in the short to medium term), hence sourcing for alternative energy sources becomes imperative [2].
As posited by Monyei [2], University of Ibadan in meeting this objective has been installing a lot of stand-alone solar inverter systems while exploring the feasibility of incorporating wind, hydro and biomass in a hybrid system. Their stochastic nature albeit, a proposed incorporation of Virtual Power Plants (VPPs) to even out the discrepancies between demand and supply and aggregate available Distributed Energy Resources (DERs) has been proposed [2] [6] [7]. One reason being put forward though for poor investment in this proposed option is cost. The University Management opines that with insufficient allocation it is constrained to evenly distribute this scarce resource (money) among relevant projects within the University Community. It further posits that it is incapacitated in increasing its annual generation from renewables which is key to reducing the contribution of fossil fuels to the University’s power generation. In seeking to proffer a solution to the plethora of problems confronting the University Management, Artificial Intelligence (AI) is used. The advent and popularization of stochastic evolutionary methods like Genetic Algorithm (GA) and Simulated Annealing (SA) is made possible due to their being able to exit a local minimum and reach a global optimum in optimization problems.
31
Computing, Information Systems & Development Informatics Vol. 3 No. 5 , December , 2012
The solution presents the University constraints in form of equations. In optimizing the equations, GA is used in providing initial values, while component parts of the equations are optimized using individual constraints imposed on them. In exploring and exploiting the benefits of GA, multiple possible solutions are generated based on predefined cost functions.
2. GENETIC ALGORITHM As posited by Yildiz and Ozturk [8], the inefficiency of traditional methods in solving complex nature problems has forced researchers in evolving new approaches. This has led to new approaches (e.g. evolutionary algorithms (EA), GAs, Simulated Annealing (SA), ant colonies etc.) in the area of optimization (Pengfei et al [1] define optimization as the process of making something better) research. Nwaoha et al [4] define GA to be an optimization and search technique based on the principles of genetics and natural selection. This view is further reified by Pengfei et al [1] who opine that GA is an optimization algorithm intended to mimic some of the processes observed in natural selection. [4] further posit that GA is a stochastic search technique based on the mechanism of natural selection and natural genetics. GA was first introduced by John Holland in the early seventies and was popularized by one of his students, Goldberg who was able to solve a difficult problem involving the control of gas-pipeline transmission in his dissertation [4] [1]. GAs are based on Darwin’s Evolution Theory that individuals better adapted to their environments are the ones which effectively reproduce [3].
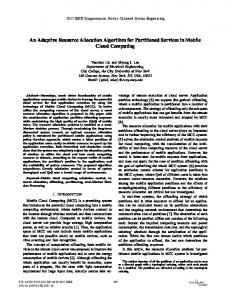
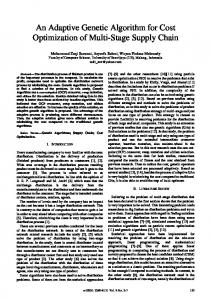
From the foregoing therefore, GAs as stochastic search algorithms basically iterate through a population mimicking Darwin’s Evolution Theory, eliminate unfit species (based on predefined fitness functions or objectives), reproduce off-springs (amongst fittest selected parents) and mutate the new population (by introducing traits in their genes). In designing a GA code therefore, a population needs to be defined (fig. 2). This sample space provides the environment for the activities of the GA. In defining the sample population, different methods could be used depending on the problem formulation and choice of the designer – binary, continuous, steady-state and multiobjective [4]. For the problem at hand, the binary GA method is used because of its ease of programming and ability to constrain its values to be within limits while generating a sample population. Thereafter, a fitness function is defined. This fitness function provides the GA intelligence in screening out unfit chromosome strings from the population (fig. 4) or in the eventual selection process. Each chromosome string (fig. 3) corresponding to a solution is tested using the fitness function as a discriminant and their results are collated. Those with values coalescing around zero (optimal result) are considered better answers while those with values further dispersed from zero are considered poorer solutions (fig. 5). Elitism as used in the flowchart (fig. 1) means the selection of the top best results, those with results closest to zero. In filling the now depleted population, cross-over operation (fig. 6) is performed between the elitist solutions to generate off-springs who are going to compete with their parents in the next generation. Mutation operation is performed (fig. 7) to alter the gene construct of selected chromosomes in order to prevent the program from getting stuck in a local minimum.
32
Computing, Information Systems & Development Informatics Vol. 3 No. 5 , December , 2012
Start
001101110----------0 0 | | | | | | | | | |--------| 0 0 1 1 1 0 1 1 1 1 1 0 0 0 1 0 0 1 0 - - - -1
Population size
Variant distinction
Chromosome string M x N population matrix
Fig. 2
Define fitness function Fitness scaling
00110111001111111110
Fig. 3
selection Binary substrings corresponding to a variable for determination
Elitism Cross over
Chromosome string 00110111001111111110 01000001001110000111 11110001100000010010 00000100100000111111 11111100100100000010 10000100111101010110 00100110111010101110 11010000000001001101
Mutation
No Converge? Yes End
Chromosome string
Fig. 1: flow chart of proposed GA
Fig. 5
00000100100000111111 01000001001110000111 00110111001111111110 11111100100100000010 00100110111010101110 11110001100000010010 10000100111101010110 11010000000001001101
Penalty 2 0 10 -3 5 19 6 23 penalty -3 0 2 5 6 10 19 23
Initial population matrix with corresponding penalty Fig. 4 Elitist chromosomes with the lowest penalty Chromosomes with penalty ranked Cross-over point
Chromosome string
Fig. 6
00000100100000111111 01000001001110000111 00110111001111111110 11111100100100000010 00000111001111111110 01000100100100000010 00110100100000111111 11111001001110000111
Chromosome String
Fig. 7
00000100100000111111 00000011101110000111 01111111001111111110 11111101100100000010 00000111000111111110 01000100100100000010 00100100100000111111 11111001001110000110
33
Penalty -3 0 2 5 1 7 54 9
Elitist parents and off-springs Elitist parents in new matrix New off-springs after elitist parents have mated
Penalty -3 0 2 5 1 7 54 9
Mutated bit of chromosome
Computing, Information Systems & Development Informatics Vol. 3 No. 5 , December , 2012
3. DERIVATIVES Total power consumed by fresh students per iteration is given as: x Tpfi = ∑ (bmi*k) in kilowatts ------------------------------- (1) i=1 Total power consumed by ‘stale’ students per iteration is given as: y
bi represents the ith total number of student per iteration. For every ith iteration, the GA code based on the hall constraints given subsequently generates x and y values respectively. For every x and y value generated, the contributions of the ‘fresh’ and ‘stale’ students in defraying the investment in increasing the DG capacity are computed using the Fc, Fr and Tf supplied. The contribution of the grid (Pgci in kilowatts) is the shortfall of the DG’s contribution (Pdgi in kilowatts) to meeting the total energy consumption estimate (Tpi in kilowatts) for every ith iteration. qmin ≤ x ≤ qmax ------------------------------------------------ (6)
Tpsi = ∑ (bni*k) in kilowatts -------------------------------- (2) i=1
wmin ≤ y ≤ w max ----------------------------------------------- (7)
Total power from the DG units per ith iteration is denoted as Pdgi and is given as: z
x + y ≤ hmax --------------------------------------------------- (8)
Pdgi = ∑ ( ei ) in kilowatts ---------------------------------- (3) i=1
qmin + wmin ≥ hmin ------------------------------------------- (10)
x + y ≥ hmin ---------------------------------------------------- (9)
qmax + wmax ≤ hmax ------------------------------------------ (11) Total power consumed per iteration is given as: n x y Tpi = ∑ (bi * k) = ∑ (bmi * k) + ∑ (bni * k) in kilowatts (4) i=1 i=1 i=1 Estimated energy savings per ith iteration is given as: Tsi =( Pdgi + Pgi – Tgi ) in kilowatts ------------------------ (5) Fixed investment in increasing the capacity of the DG yearly is given as Tf in naira. The percentage contribution of new students is denoted by Fc (%). The percentage contribution of returning students is denoted by Fr (%). Fixed power from the schools grid per ith iteration is given as Pgi in kilowatts. Grid contribution per ith iteration is given as P gc in Kilowatts. Where: n denotes the total number of students that are allocated to the hall per run time. k denotes the average power consumption per student in kilowatts. x denotes total number of fresh students per ith iteration. y denotes total number of ‘stale’ students per ith iteration. z denotes total number of DG units per ith iteration. e denotes the Kilowatt rating of each DG unit per ith iteration. bmi represents the ith fresh student per iteration. bni represents the ith ‘stale’ student per iteration.
Where: qmin denotes the minimum number of ‘fresh’ students that are to be allocated to the hall. qmax denotes the maximum number of ‘fresh’ students that are to be allocated to the hall. wmin denotes the minimum number of ‘stale’ students that are to be allocated to the hall. wmax denotes the maximum number of ‘stale’ students that are to be allocated to the hall. hmin denotes the minimum number of students to be allocated to the hall. hmax denotes the maximum number of students to be allocated to the hall. The GA thus provides us with options and the ability to choose from a variety of possible solutions based on prevailing situations. In presenting this flexibility and choice the GA proffers, plots of energy savings from the grid and corresponding hall utilization (both in percentage and actual values) are thus presented. Also, snippets of the results of running the code are shown with the varied options there are to choose from. In generating these results, Mat lab (Matrix Labouratory) R2009a has been used extensively in compiling and executing this code (fig. 8 and fig. 9). The powerful nature of this programming software and its ease of programming coupled with its general acceptability make it the ideal software for executing this work. Mat lab also allows for graph plotting (fig. 10) in various formats by manipulating data and executing simple codes. This version of Mat lab was installed and run on a laptop computer with 4 GB DDR3 Memory, 500GB HDD and an Intel CoreTM i3380M Processor. It achieved a fast run time with no hitches for the different times the program was executed. The
34
Computing, Information Systems & Development Informatics Vol. 3 No. 5 , December , 2012
interactive nature was achieved by running the program
from an M-File.
Fig. 8: a snippet of the Matlab Environment on running the interactive M-File
Fig. 9: a snippet of the result of executing the M-File
35
Computing, Information Systems & Development Informatics Vol. 3 No. 5 , December , 2012
REFERENCES [1] Guo P., Wang X. and Han Y. (2010) “The enhanced Genetic algorithm for the Optimization Design” in 2010 3rd International Conference on Biomedical Engineering and Informatics, retrieved from http://ieeexplore.proxy.library.carleton.ca/ p.2990. [2] Monyei C. G. (2012) “Towards Sustainable Energy Development Using Virtual Power Plants” in the African Journal of Computing and ICT, retrieved from http://ajoict.net/ pp.119-123. [3] Novales M., Orro A. and Bugarin M. R. (2007) “Use of a genetic algorithm to optimize wheel profile geometry” in Journal of Rail and Rapid Transit, retrieved from http://pif.sagepub.com/content/221/4/467/ p.468.
Fig. 10: Generated values for one run of the M-File 4. RESULT AND CONCLUSION As can be gleaned from fig. 8, the administrator is expected to supply just a minimum of details while the GA is left to generate values (fig. 9 and fig. 10) based on constraints imposed. In generating these values, the GA also provides the administrator with corresponding results such as the contributions of the students both ‘fresh’ and ‘stale’, the estimated energy saved from the grid (in kilowatts), the current DG capacity (in kilowatts) and a graph plot of energy savings against hall utilization thus giving a holistic view of the results of making any choice. It thus saves time and allocation drudgery while reducing errors of over and under allocation. The adaptive nature of the GA is in its ability to generate values according to the constraints imposed screening out values that do not meet the preset requirements. From the foregoing therefore, the use of this adaptive GA is highly recommended for the MIS division of the University of Ibadan (initially as a test-run to better adapt the GA or incorporate neural networks in making the program more intelligent).
[4] Nwaoha T. C., Yang Z. and Wang J. (2010) “Application of Genetic Algorithm to risk based maintenance operations of liquefied natural gas carrier systems” in Journal of Process Mechanical Engineering, retrieved from http://pie.sagepub.com/content/225/1/40/ pp.41-42. [5] Odubiyi A. (2003) “Distributed Generation in Nigeria’s New Energy Industry” retrieved from http://ieeexplore.proxy.library.carleton.ca/ [6] Petersen M., Bendsten J. and Stoustrup J. (2012) “Optimal Dispatch Strategy for Agile Virtual Power Plant” in the 2012 American Control Conference, Fairmount Queen Elizabeth, Montreal, Canada, retrieved from http://ieeexplore.proxy.library.carleton.ca/ [7] Schafer A. and Moser A. (2012) “Dispatch Optimization and Economic Evaluation of Distributed Generation in a Virtual Power Plant” retrieved from http://ieeexplore.proxy.library.carleton.ca/ [8] Yildiz A. R. and Ozturk F. (2006) “Hybrid enhanced genetic algorithm to select optimal machining parameters in turning operations” in Journal of Engineering Manufacture, retrieved from http://pib.sagepub.com/content/220/12/2041/ p.2042.
36