A common observation about confocal microscopy images is that lower image stacks have lower ..... We call this accumulated impact an impact map, de- noted by S ,r . ... scattering impacts show near the center and therefore more intensity ...
MICROSCOPY RESEARCH AND TECHNIQUE 64:156 –163 (2004)
Adaptive Image-Processing Technique and Effective Visualization of Confocal Microscopy Images YINLONG SUN,1 BARTEK RAJWA,2,3
AND
J. PAUL ROBINSON2,3*
1
Department of Computer Sciences, Purdue University, West Lafayette, Indiana 47907-2066 Department of Biomedical Engineering, Purdue University, Potter Engineering Center, West Lafayette, Indiana 47907-2022 Purdue University Cytometry Laboratories, Department of Basic Medical Sciences, School of Veterinary Medicine, Hansen Life Sciences Research Building, Purdue University, West Lafayette, Indiana 47907-2064
2 3
KEY WORDS
confocal microscopy; image processing; light scattering; noise reduction; visualization; volume rendering
ABSTRACT A common observation about confocal microscopy images is that lower image stacks have lower voxel intensities and are usually blurred in comparison with the upper ones. The key reasons are light absorption and scattering by the objects and particles in the volume through which light passes. This report proposes a new technique to reduce such noise impacts in terms of an adaptive intensity compensation and structural sharpening algorithm. With these imageprocessing procedures, effective 3D rendering techniques can be applied to faithfully visualize confocal microscopy data. Microsc. Res. Tech. 64:156 –163, 2004. © 2004 Wiley-Liss, Inc. INTRODUCTION Confocal optical microscopy is generally believed to be the most significant advance in optical microscopy in the 20th century (Diaspro, 2001; Shotton, 1989; Webb, 1996). In the last two decades, it has become a widely accepted tool for optical imaging in biological and material sciences. This technique has the advantage of obtaining 3D volume information through non-invasive optical sectioning and scanning of 2D confocal planes inside the specimen (Sheppard and Choudhury, 1977; White et al., 1987; Wilson and Sheppard, 1984). In confocal microscopy, only in-focus light is imaged, whereas out-of-focus light is rejected by the confocal aperture (pinhole). By scanning successive optical planes, a three-dimensional image of the sample can be obtained (Bianco and Diaspro, 1977; Brakenhoff et al., 1979; Diaspro et al., 1990; Sheppard, 1989; Wilson, 1989). However, noise remains a major problem in 3D confocal microscopy images. In particular, noise increases with the depth of the confocal plane. A key physical mechanism responsible for this noise is that the incoming light rays are significantly scattered and absorbed by objects encountered on the path before reaching the targeted confocal plane. This occurs with strong impact, especially when dense objects that significantly scatter and absorb light are present above the region of focus. As a consequence, image stacks captured using confocal optical microscopy have lower intensities and are more blurred when the focal planes are deeper inside the specimen. The intensity attenuation and structural blurring in the image stacks cause serious problems in the analysis of confocal microcopy images. These problems not only limit the capability of the device to capture the 3D structures of biological objects, but also hamper the application of advanced computer visualization and 3D reconstruction techniques such as iso-surfacing (Lorensen and Cline, 1987) and direct volume rendering (Drebin et al., 1988; Levoy, 1988). For example, it is ©
2004 WILEY-LISS, INC.
well known that the volume-rendering technique of ray casting using color composition is able to reveal 3D structures with high image quality, much better than a maximum intensity projection (MIP) or an average intensity projection (AIP) does (Schroeder et al., 1998). However, ray casting using color composition requires the classification procedure that maps voxel intensities to physical properties such as colors and opacities through transfer functions. Typically, a transfer function has a peak profile centered at an iso-value of a volumetric dataset, and this iso-value is specified by the user (Levoy, 1988). Voxels with values far from the iso-value will be ignored, such that the cast rays penetrate them as if they were perfectly transparent. Therefore, if a volumetric dataset has significant errors in its voxel intensities, the ray casting technique will not be able to reveal the 3D structures accurately. For the same reason, other advanced computational algorithms such as iso-surfacing and 3D reconstruction will also fail to generate the true object structures and geometries. A simple idea is to perform a uniform intensity compensation, which depends only on the depth of the stack image. The problem of this approach is that it will brighten all the data in the stack images, even though there are actually no interfering objects in the light paths. In this report, we propose an adaptive method for voxel intensity compensation and structural sharpening. Our approach is based on the physical consideration of light-scattering and absorption behavior and will apply the intensity compensation
*Correspondence to: J. Paul Robinson, PUCL, Hansen Life Sciences Research Building, Purdue University, 201 S. University Street, West Lafayette, IN 47907-2064. E-mail: jpr@flowcyt.cyto.purdue.edu Received 9 April 2004; accepted in revised form 8 May 2004 Contract grant sponsor: Purdue Research Foundation; Contract grant sponsor: Purdue University Cytometry Laboratories. DOI 10.1002/jemt.20064 Published online in Wiley InterScience (www.interscience.wiley.com).
ADAPTIVE INTENSITY CORRECTION FOR CLSM
and sharpening algorithm only when there are dense objects above the image area where the light paths intersect. This approach effectively removes the noise due to light scattering and absorption deep within the confocal microscopy images. After the adaptive treatment of noise removal, we use a 3D volume-rendering technique to visualize the confocal microscopy datasets. Several techniques are applied, including ray casting, maximum intensity projection (MIP), or average intensity projection (AIP). In addition, we propose a new technique called ranged intensity projection (RIP), which we believe operates particularly well for confocal microscopy datasets. These techniques will be compared in terms of rendered images of real datasets. BACKGROUND Although confocal microscopy provides the capability of simple, non-invasive 3D imaging, visualization of the confocal dataset is a difficult task. The simplest (and still most popular) methods, such as presentation of individual 2D sections or combining 2D images using maximum intensity projection, do not provide a clear and intuitive 3D view of the examined object. Moreover, various types of noise and optical distortions remain a major problem. 1. The asymmetrical shape of the point-spread function (PSF) leads to distortions of the visualized 3D shapes. This problem can be partially solved by image deconvolution procedures (Bertero et al., 1990; Boutet de Monvel et al., 2001). 2. Fluorescence attenuation in depth owing to photobleaching is another limitation of confocal visualization (Tsien and Waggoner, 1995; Van Oostveldt et al., 1998). Researchers avoid this problem of photobleaching by decreasing the z-sampling rate during confocal data collection. However, according to the Nyquist principle, sampling at twice the resolution is required to provide sufficient information about an object. The issue of photobleaching may be partially solved by adding antioxidants to the biological sample, by decreasing the light intensity, or by data processing, where a function describing loss of intensity is used to correct the microscopy data (Nagelhus et al., 1996). 3. The image contrast in confocal microscopy degrades with increasing depth of penetration owing to light scattered and absorbed outside the focal region. This is a major limitation when highly turbid media such as tissue are studied. In the case of tissue, both the excitation light and the fluorescence light emission are scattered or bent by the encountered objects or interfaces, or absorbed by tissue components. At present, the most popular method of confocal data visualization accumulates all voxel intensities or uses the maximum intensity value to create a 2D projection of a 3D volume. Despite its popularity, this technique is known not to produce good representations of confocal datasets. More sophisticated techniques like ray casting give better results. However, ray casting and other similar approaches require classification (a transfer function), which maps voxels intensity onto colors or opacity. Such a transfer function takes an iso-value
157
and the gradient value of voxels and performs the mapping using some kind of a Gaussian function centered at the iso-value. All voxels with values that are far from the iso-value are ignored and, therefore, are transparent to the simulated rays. Obviously, the proper choice of the iso-value is critical. Because of the aforementioned strong effect of intensity attenuation, this becomes a problem when confocal datasets are visualized. The major reason for this attenuation and contrast degradation is light absorption and scattering by the sample itself. As a result, powerful visualization tools such as ray casting may produce artifacts or false negatives. To correct the problem, some method of intensity/contrast compensation is needed. However, simple uniform intensity compensation using depth as the only variable does not work, since the blurring and attenuation brought by every optical slice may differ. The other major limitation to the application of intensity correction is the effect of refractive-index mismatch (Carlsson, 1991; Cox and Sheppard, 1983; Diaspro et al., 2000, 2002; Gan and Gu, 1999; Hell et al., 1993; Sheppard and To¨ro¨k, 1997; van der Voort and Strasters, 1995; Visser et al., 1992; Wan et al., 2000). For example, Diaspro et al. (2002) reported experimental studies on refractive-index mismatch in high-resolution three-dimensional confocal microscopy. They measured the axial aberration induced in the case of fluorescent latex microspheres in four uniform media (air, oil, NOA, glycerol). Using latex subresolution beads immersed in three uniform media (air, oil, glycerol), they also investigated the effect of refractiveindex mismatch on the point-spread function (PSF) under different conditions. The PSF has been widely studied with measurement using beads embedded in a turbid medium (oocyte cytoplasm) (Gan and Gu, 1999; Sheppard and To¨ro¨k, 1997; Wan et al., 2000), and modeled and simulated computationally (Diaspro et al., 2002; Hell et al., 1993; Sheppard and To¨ro¨k, 1997; van der Voort and Strasters, 1995). Significant research has been devoted to computer visualization of cellular objects and confocal microscopy data. In a pioneering work, Kaufman et al. (1990) developed a software system called BioCube to render cellular structures. Sakas et al. (1996) applied volume rendering to visualize static and dynamic structures of 3D confocal microscopy datasets. Recently, de Leeuw et al. (2000) have developed a virtual reality software system for confocal microscopy images, and Razdan et al. (2001) have investigated the multicolor factor to effectively visualize confocal microscopy data. MATERIALS AND METHODS All confocal laser scanning microscopy experiments were conducted using a Bio-Rad MRC-1024 laser-scanning confocal attachment (Bio-Rad Laboratories, Hemel Hempstead, UK) mounted on a Nikon Diaphot 300 inverted microscope (Nikon, Tokyo, Japan). The confocal system was equipped with a 20⫻ CF Fluor 0.75-NA dry objective lens, an air-cooled krypton-argon laser (American Laser, Salt Lake City, UT) with a maximum output of 100 mW, three fluorescence detection channels (photomultipliers), and a nonconfocal transmitted-light detector. Image volumes were collected by scanning a series of images, with focus control provided by a precision microstepping motor.
158
Y. SUN ET AL.
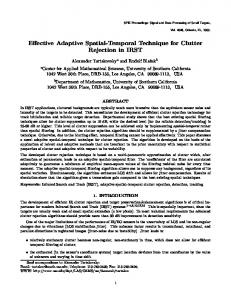
Fig. 1. Measured confocal microscopy images from 1 to 30 with increasing depth. In the last several images, which are the deepest, pixel intensities are significantly lower and more blurred. See the comparison between slices 1 and 30 in Figure 2.
Figure 1 shows a measurement example (a section through the stem of a water hyacinth plant, Eichhornia crassipes) that consists of 30 confocal 512 ⫻ 512-pixel image slices. The voxel size is 0.9 ⫻ 0.9 ⫻ 0.7 mm3. Green laser light (514 nm) attenuated to 10% of maximum power was introduced into the sample. Autofluorescence signal from the sample passed through a 488/ 568/647 triple dichroic filter (BioRad T1 filter block), then through a 560-nm dichroic long-pass filter (BioRad E2 filter block), and a 605/32-nm emission filter. The signal was detected with a photomultiplier with gain set to 1,100. The iris controlling the degree of confocality was set to 4.0. Larger views of slices 1 and 30 are also shown in Figure 2. Note that this specimen shows similar structures across the image stacks; this feature is particularly useful to illustrate the technique and algorithm we propose in this report. RESULTS Light Absorption and Scattering Consider light propagation from point r0 to r in a transparent medium. The effect of light absorption and scattering can be generally described (Wyszecki and Stile, 1982) by I共,r兲 ⫽ I0 共,r0 兲T共,r,r0 兲,
(1)
where is the wavelength and T(,r,r0) is usually called the internal transmittance. Generally speaking, the internal transmittance can be expressed in the form T共,r,r 0 兲 ⫽ exp关⫺S共,r,r0 兲兴,
(2)
where S(,r,r0) describes the overall effect of absorption and scattering from r0 to r:
S共,r,r 0 兲 ⫽
冕
1
0
a共,r⬘兲dl⬘.
(3)
Fig. 2. Original slice 1 (top left), original slice 30 (top right), image after intensity compensation of slice 30 (bottom left), and image of slice 30 after both intensity compensation and structural sharpening (bottom right).
Here l ⫽ 兩r0-r兩 is the path length and ␣(,r) represents the sum of the volume absorptivity and scattering power per unit length of the medium at location r. Eqs. (1) to (3) quantify the attenuation of the light intensity due to absorption and scattering. Structural blurring in confocal microscopy images is also associated with these equations. Consider a light ray passing through a volume region that contains scattering objects. When there is stronger scattering, light attenuation will be stronger and so will the structural blurring. This consideration is the basis of our adaptive algorithms for intensity compensation and structural sharpening shown below.
ADAPTIVE INTENSITY CORRECTION FOR CLSM
Fig. 3. index k.
Impact cone region for spatial point r on image stack with
Adaptive Approach A basic assumption in this report is that the function ␣(,r⬘) in Eq. (3) is associated with the voxel intensity at r measured in the confocal images. A larger value of ␣(,r⬘) implies stronger scattering power, which generates a brighter spot in the confocal image as well as attenuates light rays more significantly. Thus, this assumption can be written as a共,r⬘兲 ⬀ A共i⬘, j⬘,k⬘兲,
(4)
where A共i⬘, j⬘,k⬘兲 is the intensity value of pixel (i⬘, j⬘) in image slice k⬘. In other words, location r⬘ corresponds to voxel (i⬘, j⬘, k⬘), where i⬘, j⬘, k⬘ are voxel indices. Consider a light path from point r0 to point r as shown in Figure 3, which is the path from voxel (i, j, 1) to (i, j, k). Thus Eq. (3) can be written as
冘 A共i, j,k⬘兲, k
S共,r,r 0 兲 ⫽ ␣
(5)
k⬘⫽1
where ␣ is a constant depending on the material. At this point, it seems that the original incident light intensity I0 共,r0 兲 that is not attenuated could be recovered by simply applying Eq. (1), where I共,r兲 is given by the measured intensity at r of image stack k, and T共,r,r0 兲 is computed using Eqs. (2) and (5). However, this approach is not appropriate for intensity compensation in the context of confocal microscopy images, for two key reasons. First, the incident laser beams always come to a target point r in a cone. Second, because of volume scattering, the top image slices usually have larger impact areas. In this report, we solve this problem by considering the influence areas and using an impact map as presented below. Influence Areas and Impact Maps An initially thin light ray will gradually spread out because of volume scattering in the specimen. Suppose that the scattering objects are uniformly distributed in the specimen volume being considered. For a spatial point r on an image stack with index k, the impact of upper image stacks (with index k⬘ ⬍ k) will be in the form of a conic shape, as shown in Figure 3. Note that an image stack with a small value of k⬘ will have a larger influence area. Specifically, suppose that the impact of slice k -1 is described by a Gaussian function
159
whose deviation defines the influence area. For slice k ⫺ 2, because it is farther from slice k, the impact will be described by a Gaussian function having a larger deviation while maintaining the integrated value of the Gaussian function unchanged. In the same pattern, this description works for all the slices from 1 to k ⫺ 1. In practical datasets, the scattering objects are usually not uniformly distributed, and therefore the impact region is distorted from a perfectly conic shape. Given the spatial point r, our interest is to compute the entire impact accumulated by slices from 1 to k ⫺ 1. We call this accumulated impact an impact map, denoted by S 共,r兲. For any voxel (i, j) on slice k, this impact map provides the information on the impact of light absorption and scattering occurring in the slices from 1 to k ⫺ 1. Figure 4 presents the pseudocode of the algorithm that we propose for computing the impact map. First, the algorithm clears the 2D array of the map to zero. Then for every pixel point on the considered image slice, it loops all the slices above. In each iteration, for the component (i, j) in the impact map, the algorithm adds the contribution of the voxel (i, j, k⬘), and then applies a Gaussian filter to the current impact map. Since the contributions from the top slices are added to the impact map first and a Gaussian filter is applied every time one moves to the next slice, the contributions from top slices are blurred more, which in effect generates larger impact areas. Figure 5 shows the impact maps for slice 30 (the deepest image slice) in Figure 1 computed using different sizes for the Gaussian filter. Note that when the filter size is 1 (the first case in Fig. 5), the Gaussian filter actually has no impact. This corresponds to the result of S(r,r0) given by Eq. (5), which simply accumulates all the voxel values that are exactly above the map coordinates. When the filter size is larger, the map intensity is more uniformly distributed. In our computation below, we will use the impact maps with filter size 5. It should be noted that the impact map S 共,r兲 is not equivalent to the result of directly applying a Gaussian filter to S(,r,r0), and this approach has not considered the factor of slice separation. The method that computes S 共,r兲 using the algorithm in Figure 4 is more accurate in modeling the light-scattering process. Intensity Compensation and Image Sharpening Now we use the impact map to perform the intensity compensation for each image slice. From Eq. (1), we can determine the incident light intensity by 共,r兲, I 共,r兲 ⫽ I共,r兲/T
(6)
where I共,r兲 is given by the measured voxel intensity at a particular image stack and 共,r兲 ⫽ exp关⫺S 共,r兲兴, T
(7)
where the impact map S 共,r兲 is calculated from the procedure in Figure 4 using a Gaussian filter size of 5. Therefore, a large value in the impact map S 共,r兲 which is associated with strong absorption and scattering, will result in an increase in the voxel intensity. On
160
Y. SUN ET AL.
Fig. 4.
Pseudocode for computing the impact map for image slice k.
the other hand, if the value of S 共,r兲 is zero, which means that no volume absorption and scattering are involved, there will be no need for intensity compensation and the voxel value will remain unchanged. In Figure 2, we have displayed the image slice for index 30 (the deepest image) after applying the operation for intensity compensation. Compared to the original image, intensities in the central part have been significantly increased; as a result, the image after intensity compensation appears closer to that of the image slice index 1 (the top image). The significant intensity compensation in the central part corresponds to the impact map shown in Figure 5, where stronger scattering impacts show near the center and therefore more intensity compensation should be given. Image blurring resulting from volume scattering can also be reduced using the impact map computed above. After the operation of intensity compensation, we apply the following sharpening procedure to each image slice: I ⬘共,r兲 ⫽ 关I 共,r兲兴 S共,r兲 ⫽ exp兵S 共,r兲lnI 共,r兲其,
(8)
where I 共,r兲 is the result after intensity compensation, and  is a positive constant. Suppose that we let the maximum intensity value be 1. If the value of I 共,r兲 is 1, I ⬘共,r兲 will still be 1. However, if the value of I 共,r兲 is below 1, the exponential operation in Eq. (8) will generate a smaller value of I ⬘共,r兲. This in effect results in the sharpening of objects in the operated image. Figure 2 shows the result of sharpening for image slice 30. Visualization After a 3D confocal dataset has been processed with the operations of intensity compensation and sharpening, we can apply sophisticated volume-rendering techniques such as ray casting to visualize the dataset. In this report, we follow the rendering pipeline of ray casting using color composition (Levoy, 1988). As we pointed out in the first section, ray casting requires a classification procedure that maps the voxel intensities to colors and opacities through a transfer function. Typically the transfer function has a peak profile centered at an iso-value specified by the user. The rendered result is, therefore, sensitive to the iso-value.
Since we have reduced the noise impact from light absorption and scattering in 3D confocal images, ray casting is able to reveal the 3D structures more faithfully. Although the composition method of ray casting based on classification and the Phong illumination model can achieve high-quality rendered images, this method is much more computationally expensive than the maximum intensity projection (MIP) or average intensity projection (AIP) methods. On the other hand, MIP and AIP do not support the feature that allows the user to select an iso-value or a range of intensity values that are of most interest to the user in a specific application. In this report, we propose a ranged intensity projection (RIP) method that can achieve fast rendering and support user selection of the specific intensity range. The RIP method works like the average intensity projection (AIP) method except that we need to accumulate along the cast ray only those voxel intensities that are within a specified range. Figure 6 displays four images that are rendered using the AIP, MIP, RIP, and composition methods. Let the z direction be the surface normal pointing out of the specimen from image slice 1. The images in Figure 6 are rendered with the viewing direction at an angle of 150° to the z direction. In other words, we are looking at the deepest slices. For the RIP image, we select the range to be from 0.5 to 1.0. This RIP image is obviously better than the MIP image, which appears to be flat in the ring areas because the cast rays for these areas have almost the maximum intensity. The RIP method also improves the AIP by removing the shades due to voxels with low intensities. The composition image, for which we select the iso-value to be 1, provides the most informative 3D structure. Figure 7 shows two rendered images: one with the adaptive treatment of intensity compensation and structural sharpening, and one without the treatment. The two images are quite different. With the adaptive treatment, the rendered image shows a much clearer specimen structure (for example, the ring near the center). For both images, the viewpoint has an angle of 120° to the z direction, which means that we are looking from the bottom to the top. Figure 8 shows rendered images using RIP with the range from 0.5 to 1.0 for different viewing directions.
ADAPTIVE INTENSITY CORRECTION FOR CLSM
Fig. 5.
Fig. 6. tively.
161
Impact maps for slice 30 generated with filter sizes of 1, 2, 3, 4, and 5.
Images rendered using the AIP, MIP, RIP, and composition methods of ray casting, respec-
Fig. 7. Images rendered with (left) and without (right) the adaptive treatment of intensity compensation and sharpening.
For these images, the viewpoint forms an angle with the specimen surface normal (or the z direction) of 0, 15, 30, 45, 60, 75, 105, 120, 135, 150, and 165°. Note that the bottom images reveal the structures captured by the deepest confocal image slices. These are actually screen shots during an animation where the specimen spins while the camera is fixed. Because RIP is very fast, this method has potential to be implemented on regular PC workstations to commonly support realtime 3D animation of confocal datasets. DISCUSSION In confocal microscopy imaging, there is a common effect of intensity attenuation and image blurring from
the top to the bottom of image stacks owing to light scattering and absorption. In this report, we have proposed a method to reduce such resultant noises, using an adaptive algorithm. This method is based on the physical consideration of light scattering and absorption, and computes the noise influence areas and impact maps by iteratively applying a Gaussian filter. The impact maps are then used to perform the procedures for intensity compensation and structural sharpening of deep image slices. This method can effectively remove the noise impact generated by light absorption and scattering. We have applied several volume-rendering techniques to the 3D confocal dataset after the adaptive
162
Y. SUN ET AL.
Fig. 8. Rendered images using ranged intensity projection (RIP). The viewpoint rotates from the normal direction with angles 0, 15, 30, 45, 60, 75, 105, 120, 135, 150, and 165°.
treatment of noise removal. We have shown that the color composition technique of ray casting based on voxel classification and the Phong illumination model is most effective for displaying the 3D structural information of confocal datasets. The ranged intensity projection (RIP) that we proposed here can render images with better clarity than MIP and AIP methods, and can provide the flexibility that allows the user to explore objects within a specified intensity range. This work may lead to future research in several directions. First, the adaptive algorithms for intensity compensation and structural sharpening can be used generally with confocal datasets before applying advanced analysis and computational processing techniques, such as in iso-surfacing and 3D reconstruction. The adaptive approach proposed in this report can be further extended to the case of transmission confocal microscopy, where scattering and absorption on both sides of the focal plane are involved. Moreover, it is possible to improve the adaptive algorithms by taking into account wavelength information and the datasets generated at multiple wavelengths, because
the wavelength information is useful to model the process of light absorption and scattering. In particular, one can conduct a numerical simulation such as the Monte Carlo method to further study the influence areas and impact maps that are proposed here. Furthermore, the constants such as ␣ and  needed in our method could be predicted from the numerical study. The better understanding of the interfering impacts of light scattering and absorption between image slices will also help in solving the problem of imaging distortion resulting from a varying index of refraction in the specimen. To understand 3D confocal microscopy datasets most effectively, it is important to develop an interactive visualization environment. In the past, an interactive microscopy data exploration method was developed in terms of a combination of the shear-warp volume-rendering technique with image-based transfer function mapping (Biddlecome et al. 1998; Fang et al., 2000). Such techniques have been successfully implemented in a prototype visualization system on SGI workstations. In this study, we propose an RIP method that is
ADAPTIVE INTENSITY CORRECTION FOR CLSM
fast and flexible. This method has the potential to support interactive rendering of large confocal datasets and real-time visualization of dynamic confocal images on regular PC systems. ACKNOWLEDGMENTS This research has been supported by a startup fund from Purdue Research Foundation and the Purdue University Cytometry Laboratories facility. We sincerely thank Gretchen Lawler for proofreading the manuscript, Jennie Sturgis for preparing confocal microscopy data, and Qiqi Wong and Haiying Xu for partial implementation of related techniques. REFERENCES Bertero M, Boccacci P, Brakenhoff G, Malfanti F, van der Voort H. 1990. Three-dimensional image restoration and super-resolution in fluorescence confocal microscopy. J Microsc 157:3–20. Bianco B, Diaspro A. 1989. Analysis of three-dimensional cell imaging obtained with optical microscopy techniques based on defocusing. Cell Biophys 15:189 –200. Biddlecome T, Fang S, Dunn K, Tuceryan M. 1998. Image guided interactive volume visualization for confocal microscopy data exploration. Proceedings of the SPIE International Symposium on Medical Imaging 130 –140. Boutet de Monvel J, Le Calvez S, Ulfendahl M. 2001. Image restoration for confocal microscopy: improving the limits of deconvolution, with application to the visualization of the mammalian hearing organ. Biophys J 80:2455–2470. Brakenhoff GJ, Blom P, Barends P. 1979. Confocal scanning light microscopy with high aperture immersion lenses. J Microsc 117: 219 –232. Carlsson K. 1991. The influence of specimen refractive index, detector signal integration, and non-uniform scan speed on the imaging properties in confocal microscopy. J Microsc 163:167–178. Cox J, Sheppard CJR. 1983. Digital image processing of confocal images. Image Vision Comput 1:52–56. De Leeuw WC, van Liere R, Verschure PJ, Visser AE, Manders EMM, van Driel R. Case study: visualization of time dependent confocal microscopy data. Proc IEEE Visualization 2000:473– 477. Diaspro A, editor. 2001. Confocal and two-photon microscopy: foundations, applications, and advances. New York: Wiley-Liss. Diaspro A, Annunziata S, Robello M. 2000. Single-pinhole confocal imaging of sub-resolution sparse objects using experimental point spread function and image restoration. Microsc Res Tech 51:400 – 405. Diaspro A, Federici F, Robello M. 2002. Influence of refractive-index mismatch in high-resolution three-dimensional confocal microscopy. Appl Opt 41:685. Diaspro A, Sartore M, Nicolini C. 1990. Three-dimensional representation of biostructures imaged with an optical microscope. I. Digital optical sectioning. Image Vision Comput 8:130 –134. Drebin RA, Carpenter L, Hanrahan P. 1988. Volume rendering. ACM SIGGRAPH 22:65–74.
163
Fang S, Dai Y, Myers F, Tuceryan M, Dunn K. 2000. Three-dimensional microscopy data exploration by interactive volume visualization. J Scanning Microsc 22:218 –226. Gan X, Gu M. 1999. Effective point-spread function for fast image modeling and processing in microscopic imaging through turbid media. Opt Lett 24:741–743. Hell S, Reiner G, Cremer C, Stelzer EHK. 1993. Aberrations in confocal fluorescence microscopy induced by mismatches in refractive index. J Microsc 169:391– 405. Kaufman K, Yagel R, Bakalash R, Spector I. 1990. Volume visualization in cell biology. Proc IEEE Visualization 1990:160 –167. Levoy M. 1988. Volume rendering: display of surfaces from volume data. IEEE Comput Graph Appl 8:29-36. Lorensen WE, Cline HE. 1987. Marching cubes: a high resolution 3D surface reconstruction algorithm. ACM SIGGRAPH 21:163-169. Nagelhus TA, Slupphaug G, Krokan HE, Lindmo T. 1996. Fading correction for fluorescence quantitation in confocal microscopy. Cytometry 23:187–195. Razdan A, Patel K, Farin G, Capco D. 2001. Volume visualization of multicolor laser confocal microscope data. Comput Graph 25:371– 382. Sakas G, Vicker MG, Plath PJ. 1996. Case study: visualization of laser confocal microscopy datasets. Proc IEEE Visualization 1996:375– 379. Schroeder W, Martin K. Lorensen B. 1998. The visualization toolkit: an object-oriented approach to 3D graphics. Upper Saddle River, NJ: Prentice Hall. Sheppard CJR, To¨ro¨k P. 1997. Effects of specimen refractive index on confocal imaging. J Microsc 18:366 –374. Sheppard JR. 1989. Axial resolution of confocal fluorescence microscopy. J Microsc 154:237–242. Sheppard JR, Choudhury A. 1977. Image formation in the scanning microscope. Opt Acta 24:1051–1073. Shotton, DM. 1989. Confocal scanning optical microscopy and its applications for biological specimens. J Cell Sci 94:75–206. Tsien RY, Waggoner A. 1995. Fluorophores for confocal microscopy. Photophysics and photochemistry. In: Pawley JB, editor. Handbook of biological confocal microscopy. New York: Plenum p 267–279. Van der Voort TM, Strasters KC. 1995. Restoration of confocal images for quantitative image analysis. J Microsc 178:165–181. Van Oostveldt P, Verhaegen F, Messens K. 1998. Heterogeneous photobleaching in confocal microscopy caused by differences in refractive index and excitation mode. Cytometry 32:137–146. Visser TD, Oud JL, Brakenhoff GJ. 1992. Refractive index and axial distance measurements in 3-D microscopy. Optik 90:17–19. Wan S, Rajadhyasksha M, Webb RH. 2000. Analysis of spherical aberration of a water immersion objective: Application to specimens with refractive indices 1.33–1.40. J Microsc 197:274 –284. Webb RH. 1996. Confocal optical microscopy. Rep Prog Phys 59:427– 471. White JG, Amos WB, Fordham M. 1987. An evaluation of confocal versus conventional imaging of biological structures by fluorescence light microscopy. J Cell Biol 105:41– 48. Wilson T. 1989. Optical sectioning in confocal fluorescent microscopes. J Microsc 154:143–156. Wilson T, Sheppard CJR. 1984. Theory and practice in scanning optical microscopy. London: Academic Press. Wyszecki G, Stiles W. 1982. Color science: concepts and methods, quantitative data and formulas, 2nd ed. New York: Wiley.