Dec 12, 2009 - The underlying predictive model (UPM) p(xt|x(tâÏ):tâ1 =: x. (Ï) t. ,θm) for any Ï â [1,..., (t
Adaptive Sequential Bayesian Change Point Detection Ryan Turner
Whistler, BC December 12, 2009 Joint work with Yunus Saatci and Carl Edward Rasmussen
Turner (Engineering, Cambridge)
Adaptive Sequential Bayesian Change Point Detection
1
Motivation
Handle nonstationarity in time series Avoid making point estimates of (changing) parameters Modular framework Tractability Online Probabilistic predictions Minimal hand tuning
Turner (Engineering, Cambridge)
Adaptive Sequential Bayesian Change Point Detection
2
Ingredients The time since the last change point, namely the run length rt (τ ) The underlying predictive model (UPM) p(xt |x(t−τ ):t−1 =: xt , θm ) for any τ ∈ [1, . . . , (t − 1)], at time t The hazard function H(r|θh ) The hyper-parameters θ := {θh , θm } 8
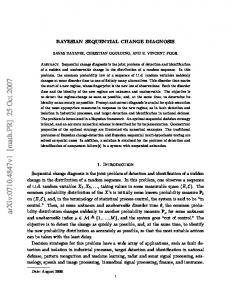
Observations
6 4 2 0 −2 −4
Run Length
−6 200 150 100 50 0
0
100
200
300
400
500
600
700
800
900
1000
Time
Figure: Sample drawn from BOCPD. Turner (Engineering, Cambridge)
Adaptive Sequential Bayesian Change Point Detection
3
Previous Work
Test based approaches Retrospective Bayesian approaches Bayesian Online Change Point Detection (BOCPD) (e.g., Adams & MacKay 2007) BOCPD sensitive to hyper-parameters
Turner (Engineering, Cambridge)
Adaptive Sequential Bayesian Change Point Detection
4
The BOCPD Algorithm The goal in BOCPD is to calculate the posterior run length at time t, i.e., p(rt |x1:t ), sequentially. p(xt+1 |x1:t ) =
X
p(xt+1 |x1:t , rt )p(rt |x1:t ) =
rt
X
(r)
p(xt+1 |xt )p(rt |x1:t ) ,
rt
(1) γt := p(rt , x1:t ) =
X
p(rt , rt−1 , x1:t )
rt−1
=
X rt−1
(r)
p(rt |rt−1 ) p(xt |rt−1 , xt ) p(rt−1 , x1:t−1 ) . {z }| {z } | {z } | hazard
likelihood (UPM)
(2)
γt−1
This defines a forward message passing scheme p(rt |x1:t ) ∝ γt .
Turner (Engineering, Cambridge)
Adaptive Sequential Bayesian Change Point Detection
5
Learning
Learn by maximizing (log) marginal likelihood, the evidence Done by decomposing into the one-step-ahead predictive likelihoods log p(x1:T |θ) =
T X
log p(xt |x1:t−1 , θ)
(3)
t=1
Compute derivatives using forward propagation (r) ∂ ∂θm p(xt |rt−1 , xt , θm ) hazard function ∂θ∂h p(rt |rt−1 , θh )
The derivatives of the UPM The derivatives of the
Turner (Engineering, Cambridge)
Adaptive Sequential Bayesian Change Point Detection
6
Improvements
Pruning Naive implementation is O(T 2 ) Eliminate low probability messages for O(T )
Modularity Any hazard function H(t) ∈ [0, 1] Any model that provides a posterior predictive Gaussian process regression, Bayesian linear regression, and Kernel Density Estimation
Caching Repetitive predictions under given run length (r) Use intelligent caching p(xt |rt−1 , xt )
Turner (Engineering, Cambridge)
Adaptive Sequential Bayesian Change Point Detection
7
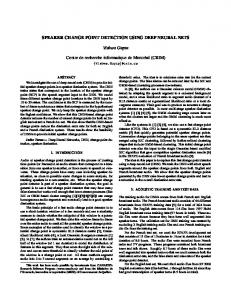
Well Log Data We used the logistic hazard, H(t) = hσ(at + b), and used an IID Gaussian UPM, with the aim of detecting changes in mean and variance. After learning the parameters our method has a better predictive likelihood than Adams & MacKay 2007. 2
NMR
0 −2 −4 0
500
1000
1500
2000
2500
3000
3500
4000
500
1000
1500
2000
2500
3000
3500
4000
Run Length
50 100 150 200 250 300
Measurements
Figure: The BOCPD run length distribution on the well log data. Turner (Engineering, Cambridge)
Adaptive Sequential Bayesian Change Point Detection
8
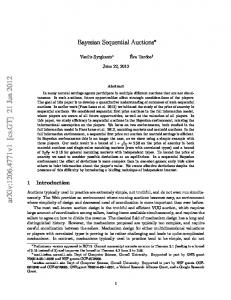
Industry Portfolios Tried the “30 industry portfolios” data set (from Ken French repository). Change points found coincide with significant events: the climax of the Internet bubble, the burst of the Internet bubble, and the 2004 presidential election. Dot−com bubble burst September 11 Asia crisis, Dot−com bubble
US presidential election Major rate cut
Northern Rock bank run Lehman collapse
Run Length (trading days)
50 100 150 200 250 300 350 400 450 1999
2000
2001
2002
2003
2004
2005
2006
2007
2008
Date (years)
Figure: The BOCPD run length distribution between 1998 and 2008. Turner (Engineering, Cambridge)
Adaptive Sequential Bayesian Change Point Detection
9
Results
Table: A summary of comparing the negative log predictive likelihoods (NLL) (nats/observation) on test data. We also include the 95% error bars on the NLL and the p-value that the joint model/learned hypers has a higher NLL using a one sided t-test.
Well Log Method NLL error bars TIM 1.53 0.0449 fixed hypers 0.313 0.0267 0.0293 learned hypers 0.247 Industry Portfolios TIM 42.6 0.246 indep. 39.64 0.217 joint 39.54 0.213
Turner (Engineering, Cambridge)
p-value