Optical Engineering 44(3), 037003 (March 2005)
Advanced discrete wavelet transform fusion algorithm and its optimization by using the metric of image quality index Yufeng Zheng University of Louisville Department of Psychological and Brain Sciences 317 Life Sciences Bldg Louisville, Kentucky 40292 E-mail:
[email protected] Edward A. Essock University of Louisville Department of Psychological & Brain Sciences Louisville, Kentucky 40292 and University of Louisville Department of Ophthalmology & Visual Science Louisville, Kentucky 40292 Bruce C. Hansen University of Louisville Department of Psychological & Brain Sciences Louisville, Kentucky 40292
Abstract. Of the many image fusion methods, the discrete wavelet transform (DWT) and various pyramids (e.g., the Laplacian pyramid) are among the most common and effective. For quantitative evaluation of the quality of fused imagery, the root mean square error (RMSE) is the most reasonable measure of quality if a ‘‘ground truth’’ image is available; otherwise, the entropy, spatial frequency, or image quality index (IQI) can be calculated and evaluated. Here, an advanced discrete wavelet transform ( a DWT) method that incorporates principal component analysis (PCA) and morphological processing into a regular DWT fusion algorithm is presented. Specifically, a principle vector is derived from two input images and then applied to two of the images’ approximation coefficients at the highest DWT transform scale. For the detail coefficients at each transform scale, the larger absolute values are chosen and subjected to a neighborhood morphological processing procedure that serves to verify the selected pixels by using a ‘‘filling’’ and ‘‘cleaning’’ operation. Furthermore, the a DWT has two adjustable parameters—the number of DWT decomposition levels and the length of the selected wavelet that determinately affect the fusion result. An iterative fusion process that was optimized with the established metric—IQI—is then implemented. Experimental results tested on four types of inhomogeneous imagery show that the iterative a DWT achieves the best fusion compared to the pyramid or the DWT methods judged on both the IQI metric and visual inspection. © 2005 Society of Photo-Optical Instrumentation Engineers. [DOI: 10.1117/1.1871812]
Subject terms: image fusion; image pyramid; image quality index; iterative fusion; spatial frequency; wavelet transform. Paper 040306 received May 21, 2004; revised manuscript received Aug. 24, 2004; accepted for publication Sep. 22, 2004; published online Mar. 23, 2004.
1
Introduction
Along with the development of new imaging sensors arises the requirement for a meaningful combination of all employed imaging sources 共i.e., image fusion兲. There are many applications of image fusion, some of which include medical imaging, remote sensing, nighttime operations, and multispectral imaging. A general definition of image fusion has been stated as ‘‘the combination of two or more different images to form a new image by using a certain algorithm.’’1 The actual fusion process can take place at different levels of information representation. A generic categorization of these different levels can be sorted in ascending order of abstraction: pixel, feature, and decision levels. This paper focuses on the so-called pixel-level fusion process, whereby a composite image must be built of multiple 共typically two兲 input images. Image fusion is a tool that serves to combine multisource imagery by using advanced image processing techniques. Specifically, it aims at the integration of disparate and complementary data to enhance the information apparent in the images, as well as to increase the reliability of the interpretation—ultimately leading to more accurate data2 0091-3286/2005/$22.00 © 2005 SPIE
Optical Engineering
and increased utility.3– 4 In addition, it has been shown that fused data can provide for robust operational performance of human users achieved through increased confidence, reduced ambiguity, improved reliability, and improved classification.3,5 A general framework of image fusion can be found in Ref. 6. In pixel-level image fusion, some general requirements7 are imposed on the fusion result: 共1兲 the fusion process should preserve all relevant information of the input imagery in the composite image 共pattern conservation兲 and 共2兲 the fusion scheme should not introduce any artifacts or inconsistencies that would distract the human observer or disrupt subsequent processing stages. Consequently, quantitative evaluation of the quality of fused imagery is considered very important for an objective comparison of different types of fusion algorithm performance. In addition, a quantitative metric can potentially be used as feedback to the fusion algorithm to further improve fused image quality. Driven by the wide range of applications for image fusion, many fusion algorithms have been developed—two common methods being the discrete wavelet transform8 –11 共DWT兲 and various pyramids12,13 共such as the Laplacian, contrast, gradient, and morphological pyramids兲—whereas
037003-1
March 2005/Vol. 44(3)
Zheng, Essock, and Hansen: Advanced discrete wavelet transform . . .
only a few metrics are available for quantitative evaluation of the quality of fused imagery. For example, the root mean square error 共RMSE兲 is the most natural measure of image quality if a ‘‘ground truth’’ image is available; however, for realistic image fusion problems, there are no ground truths. The spatial frequency 共SF兲 or entropy have been used to measure how much information is contained in an image and have been subsequently used in the fusion rules 共i.e., the rules that decide which input should be selected for the fused image兲,14 but they cannot directly measure the fused image quality. Beauchemin et al. presented a method that uses local variance for image fusion assessment15 that still requires a comparison with the measurement of ground truth. Leung et al. proposed the image noise index 共INI兲 based on entropy calculation to measure the fused image quality.16 However, this method requires the exact reverse process of an image fusion procedure, which is almost impractical to be realized for most fusion processes such as DWT or pyramid fusion methods. Piella and Heijmans recently presented a new metric for image fusion, the image quality index17 共IQI兲, which measures how similar the fused image is to both input images by evaluating their correlation and distortion. The values of IQI are within 关0,1兴 regardless of image content, where the ideal value is 1 共if two input images are identical兲. In addition, the IQI value is easily computed and fairly accurate 共compared to other available metrics兲. Therefore, this IQI metric can be used to direct an iterative fusion process that updates its parameters based on the IQI value, thus enabling the best parameter settings 共thereby producing the ideal fused version of the input images兲 for different imagery. Besides the various pyramid methods, an advanced wavelet transform (aDWT) method that incorporates principal component analysis 共PCA兲 and morphological processing into a regular DWT fusion algorithm was recently presented.18 Furthermore, experimental results showed an important relationship between the fused image quality and the wavelet properties:18 a higher level of DWT decomposition 共with smaller image resolution at higher scale兲 or a lower order of wavelets 共with shorter length兲 usually resulted in a more sharpened fused image. This means that we can use the level of DWT decomposition and the length of a wavelet as the parameters of an iterative DWT-based fusion algorithm. Together with the IQI metric, an iterative aDWT can be realized. The subsequent sections of this paper are organized as follows. The currently used metrics—RMSE, IQI, and SF—are presented in Sec. 2, where the extension of SF is developed. Next is a full description of pyramid methods and the aDWT followed by the introduction of the iterative aDWT that is directed by the IQI metric. Last, the experimental results and discussion are presented, followed by conclusions. 2 Image Quality Metrics As mentioned in the introduction, the general requirements of an image fusion process are that it should preserve all valid and useful pattern information from the source images, while at the same time not introducing artifacts that could interfere with subsequent analyses.19 However, it is almost impossible to combine images without introducing some form of distortion. In the current body of fusion litOptical Engineering
erature, image fusion results tend to be evaluated by inspection 共i.e., visually兲 or objectively 共e.g., by either human performance or image-quality measures兲. Here, we focus on quantitative image-quality metrics that can be carried out automatically by computers. Three commonly used measures are described in the following, one of which, RMSE, requires a reference 共ground truth兲 image, while the others do not. Note, however, that the best criterion should be linked with the specific application. 2.1 RMSE The RSME between the reference image 共ground truth兲 and the fused image is RMSE⫽
再
M 兺 i⫽1 兺 Nj⫽1 关 I R 共 i, j 兲 ⫺I F 共 i, j 兲兴 2
M ⫻N
冎
1/2
,
共1兲
where I R (i, j) and I F (i, j) are the image pixel values of the reference image and the fused image, respectively, and M ⫻N is the image size.
Image Quality Index The IQI was recently introduced by Wang and Bovik.20 Given two sequences x⫽(x 1 ,...,x n ) and y⫽(y 1 ,...,y n ), let ¯x denote the mean of x, and let x and xy denote the variance of x and covariance of x and y, respectively. The global quality index of two vectors is defined as 2.2
Q 0 共 x,y 兲 ⫽
4 xy xy ¯ 2 兲共 2x ⫹ 2y 兲 共¯x ⫹y 2
,
共2兲
which can be decomposed as Q 0 共 x,y 兲 ⫽
xy 2xy 2 x y . x y ¯x 2 ⫹y ¯ 2 2x ⫹ 2y
共3兲
Note that the first component in Eq. 共3兲 is the correlation coefficient between x and y. This value is a measure for the similarity of the vectors x and y, and takes on values between ⫺1 and 1. Keep in mind that in this case 共image quality evaluation兲, the values x i and y i are positive grayscale values. The second component in Eq. 共3兲 corresponds to the luminance distortion which has a dynamic range of 关0,1兴. The third factor in Eq. 共3兲 measures the contrast distortion, its range is also 关0,1兴. In summary, Q 0 苸 关 0,1兴 ; and the maximum value Q 0 ⫽1 is achieved when x and y are identical. Piella and Heijmans introduced a weighting procedure into the Q 0 calculation,17 where S(I A ) denotes the ‘‘saliency’’ of image A. It should reflect the local relevance of image A that can depend on local variance, contrast, sharpness, or entropy. Given the local saliencies of two input images, A and B, we compute a local weight indicating the relative importance of image A compared to image B: the larger , the more weight is given to image A. A typical choice for is ⫽S 共 I A 兲 / 关 S 共 I A 兲 ⫹S 共 I B 兲兴 .
共4兲
Then, the fused image quality measure 共i.e., the weighted image quality index兲 can be defined as
037003-2
March 2005/Vol. 44(3)
Zheng, Essock, and Hansen: Advanced discrete wavelet transform . . .
2.4 Entropy L⫺1
entropy⫽⫺
兺
l⫽0
Fig. 1 Illustration of SF calculation where each small square denotes a pixel: (a) four-directional SFs with arrows pointed to the gradient directions and (b) two diagonal directions; where the dashed lines stand for main diagonal directions and the dotted lines represent secondary diagonal directions.
共5兲
Since image signals are generally nonstationary, it is more appropriate to measure the weighted image quality index Q w over local regions 共e.g., by parsing the entire image into a set of ‘‘blocks’’兲 and then combine the different results into a single measure. Piella and Heijmans also suggested using local variance as the saliency of an image, i.e., S(I A )⫽ A . 2.3 Spatial Frequency SF is used to measure the overall activity level of an image,21 which is defined as follows. SF⫽ 关共 RF兲 2 ⫹ 共 CF兲 2 兴 1/2,
共6兲
where RF and CF are row frequency and column frequency, respectively.
再 再
M
1 RF⫽ M N i⫽1
N
兺 j⫽2 兺 关 I 共 i, j 兲 ⫺I 共 i, j⫺1 兲兴
1 CF⫽ MN
N
M
兺 兺 关 I 共 i, j 兲 ⫺I 共 i⫺1,j 兲兴
j⫽1 i⫽2
冎 冎
1/2
,
共7a兲
.
共7b兲
2
2
1/2
Similar to the definitions of RF and CF, spatial frequency along two diagonal directions 关see Fig. 1共b兲兴, termed as main diagonal SF 共MDF兲 and secondary diagonal SF 共SDF兲, can be defined as
再 再
MDF⫽ w d
M
1 M N i⫽2
1 SDF⫽ w d MN
N
兺 j⫽2 兺
N⫺1
冎 冎
1/2
关 I 共 i, j 兲 ⫺I 共 i⫺1,j⫺1 兲兴 2
M
兺 兺 关 I 共 i, j 兲 ⫺I 共 i⫺1,j⫹1 兲兴
j⫽1 i⫽2
2
, 共8a兲 1/2
, 共8b兲
where w d ⫽1/& is a distance weight; similarly it can be considered that w d ⫽1 in Eqs. 共7a兲 and 共7b兲. Then the overall SF of an image becomes SF⫽ 关共 RF兲 2 ⫹ 共 CF兲 2 ⫹ 共 MDF兲 2 ⫹ 共 SDF兲 2 兴 1/2,
共9兲
which is a combination of four directional SFs 关see Fig. 1共a兲兴. With Eq. 共9兲 we can calculate and compare the SFs of input images or the fused image (SFF ). Optical Engineering
共10兲
where p(l) is the probability of gray level l 共which can be computed by analyzing the image histogram兲, and the dynamic range of the analyzed image is 关 0,L⫺1 兴 共usually, L⫽256). 3
Q w ⫽Q 0 共 I A ,I F 兲 ⫹ 共 1⫺ 兲 Q 0 共 I B ,I F 兲 .
p 共 l 兲 log2 p 共 l 兲 ,
Image Fusion Methods
3.1 Pyramid Methods Image pyramids were initially described for a multiresolution image analysis and as a model for the binocular fusion in human vision.19,22 An image pyramid can be described as collection of low- or bandpass copies of an original image in which both the band limit and sample density are reduced in regular steps. The basic strategy of image fusion based on pyramids is to use a feature selection rule to construct a fused pyramid representation from the pyramid representations of the original images. The composite image is obtained by taking the inverse pyramid transform. Several pyramid-based fusion schemes have been proposed recently,22–33 and they are briefly reviewed next. 3.1.1 Laplacian pyramid The Laplacian pyramid was first introduced as a model for binocular fusion in human stereo vision,19,22 where the implementation used a Laplacian pyramid and a maximum selection rule at each point of the pyramid transform. Essentially, the procedure involves a set of bandpass copies of an image and is referred to as the Laplacian pyramid due to its similarity to a Laplacian operator. Each level of the Laplacian pyramid is recursively constructed from its lower level by applying the following four basic steps: blurring 共low-pass filtering兲; subsampling 共reduce size兲; interpolation 共expand兲; and differencing23 共to subtract two images pixel by pixel兲. In the Laplacian pyramid, the lowest level of the pyramid is constructed from the original image. 3.1.2 Ratio of low-pass pyramid and contrast pyramid The ratio of low-pass 共RoLP兲 or contrast pyramid, which was introduced by Toet24 and Toet et al.,25 is very similar to a Laplacian pyramid. Originally the RoLP pyramid was explicitly intended for use by human observers. Every level of the RoLP pyramid is the ratio of two successive levels of the Gaussian pyramid. In Refs. 24 to 27, an RoLP pyramid and the maximum selection rule were used for visible-to-IR image fusion. 3.1.3 Gradient pyramid The gradient pyramid can be generated by applying gradient operators to each level of the Gaussian pyramid.28 This produces horizontal, vertical, and diagonal pyramid sets for each source in the Gaussian pyramid. Burt and Lolczynski29 proposed an image fusion scheme that was based on a gradient pyramid and an activity measure within a small window rather than just a single point. In Ref. 30,
037003-3
March 2005/Vol. 44(3)
Zheng, Essock, and Hansen: Advanced discrete wavelet transform . . .
Fig. 2 Morphological processing (of a 3⫻3 region): (a) filling and (b) cleaning. Shaded pixels were chosen from image A, and white pixels were selected from image B.
Richard et al. demonstrated the qualitative and quantitative results of the preceding three image data fusion algorithms and their target signature variation. 3.1.4 Morphological pyramid A morphological pyramid can be constructed by the successive filtering of the original image with a sequence of nonlinear morphological operators 共such as the open-close filter兲 and a specialized subsampling scheme.31 The application of morphological pyramid to image fusion can be referenced in Refs. 32 and 33. 3.2 DWT and a DWT Methods As with a pyramid method, the regular DWT method is also a multiscale analysis method. In a regular DWT fusion process, DWT coefficients from two input images are fused 共pixel by pixel兲 by choosing the average of the approximation coefficients at the highest transform scale and the larger absolute value of the detail coefficients at each trans-
Fig. 3 Diagram of a general iterative back-propagation fusion process: A and B are input images and F is the fused image.
form scale. Then an inverse DWT is performed to obtain the fused image. In the aDWT method, PCA 共Ref. 34兲 and morphological processing are incorporated into the DWT fusion algorithm. Specifically, at each DWT scale of a particular image, the DWT coefficients of a 2-D image consist of four parts: approximation, horizontal detail, vertical detail, and diagonal detail. We then apply PCA to the two input images’ approximation coefficients at the highest transform scale, that is, we fuse them by using the principal eigenvector 共corresponding to the larger eigenvalue兲 derived from the two original images, as described by C F ⫽ 共 a 1 C A ⫹a 2 C B 兲 / 共 a 1 ⫹a 2 兲 ,
共11兲
where C A and C B are approximation coefficients trans-
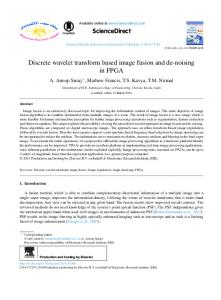
Fig. 4 Fusion metric distributions with varying parameters of DWT level ( L d ) and wavelet length ( L w ) while fusing the simulated pair of ‘‘Lena-I2’’ for (a) distribution of IQI ( L d , L w ) and (b) distribution of RMSE ( L d , L w ). (a) Shows a monotonically decreasing function of IQI ( L d ). By comparing (a) and (b), we see that two metrics (IQI and RMSE) are quite consistent, which means that a large IQI corresponds a small RMSE. Optical Engineering
037003-4
March 2005/Vol. 44(3)
Zheng, Essock, and Hansen: Advanced discrete wavelet transform . . .
Fig. 5 IQI distribution with varying parameters of DWT level ( L d ) and wavelet length ( L w ) while fusing the medical image pair for (a) distribution of IQI ( L d , L w ) and (b) distribution of IQI ( L d ) and IQI ( L w )—two slices of (a) at L w ⫽4 and L d ⫽4, respectively. (b) Clearly shows an almost increasing function of IQI ( L d ), while IQI ( L w ) is locally fluctuating.
formed from input images A and B; C F represents the fused coefficients; and a 1 and a 2 are the elements of the principal eigenvector, which are computed by analyzing the original input images. 共Note we do not analyze C A and C B alone because their sizes at the highest transform scale are too small to conduct an accurate result.兲 In practice, we have to convert 2-D images into 1-D vectors by simply stacking each image column by column so that the principle component can be computed. Note that the denominator in Eq. 共11兲 is used for normalization so that the fused image has the same energy distribution as the original input images. For the detail coefficients 共the other three quarters of the coefficients兲 at each transform scale, the larger absolute values are selected, followed by neighborhood morphological processing, which serves to verify the selected pixels by using a ‘‘filling’’ and ‘‘cleaning’’ operation 共i.e., the operation fills or removes isolated pixels locally, as shown in Fig. 2兲. For example, in the fused-coefficients image, if the detail coefficient of the central pixel is selected from input image B, but the other eight surrounding coefficients are selected from input image A 关as shown in Fig. 2共a兲兴, then a filling operation will replace this central coefficient 共from image B兲 with the one from image A. The filling operation takes no action when the number of the surrounding eight pixels had less than eight coefficients selected from image A. Such an operation 共similar to smoothing兲 can increase the consistency of coefficient selection, thereby reducing the distortion in the fused image. Note that the highest DWT level (L d max) that can be decomposed depends on the input image size. However, the size of smallest transformed image should not be less than 2⫻2. Thus, we have L d max⫽int兵 log2 关 min共 M ,N 兲 /min共 m 0 ,n 0 兲兴 其 ,
共12兲
where the image size is M ⫻N, m 0 ⫻n 0 represents the size Optical Engineering
of transformed image by DWT at the highest scale, min means taking the minimal value, and int signifies taking the integral part. 3.3 Iterative a DWT Directed by the IQI A general iterative model for any image fusion procedure is proposed and is shown in Fig. 3. Here the IQI value is calculated to measure the fused image quality by the aDWT, then it is fed back to the fusion algorithm (aDWT) to achieve a better fusion by directing parameter adjustment. To make this model work properly, some requirements are imposed: 共1兲 the fusion process must have some adjusted parameters that definitely affect the metric value;
Fig. 6 Image fusion with the simulated pair from image ‘‘Lena-I2.’’ The original image size is 512⫻512 pixels. All images were scaled to fit in the paper space. (a) Lena image (reference or ground truth), (b) input image A, (c) input image B, (d) image fused by iterative a DWTi, (e) image fused by Laplacian pyramid, and (f) image fused by regular DWT.
037003-5
March 2005/Vol. 44(3)
Zheng, Essock, and Hansen: Advanced discrete wavelet transform . . . Table 1 The fused image quality evaluations of four metrics (entropy, SF, IQI, and RMSE). Imagery
Ref.
Input A
Input B
Metric
Lapl.
Ratio
Contr.
Grad.
Morph.
DWT
a DWT
a DWTi
‘‘Lena-I1’’ (1,4) ( N i ⫽5)
7.312 20.979
7.289 16.375
7.287 18.621
Entropy SF IQI RMSE
7.457 20.839 0.976 3.048
7.378 16.629 0.974 5.997
7.441 2.909 0.975 1.640
7.416 19.176 0.960 13.908
7.353 19.152 0.965 8.760
7.427 20.680 0.975 1.853
7.443 21.193 0.975 2.713
7.442 18.647 0.979 2.646
‘‘Lena-I2’’ (1,4) ( N i ⫽5)
7.312 20.979
Entropy SF
7.532 21.107
7.358 15.293
7.422 18.518
7.567 19.890
7.408 19.673
7.530 21.306
IQI RMSE
0.962 12.783
0.958 15.566
0.962 17.542
0.952 13.054
0.955 9.652
0.960 12.489
7.470 21.713 0.966
7.450 18.886 0.972
6.378
5.086
7.365 16.703
7.30 18.936
Eight fusion methods 共five pyramids plus three DWTs兲 were tested on two simulated image pairs—‘‘Lena-I1’’ and ‘‘Lena-I2.’’ The converged parameters of aDWTi 共iterative aWT)—the DWT level and the wavelet length (L d ,L w ) and the number undergone iterations (N i ) are listed below the imagery name in the first column. All seven noniterative fusion methods 共expect for aDWTi) were done with default parameter (L d ,L w )⫽(4,4). The entropies and spatial frequencies of the reference 共ground truth兲 image and input images are also shown in the table.
共2兲 there must be an ideal value for the metric that is used as a ‘‘destination’’ for judging the iteration convergence; and 共3兲 the error of the metric values 共obtained by subtracting the current metric value from the ideal metric value兲 should indicate the error direction that is used to direct the parameter adjustment 共i.e., increment or decrement兲. Requirements 1 and 2 are necessary, while requirement 3 is optional but will expedite the convergence of iteration. Previous experiments18 have pointed to an important relationship between the fused image quality and the wavelet properties, that is, a higher level DWT decomposition 共with smaller image resolution at higher scale兲 or a lower order of wavelets 共with a shorter length兲 usually resulted in a more sharpened fused image. If measured with IQI, the value usually tends to be large for a sharpened image. This means that we can use the level of DWT decomposition (L d ) and the length of a wavelet (L w ) as adjusted parameters of an iterative aDWT algorithm. With the definition of IQI, we know that it has an ideal value, 1, but it can not give the error direction because 0⬍IQI⭐1. Of course, a termination condition is required to stop the fusion iteration 共Fig. 3兲. The fusion iteration is designed to stop when one of the following conditions is met: 共1兲 convergence at the destination point—the absolute value of 共IQI-1兲, i.e., abs共IQI-1兲, is smaller than a designated toler-
ance error 共for example, 0.005兲; 共2兲 convergence at some point but not at the destination point—that is, when there is no significant change of the IQI value between two adjacent iterations 共e.g., the change ⬍0.0005兲; 共3兲 no convergence resulting from an IQI value that is decreasing or fluctuating but generally decreasing for subsequent iterations; and 共4兲 no convergence resulting when the parameter boundaries are reached. In implementing the iteration of a fusion procedure, appropriate boundaries of varying parameters should be designated based on the definition of parameters and the context. The details of implementation are depicted in the next section. 4 Experimental Results and Discussion The experiments were organized to test a total of eight image fusion algorithms 共i.e., five pyramid-based and three DWT-based methods兲 on four types of imagery 共already well registered and with 256 gray levels兲: 共1兲 two simulated image pairs, 共2兲 three frequently used samples, 共3兲 image intensified and IR paired images 关obtained from the Army Night Vision Electro-optic Sensors Directorate 共NVESD兲兴, and 共4兲 near-IR and IR paired images 共obtained by our lab兲. We applied each fusion method to the four imagery groups, and calculated their fusion performance with the four quantitative measures. All experimental results are given in
Table 2 The fused image quality evaluations of three metrics (entropy, SF and IQI). Imagery
Input A
Input B
Metric
Lapl.
Ratio
Contr.
Grad.
Morph.
DWT
a DWT
a DWTi
Clock (6,7) ( N i ⫽15)
6.978 14.071
6.924 11.171
Entropy SF
7.140 13.235
7.309 11.033
7.227 16.095
7.356 12.222
6.965 12.150
7.221 14.238
7.461 16.339
IQI
0.889
0.808
0.928
0.876
0.855
0.894
0.924
7.409 16.540 0.927
Medical (5,10) ( N i ⫽14)
1.713
5.656
Entropy
6.468
3.595
1.741
6.455
5.738
5.689
6.787
6.874
21.334
20.858
SF IQI
19.452 0.698
7.234 0.163
16.134 0.300
19.625 0689
20.712 0.600
12.913 0.425
27.811 0.750
27.918 0.780
5.445
5.454
Entropy
7.272
6.996
6.902
7.597
6.616
7.091
7.370
7.251
53.769
46.857
SF
42.468
28.796
40.078
42.297
31.709
35.409
60.839
60.916
IQI
0.831
0.635
0.77
0.788
0.697
0.739
0.866
0.868
Remote (5,3) ( N i ⫽14)
Eight fusion methods were tested on three commonly used samples. The converged parameters of aDWTi⫺(L d ,L w ) and N i are listed below the imagery name in the first column. All seven noniterative fusion methods were done with default parameters (L d ,L w )⫽(4,4). The entropies and spatial frequencies of input images are also shown in the table. Optical Engineering
037003-6
March 2005/Vol. 44(3)
Zheng, Essock, and Hansen: Advanced discrete wavelet transform . . .
Tables 1 to 4 in Sec. 4.1 where the best 共bold兲 and second best 共italic兲 performances are highlighted. Some selected fused images are illustrated in Figs. 6 to 13 in Sec. 4.1. For imagery where the ground truth image is available, the RMSE is the most reasonable measure that indicates how close this fused image is to the ground truth. For imagery without ground truths, however, the IQI is relatively reliable, which gives a value 共between 0 and 1兲 as an indicator of how similar the fused image is to both input images. Since the potential artificial distortion during the fusion process can also increase the entropy or SF values of the fused image, no judgment can be made by directly comparing the entropy or SF values 共refer to Table 1 in Sec. 4.1兲. However, they still show how much information was contained in that image. The DWT decomposition level, L d ⫽4 共used more often in the image fusion literature兲, was designated for all seven fusion algorithms except for the iterative aDWT (aDWTi). In the regular DWT method, the second-order Daubechies wavelets 共a conventional choice兲 were used, while the fourth-order symlets 共as modifications to the Daubechies family that are nearly symmetrical wavelets兲 were selected for the aDWT. In the aDWTi, symlets were also selected with adjustable parameters of the DWT decomposition level (L d ) and the wavelet length (L w ). The extreme values of two parameters are given as 1⭐L d ⭐L d max and 2⭐L w ⭐10. Experiments showed that the function IQI (L d ) is approximately monotonic 共i.e., either increasing or decreasing兲 while IQI (L w ) changes in a less predictable fashion 共see Figs. 4 and 5兲. In addition, varying L d has a larger impact on the fused image quality than changing L w . Therefore, in the iterative aDWT algorithm, parameters L d and L w were adjusted separately, which dramatically reduced the computation loads 共refer to the number of iterations N i in Table 1 in Sec. 4.1兲 comparing with jointly varying parameters 共for instance, N i ⫽8⫻9⫽72 for a 512 ⫻512 image兲 achieved with the following steps: 共1兲 starting with the given initializations of L d ⫽1 and L w ⫽4; 共2兲 next was to vary L d until IQI decreases; 共3兲 with this fixed L d , change L w from 2 to 10; 共4兲 last, find the maximum IQI. The current experiments showed that this separate parameter changing works perfectly to find the optimal IQI 共Table 2 in Sec. 4.1兲. 4.1 Experimental Results In the following analysis, all comparisons focused on the IQI metric because there is no standard or reference value for the entropy or SF metric, however, they are also given in all tables. To save space, five pyramid fusions were abbreviated as: Lapl. 共Laplacian兲, Ratio, Contr. 共contrast兲, Grad. 共gradient兲, and Morph. 共morphological兲. 4.1.1 Two simulated image pairs (from ‘‘Lena’’) Two input images were generated by filtering a given image 关‘‘Lena’’ image, the ground truth or reference image, as shown in Fig. 6共a兲兴 with a 5⫻5 Gaussian window. The ‘‘Lena’’ image was divided into 16 blocks, eight of which were randomly chosen to be blurred as one of the input images, referred to as image A. The other eight blocks were blurred to form image B. This resulted in ‘‘Lena’’ imagery Optical Engineering
1 共‘‘Lena-I1’’兲. A second set, ‘‘Lena’’ imagery 2 共‘‘LenaI2’’兲, was constructed by further reducing 16 gray levels after Gaussian blurring. The orthogonal stripes, as shown in Figs. 6共b兲 and 6共c兲, were caused by sliding the window along image block borders. It is more difficult to fuse ‘‘Lena-I2’’ perfectly because the input images differ in terms of brightness and contrast. The image quality evaluation results of the fused images by the eight algorithms are given in Table 1 where the converged parameters (L d ,L w ) and the number of iterations (N i ) for the aDWTi are also shown 共below the imagery name兲. For ‘‘Lena-I1,’’ judged on RMSE, the best method is the contrast pyramid, however, aDWTi did the best according to the measures of IQI. For ‘‘Lena-I2,’’ the aDWTi had the best performance with both measures of RMSE and IQI, and the aDWT did the second best based on the IQI measure. Only three fused images 共same as following figure illustrations兲 were illustrated in Figs. 6共d兲 to 6共f兲 because the Laplacian pyramid was shown to be the best among five pyramid methods, and the regular DWT was compared to the aDWTi. The fused image by the aDWT was not shown here since it is quite close to that of aDWTi 共refer to the IQI measures in Table 1兲. In fact, it is quite hard to visually examine the difference between these fused images, especially from the scaled hardcopies. 共That is particularly true for ‘‘Lena-I1,’’ which is not displayed here.兲 Figure 4 shows two function distributions of IQI (L d ,L w ) and RMSE (L d ,L w ) while fusing the simulated pair of ‘‘Lena-I2.’’ Figure 4共a兲 clearly shows that IQI (L d ) is a monotonically decreasing function. By comparing Figs. 4共a兲 and 4共b兲, we see that two metrics 共IQI and RMSE兲 are very consistent, which means that a large IQI corresponds to a small RMSE. The consistency between IQI and RMSE was also shown in Table 1, where for ‘‘Lena-I2,’’ the algorithm of smallest RMSE coincided with that of largest IQI. In ‘‘Lena-I1,’’ the IQI corresponding to the smallest RMSE 共1.640兲 is 0.975, which is very close the largest IQI, 0.979 共where RMSE⫽2.646).
4.1.2 Three frequently used samples Three commonly used image samples that were tested included two clocks imaged at different focal planes; two different types of medical imagery 关computed tomography 共CT兲 and magnetic resonance imaging 共MRI兲兴 and a pair of remote sensing images 共IR and low-light sensors兲. The quantitative assessments of the fused images are listed in Table 2. For the medical and remote pairs, the aDWTi’s performance was the best according to the metric of IQI, and the aDWT was the second best. For the clock pair, the contrast pyramid did the best with IQI (Contr.)⫽0.928, however, the IQI (aDWTi)⫽0.927 is a very close second. The fused images are shown in Figs. 7–9. Perceptually, the aDWTi fused images appear to look the best, although this was not measured empirically. Note that no postprocessing was imposed on these fused images. Figure 5共a兲 shows the evaluation of function IQI (L d ,L w ) while fusing the medical image pair. Figure 5共b兲 shows the distributions of IQI (L d ) and IQI (L w )—two slices of Fig. 5共a兲 at L w ⫽4 and L d ⫽4, respectively. Figure
037003-7
March 2005/Vol. 44(3)
Zheng, Essock, and Hansen: Advanced discrete wavelet transform . . .
Fig. 7 Image fusion with off-focus images (512⫻512 pixels): (a) input image A, (b) input image B, (c) image fused by iterative a DWTi, (d) image fused by Laplacian pyramid, and (e) image fused by regular DWT.
Fig. 8 Image fusion with medical images (256⫻256 pixels): (a) image A (CT), (b) image B (MRI), (c) image fused by iterative a DWTi, (d) image fused by Laplacian pyramid, and (e) image fused by regular DWT.
Fig. 9 Image fusion with remote sensing images (512⫻512 pixels): (a) image A (IR), (b) image B (low light), (c) image fused by iterative a DWTi, (d) image fused by Laplacian pyramid, and (e) image fused by regular DWT. Table 3 The optimization traces of three metrics while fusing the medical pair with the iterative a DWT ( a DWTi). ( L d , L w)
(1,4)
(2,4)
(3,4)
(5,4)
(6,4)
6.820 28.227 0.772
6.825
6.834
6.844
6.850
6.874
28.213
29.347
27.766
27.949
27.918
0.765
0.771
0.779
0.779
0.780
Entropy
6.171
6.419
6.607
6.787
SF
20.289
23.257
26.838
27.811
IQI
0.616
0.639
0.710
0.750
(5,2)
(5,6)
(5,8)
„5,10…
(4,4)
The aDWTi algorithm tried the fusion with parameters 共6,4兲, but finally L d ⫽5 was selected 共with larger IQI兲 to enter next iterations of varying L w . Only the evaluations of even numbers of L w were given here to just simplify the table.
Fig. 10 Image fusion with the image pair NVESD10 (531⫻401 pixels) from NV-I1: (a) image A (II), (b) image B (IR), (c) image fused by iterative a DWTi (IQI⫽0.817), (d) image fused by Laplacian pyramid (IQI⫽0.716), and (e) image fused by regular DWT (IQI⫽0.565). Optical Engineering
037003-8
March 2005/Vol. 44(3)
Zheng, Essock, and Hansen: Advanced discrete wavelet transform . . . Table 4 The means and standard deviations (Std. dev.) of three metrics (entropy, SF and IQI). Imagery
Statis.
Input A
Input B
Metric
Lapl.
Ratio
Contr.
Grad.
Morph.
DWT
a DWT
a DWTi
NV-I1 NVESD 24 pairs
Mean
5.968 10.277
6.833 13.750
Entropy SF IQI
6.926 13.900 0.772
6.470 10.018 0.495
6.770 14.398 0.672
6.946 13.676 0.722
6.837 13.258 0.739
6.798 13.503 0.640
7.158 16.710
7.261 16.366
Std. dev.
0.625
0.237
Entropy
0.336
0.605
0.418
0.359
0.407
0.391
0.796 0.208
0.819 0.202
2.853
1.780
SF IQI
1.645 0.062
2.401 0.112
3.194 0.101
1.980 0.065
1.875 0.064
1.682 0.060
1.904 0.079
1.913 0.070
Mean
5.590 15.300
5.936 24.954
Entropy SF IQI
7.001 20.999 0.754
6.512 15.209 0.468
6.636 22.022 0.544
7.075 20.570 0.712
6.857 20.483 0.708
6.898 19.387 0.671
7.077 28.166
7.177 27.773
Std. dev.
1.125
0.641
Entropy
0.458
0.784
0.858
0.432
0.432
0.417
0.766 0.584
0.788 0.538
6.505
9.264
SF IQI
6.888 0.069
4.334 0.160
7.221 0.171
6.597 0.071
6.079 0.071
6.012 0.073
9.345 0.062
9.064 0.063
NV-12 Lab 28 pairs
Eight fusion methods were tested on the NV-I1 共NVESD, 24 pairs兲 and the NV-I2 共Lab, 28 pairs兲. All seven noniterative fusion methods were done with default parameters (L d ,L w )⫽(4,4). The converged parameters of aDWTi (L d ,L w ) are dependent on the input image pair and the means of iterations are N i (NV-I1)⫽13.833, N i (NV-I12)⫽13.607.
5共b兲 shows an almost increasing function of IQI (L d ), while IQI (L w ) contains local fluctuations. The optimization traces of the three metrics obtained after fusing the medical imagery pair with the iterative aDWT (aDWTi) algorithm are presented in Table 3. Fusion with the aDWTi algorithm was tried with parameters values of 共6,4兲 during the iteration of varying L d , but finally the best result 共in the sense of IQI兲 given by (L d ,L w )⫽(5,4) was selected, the algorithm then entered the next iteration of varying L w . Eventually, the maximum of IQI 共⫽0.780兲 was chosen as the final result of the aDWTi. 4.1.3 Two types of night vision imagery Two types of night vision imagery were tested in the current experiments: 共1兲 24 pairs of image intensified 共II兲 and IR night-vision images 共Army NVESD imagery, NV-I1兲 taken outdoors and 共2兲 28 pairs of near-IR and IR images 共Lab imagery, NV-I2兲 that were obtained both indoors and outdoors 共Indigo Systems, Inc., IR and near-IR Phoenix cameras兲. The source images were moderately noisy due to collection conditions. Therefore, to suppress the noise, a 2-D median filter 共with a 3⫻3 sliding window兲 was first applied to all images before any fusion operation. This is a common preprocessing practice in fusing nighttime imagery; moreover, denoised images were used for all three algorithms 共appropriate to compare the fused images兲. The
filtered images are not shown here, but this filtering operation was not detrimental to the fused image quality 关see Fig. 10共c兲 to 共e兲兴. The complete assessments of the eight algorithms along with three evaluation measures are listed in Table 4. Here, the means and standard deviations of performance over all images in each group were computed. Although the image contents varied considerably, the averaged values still give a sense of an algorithm’s performance. Keep in mind that the IQI values are always between 关0,1兴 no matter what the analyzed image contents were. Judging from the IQI values, the aDWTi did the best, and the aDWT was the second best. Two typical pairs were drawn from each group and are illustrated in Figs. 10–13. The aDWTi results appear the best on causal visual inspection. Since there were multiple image pairs for the night vision image sets, we were able to conduct a statistical analysis of the different IQI values produced by each fusion method examined in the current set of experiments. Specifically, a between-groups one-way analysis of variance 共ANOVA兲 was performed on the IQI measures of both night vision imagery sets. Bonferroni-adjusted post-hocs were used for the multiple comparison portion of the analysis. The significant main effects were as follows: for NV-I1, F(7,184)⫽42.327, p⬍0.0005 and for NV-12, F(7,216) ⫽34.855, p⬍0.0005. For NV-I1 共NVESD imagery兲, the performance of aDWTi was significantly better (p
Fig. 11 Image fusion with the image pair NVESD11 (531⫻401 pixels) from NV-I1: (a) image A (II), (b) image B (IR), (c) image fused by iterative a DWTi (IQI⫽0.795), (d) image fused by Laplacian pyramid (IQI⫽0.768), and (e) image fused by regular DWT (IQI⫽0.602). Optical Engineering
037003-9
March 2005/Vol. 44(3)
Zheng, Essock, and Hansen: Advanced discrete wavelet transform . . .
Fig. 12 Image fusion with the image pair Lab09 (220⫻220 pixels) from NV-I2: (a) Image a (near IR), (b) image B (IR), (c) image fused by iterative a DWTi (IQI⫽0.756), (d) image fused by Laplacian pyramid (IQI⫽0.708), and (e) image fused by regular DWT (IQI⫽0.543).
⬍0.015) than that of other six methods except for aDWT. For NV-12 共Lab imagery兲, the performance of aDWTi was significantly better (p⬍0.016) than the other five methods except for aDWT and Laplacian pyramid. 4.2 Discussion In the analysis described in the preceding sections, the metrics of entropy and SF were not described in detail. In fact, the SF is a more reliable and sensitive measure than the entropy. From the SF definition in Eq. 共9兲, the value of SF reflects the detail or edge information contained in that image, thus it is sensitive to minor intensity changes in an image. Figure 14 shows the metric comparison between RMSE and SF, while fusing ‘‘Lena-I1.’’ The SF error 共SFE兲 was obtained by subtracting SFs from the reference SF, 20.979. The smaller is the absolute SFE, the better is the fused image. It is clear that the SFE is very consistent with the RMSE. The problem is that there is no reference SF in a realistic image fusion application. On the other hand, the entropy is less sensitive to the detail changes of an image 共refer to Table 1兲. The iterative fusion algorithm, aDWTi, can achieve the optimal fusion 共described by the IQI measurement, parameters, iterations, etc.兲 by adapting its parameter settings for the different input images. The aDWTi algorithm is obviously better than any of the noniterative algorithms examined here 共including aDWT) judged on the IQI metric or visual inspection. In addition, the aDWTi is easily implemented to find the optimal IQI by separately varying two parameters 共see Figs. 4 and 5兲, the DWT decomposition level (L d ) and the wavelet length (L w ), with no more than
15 iterations. And the number of iterations may be further reduced by properly initializing parameters or optimizing the termination conditions. The evident drawback of using IQI as the feedback of an iterative fusion algorithm is that the error IQI (⫽IQIF ⫺1) cannot provide the error direction 共requirement 3 in Sec. 3.3兲 because the error IQI is always negative. As mentioned before, SF is a potential metric that can be developed to measure the error direction 共see Fig. 14兲. We will report further work on how to use the SF measure as the feedback of an iterative fusion algorithm in a subsequent paper. Overall, the iterative aDWT (aDWTi) produced the best results in fusing inhomogeneous imagery among others. Typically the noniterative aDWT was the second best. For off-focus images, both of which have similar brightness and contrast, the contrast pyramid could yield the best fusion among other seven methods. For night vision imagery where brightness and contrast were very different between the two input images, the Laplacian pyramid usually produced the third best fused image judged on the IQI metric, however, it often caused a visually overshot result in the high-contrast regions 关see Fig. 10共d兲兴. 4.3 Future Work We plan to extend the definition of SF and develop its use as feedback of an iterative fusion algorithm. Importantly, we plan to conduct functional evaluation5 to evaluate fusion performance based on human perceptual performance and compare the results to those from the quantitative metrics.
Fig. 13 Image fusion with the image pair Lab15 (220⫻220 pixels) from NV-I2: (a) image A (near IR), (b) image B (IR), (c) image fused by iterative a DWTi (IQI⫽0.852), (d) image fused by Laplacian pyramid (IQI⫽0.757), and (e) image fused by regular DWT (IQI⫽0.596). Optical Engineering
037003-10
March 2005/Vol. 44(3)
Zheng, Essock, and Hansen: Advanced discrete wavelet transform . . .
6. 7. 8. 9. 10. 11.
Fig. 14 Metric comparison between RMSE and SF while fusing ‘‘Lena-I1.’’ The SF was obtained by subtracting SFs from the reference SF, 20.979. The smaller is the absolute SFE, the better is the fusion. It is clear that the SFE is very consistent with the RMSE.
12.
13.
5 Conclusions We presented a new image fusion method, the advanced DWT (aDWT), which incorporated PCA and morphological processing into a regular DWT fusion procedure. Further, the aDWT was developed into an iterative fusion procedure directed by the metric of IQI. We compared the image fusion performance of six common methods 共five pyramid methods and a regular DWT method兲 and our novel methods, the aDWT and the iterative aDWTi (aDWTi), based on four important quantitative measures—RMSE, the entropy, the SF, and the IQI. Overall, across the four different kinds of imagery, the aDWTi performed the best, and the aDWT was, for the most part, the second best compared the regular DWT or pyramid methods judged on the IQI metric and visual inspection of the fused imagery. Different image sources vary considerably in their intensities, contrast, noise, and intrinsic characteristics; therefore a large challenge for a fusion algorithm is to perform well across a variety of image sources, thus, aDWTi and aDWT are very promising to meet this goal.
14.
Acknowledgment
25.
This work was supported by Grant No. N00014-03-1-0224 from the Office of Naval Research.
26.
15. 16. 17. 18.
19. 20. 21. 22. 23. 24.
27.
References 1. J. L. VAN Genderen and C. Pohl, ‘‘Image fusion: Issues, techniques and applications,’’ in Intelligent Image Fusion, Proc. EARSeL Workshop, J. L. van Genderen and V. Cappellini, Eds., pp. 18 –26, Strasbourg, France 共Sep. 1994兲. 2. L. D. Keys, N. J. Schmidt, and B. E. Phillips, ‘‘A prototype example of sensor fusion used for a siting analysis,’’ in Technical Papers 1990, ACSM-ASPRS Annual Conv. Image Processing and Remote Sensing 4, pp. 238 –249 共1990兲. 3. R. H. Rogers and L. Wood, ‘‘The history and status of merging multiple sensor data: an overview,’’ in Technical Papers 1990, ACSMASPRS Annual Conv. Image Processing and Remote Sensing 4, pp. 352–360 共1990兲. 4. E. A. Essock, M. J. Sinai, J. S. McCarley, W. K. Krebs, and J. K. DeFord, ‘‘Perceptual ability with real-world nighttime scenes: imageintensified, infrared, and fused-color imagery,’’ Hum. Factors 41共3兲, 438 – 452 共1999兲. 5. E. A. Essock, J. S. McCarley, M. J. Sinai, and J. K. DeFord, ‘‘Human Optical Engineering
28. 29. 30. 31. 32. 33. 34.
037003-11
perception of sensor-fused imagery,’’ in Interpreting Remote Sensing Imagery: Human Factors, R. R. Hoffman and A. B. Markman, Eds., Lewis Publishers, Boca Raton, Florida 共Feb. 2001兲. C. Pohl and J. L. Van Genderen, ‘‘Review article: multisensor image fusion in remote sensing: concepts, methods and applications,’’ Int. J. Remote Sens. 19共5兲, 823– 854 共1998兲. O. Rockinger, ‘‘Pixel level fusion of image sequences using wavelet frames,’’ in Proc. 16th Leeds Applied Shape Research Workshop, pp. 149–154, Leeds University Press 共1996兲. H. Li, B. S. Manjunath, and S. K. Mitra, ‘‘Multisensor image fusion using the wavelet transform,’’ Graph. Models Image Process. 57共3兲, 235–245 共1995兲. T. Pu and G. Ni, ‘‘Contrast-based image fusion using the discrete wavelet transform,’’ Opt. Eng. 39共8兲, 2075–2082 共2000兲. D. A. Yocky, ‘‘Image merging and data fusion by means of the discrete two-dimensional wavelet transform,’’ J. Opt. Soc. Am. A 12共9兲, 1834 –1841 共1995兲. J. Nunez, X. Otazu, O. Fors, A. Prades, V. Pala, and R. Arbiol, ‘‘Image fusion with additive multiresolution wavelet decomposition; applications to spot⫹landsat images,’’ J. Opt. Soc. Am. A 16, 467– 474 共1999兲. F. Jahard, D. A. Fish, A. A. Rio, and C. P. Thompson, ‘‘Far/near infrared adapted pyramid-based fusion for automotive night vision,’’ in IEEE Proc. 6th Int. Conf. on Image Processing and its Applications (IPA97), pp. 886 – 890 共1997兲. B. Ajazzi, L. Alparone, S. Baronti, and R. Carla, ‘‘Assessment of pyramid-based multisensor image data fusion,’’ in Proc. SPIE 3500, 237–248 共1998兲. S. Li, J. T. Kwok, and Y. Wang, ‘‘Combination of images with diverse focuses using the spatial frequency,’’ Infusionstherapie 2共3兲, 169–176 共2001兲. M. Beauchemin, K. B. Fung, and X. Geng, ‘‘A method based on local variance for quality assessment of multiresolution image fusion,’’ Proc. IAPRS, Vol. XXXIV, p. B-32ff 共2002兲. L. W. Leung, B. King, and V. Vohora, ‘‘Comparison of image data fusion techniques using entropy and INI,’’ in Proc. ACRS, Vol. 1, pp. 152–157 共2001兲. G. Piella and H. Heijmans, ‘‘A new quality metric for image fusion,’’ in Proc. 2003 Int. Conf. on Image Processing, Barcelona, Spain 共2003兲. Y. Zheng, E. A. Essock, and B. C. Hansen, ‘‘An advanced image fusion algorithm based on wavelet transform—incorporation with PCA and morphological processing,’’ Proc. SPIE 5298, 177–187 共2004兲. P. J. Burt and E. H. Adelson, ‘‘Merging images through pattern decomposition,’’ Proc. SPIE 575, 173–182 共1985兲. Z. Wang and A. C. Bovik, ‘‘A universal image quality index,’’ IEEE Signal Process. Lett. 9共3兲, 81– 84 共2002兲. A. M. Eskicioglu and P. S. Fisher, ‘‘Image quality measure and their performance,’’ IEEE Trans. Commun. 43共12兲, 2959–2965 共1995兲. P. J. Burt, ‘‘The pyramid as structure for efficient computation,’’ in Multiresolution Image Processing and Analysis, A. Rosenfeld, Ed., pp. 6 –35, Springer-Verlag, New York/Berlin 共1984兲. P. J. Burt and E. Adelson, ‘‘The Laplacian pyramid as a compact image code,’’ IEEE Trans. Commun. Com-31共4兲, 532–540 共1983兲. A. Toet, ‘‘Image fusion by a ratio of low pass pyramid,’’ Pattern Recogn. Lett. 9共4兲, 245–253 共1989兲. A. Toet, L. J. Van Ruyven, and J. M. Valeton, ‘‘Merging thermal and visual images by contrast pyramid,’’ Opt. Eng. 28共7兲, 789–792 共1989兲. A. Toet, ‘‘Hierarchical image fusion,’’ Mach. Vision Appl. 3共1兲, 1–11 共1990兲. A. Toet, ‘‘Multiscale contrast enhancement with application to image fusion,’’ Opt. Eng. 31共5兲, 1026 –1031 共1992兲. P. J. Burt, ‘‘A gradient pyramid basis for pattern-selective image fusion,’’ SID Int. Symp. Digest Tech. Papers 16, 467– 470 共1985兲. P. J. Burt and R. J. Lolczynski, ‘‘Enhanced image capture through fusion,’’ in IEEE Proc. 4th Int. Conf. Computer Vision, pp. 173–182 共1993兲. S. Richard, F. Sims, and M. A. Phillips, ‘‘Target signature consistency of image data fusion alternatives,’’ Opt. Eng. 36共3兲, 743–754 共1997兲. A. Toet, ‘‘A morphological pyramid image decomposition,’’ Pattern Recogn. Lett. 9共4兲, 255–261 共1989兲. G. K. Matsopoulos, S. Marshall, and J. Brunt, ‘‘Multiresolution morphological fusion of MR and CT images of the human brain,’’ IEE Proc. Vision Image Signal Process. 141共3兲, 137–142 共1994兲. G. K. Matsopoulos and S. Marshall, ‘‘Application of morphological pyramids: fusion of MR and CT phantoms,’’ J. Visual Commun. Image Represent 6共2兲, 196 –207 共1995兲. R. C. Gonzalez and R. E. Woods, Digital Image Processing, 2nd ed., Prentice Hall, Upper Saddle River, NJ 共2002兲. March 2005/Vol. 44(3)
Zheng, Essock, and Hansen: Advanced discrete wavelet transform . . . Yufeng Zheng received his PhD degree from the Tianjin University, China, in 1997. He is currently a postdoctoral research associate with the University of Louisville, Kentucky. His research interests are digital image processing, including image registration and fusion, noise reduction, image restoration and enhancement, edge detection, segmentation, and pattern recognition.
Edward A. Essock is a professor of Psychological and Brain Sciences and also of Ophthalmology and Visual Science with the University of Louisville. He is a vision scientist with broad research interests that include human factors and clinical applications of vision science, as well as basic science research. He received his training in vision science at Brown University, where he received his PhD degree in 1981, and as a postdoctoral fellowship at the University of California Berkeley with Jay Enoch in the School of Optom-
Optical Engineering
etry. Dr. Essock has authored more than a 100 scientific papers, book chapters, and meeting publications. His current research focuses on detection and prediction of progression in glaucoma based on assessments of the nerve fiber layer thickness and biases in the perception of orientation in natural scenes (the ‘‘horizontal effect’’) and associated issues of cortical gain control. Bruce C. Hansen received his BS degree from the University of Michigan, Flint, in 2000, and his MA and PhD degrees from the University of Louisville, Kentucky, in 2003 and 2004, respectively, all in experimental psychology. He is currently a postdoctoral research associate with McGill University, Montreal, Quebec, Canada. His research interests include human visual processing of broadband spatial structure, multisensor image fusion, neural network modeling, multisensory integration, and human factors research.
037003-12
March 2005/Vol. 44(3)