Advanced Portal Images Processing for Cobalt Radiotherapy Systems and Lineal Accelerators for cancer treatments Diana Valdés Cabrera Department of Bioengineering, Center of Molecular Immunology, Cuba
[email protected]
Abstract It is presented an investigation project to design software that allows image processing and treatment of an Electronic Portal Image Device (EPID) for lineal accelerators and cobalt machines. For the development of the software it was used the programming language MATLAB and DICOM RT images with a spatial resolution in the isocenter of 0.40 mm/pixel, dimensions of 1024x1024 pixels and 65536 tones in greyscale, that were taken by a linac from Elekta trademark located in the National Institute of Oncology and Radiobiology. Methods and algorithms implemented were the improvements in the contrast, brightness, equalization and inversion of greyscale of images through modifications in their histogram; the possibility of making rotations, segmentations of zones of interest basing in users criteria for thresholding taking in count the visualization of pixels intensity and measuring of distances in pixels. For the calculations of displacements and rotations between the reference and the actual image was used the canny method for edges detection of the radiation fields and anatomical structures, and normalized bidimensional correlation algorithms for seeking and calculation of objects of interest between two images. The results were obtained using 23 pairs of images of six treatments and the average of the reported errors were: horizontal, vertical and rotational fields errors: ± 1.531 mm, ± 1.278 mm and ± 0.087°; horizontal, vertical and rotational anatomical structures errors: ± 0.766 mm, ± 0.573 mm, ± 0.174°. These values are under the limit values for each one of these treatments according to the consulted bibliography. Index Terms: radiotherapy, lineal accelerator, portal images
1. Introduction Portal images are necessary to verify the right positioning of patients during radiotherapy treatments. They are obtained by the interaction of photons or high energy X Rays with the human tissue and the result of these interactions is printed in a physical or digital imaging support [2]. They are used to guarantee the quality of these treatments by controlling the precision of the place when doses are given, and the minimum doses in the nearest places [27]. In Cuba, the Radiotherapy Area of the National Cancer System is divided in nine services with Oncology Departments. They have installed four linacs and nine cobalt machines [1]. The purpose of this development project is to improve the quality of these treatments through semiautomatic software that makes a verification of the right positioning of the patient with the radiation beam in linacs and in cobalt machines, that don’t have EPID attached. Images correlation is useful in some anatomical locations like head, neck or breast and also for the pelvic zone. Before
correlation it has to be applied algorithms for edge detections with their respective thresholds for radiation fields and anatomical structures [27]. A simple graphical interface is also helpful to show the results of the comparison and for portal images management and modification.
2. Methods and materials In this study were used simple and double exposure portal images taken with the fluoroscopic EPID iView GT from the linac Elekta Precise 5735. Each image contains 1024x1024 pixels and 65536 tones in greyscale, a spatial resolution in the isocenter of 0.40 mm/pixel [13]. For software programming was used the technical computing language MatLab & Simulink Release 2010a from The MathWorks Inc.
2.1. Image enhancement For digital image processing were used methods and functions to enhance some qualities of these images like brightness, contrast, equalization and segmentation. 2.1.1. Brightness and contrast It was used the tool imcontrast from MATLAB that allows the user to changue the data range trough image histogram in an interactive window. 2.1.2. Equalization The histogram of the image is modified with the function histeq to obtain a better distributed one for equalizing the image. 2.1.3. Negative It has to be done the mathematical transformation to inverts the greyscale of the original image.
Where: S: Processed pixel (out). r: Pixel from the original image (in). L: Grey level. 2.1.4. Segmentation It is used to select the radiation fields using thresholding selected by user. It is applied a condition and all the pixels according with the conditions remains in the resulting image.
2.2. Comparison algorithms 2.2.1. Edge detections Edges are detected by the Canny method, through the searching of the local maximum of the gradient of the image. It has to be defined an edge point as a threshold for the method and then, edges are detected using the function edge. Equations below show the gradients from the row GR(i,j) and the column GC(I,j) that can be approached by the difference of neighbor pixels from the same row and column respectively [25].
The correlation function has the disadvantage of been highly sensitive to the amplitude changes of w and f. To overcome this problem, it is developed the searching using correlation coefficients. It is define as:
(6)
Where x = 0,1,2,…,M-1, y = 0,1,2,…,N-1, is the average value of pixels in w, is the average value of f in the region that matches with the actual location of w, and the sums are taken over the common coordinates of f and w. The correlation coefficient γ(x,y) will have a range of possible values between -1 and 1. The MATLAB function normxcorr2 (template, A) calculates 2D normalized cross correlation of the matrixes template and A. the A matrix must be greater than template and values of template can’t be all equals [30].
2.2.2. Normalized bidimentional correlation for searching and detection Discrete bidimensional correlation of two functions f(x,y) and h(x,y) with a size M x N is defined as
The main use of correlation is for searching and location, and one of the most important applications is the comparison between images to find how deep is the resemblance between a group of well-known images and an unknown one. In the searching, f(x,y)is an image that has objects or regions. To know if f contains a particular object or region, it has to be declared h(x,y) as this object or region of interest (template). Then, if the template is found, the correlation between the two functions will be the maximum in the point where h find a correspondence with f. A preprocessing like scaling and lining is mostly needed in practical applications [28]. These topics are important to find a subimage w(x,y) with size J x K inside an image f(x,y) with a size M x N. Simple correlation between f(x,y) and w(x,y) is:
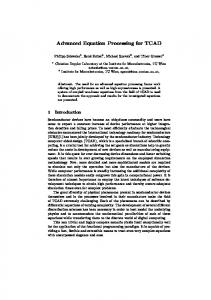
2.3. Program main purpose and graphical interface The main purpose of this program for portal imaging is to assure the right location of the patient during treatments. If it is done regularly, it decreases magnitude and frequency of field positioning and anatomical errors of each image. Techniques of computerized measuring are much more effective than manual approaches in detections of displacements of anatomic fields. A quantitative comparison of images uses registration. This process requires a reference image, showing patient in the right position, and images of the portal treatment that will be compared. Reference image should come from an X Ray simulator, an ACT, a digitally reconstructed radiography or a portal image. In this study, it will be only used portal images to avoid possible scaling errors [2]. Graphical User interface was done in the GUIDE (Graphical Use Interface Development Environment) of Mathworks. It is shown main window with images of cranium treatment below.
Fig. 2: Main window of the graphical interface of the program. Fig.1: Process for calculation of cross correlation c(x,y).
3. Discussion and Results Two geometric deviations were analyzed: radiation field and anatomical structures. Deviations in radiation field represent the reproducibility of the conformed field and anatomical deviations determine the global displacement of patient positioning [27]. The method was evaluated with different treatments and incident directions, and displacements and rotations were calculated in each case. For this evaluation was used the MATLAB file prueba.m that allow move and rotate images
with wellknown values and then were compared with those obtained with the program. Directions of horizontal and vertical displacements were the same than the coordinate axis. Negative sign indicates horizontal displacement to the left and vertical down displacement. Positive sign indicates horizontal displacement to the right and vertical up displacement. Rotations are clockwise comparing active image with reference. Data charts shown below show difference between results obtained with the program and real displacements for six treatments (23 pairs of images).
Table 1: Reported errors between real values and values obtained by software. Treatment
Direction X field errors X anat. errors Y field errors
Y anat. errors
Rot field
Rot. anat.
errors
errors
Head-neck
AP
-2.64 mm
5.6 mm
-2.2 mm
2 mm
0
1°
Head-neck
AP
1.2 mm
0
0.4 mm
0
0
0
Head-neck
AP
-0.6 mm
1.6 mm
1 mm
1.4 mm
0
0
Cranio
AP
8 mm
3.6 mm
-0.6 mm
-3 mm
0
-1°
Cranio
AP
0
0
-0.8mm
0
0
0
Cranio
ML
3.6 mm
0
-2 mm
0
0
0
Breast
ML
-1.24 mm
1.8 mm
-3 mm
2.3 mm
0
0
Breast
ML
1.12 mm
0
1.34 mm
-0.00568mm
0
0
Breast
ML
0
0
0
-0.00568mm
0
0
Breast -
ML
-1.28 mm
0
-1.04 mm
0
0
0
AP
-0.74 mm
0
-1.48 mm
0
0
0
Prostate
AP
-2.38 mm
-0.6 mm
-1.508 mm
-0.2 mm
1°
-1°
Prostate
AP
-0.592 mm
0
-2.512 mm
-0.00568mm
0
0
Prostate
AP
1.6 mm
0
0.832 mm
-1 mm
0
0
Prostate
AP
-1.6 mm
0
-3.164 mm
-0.00568mm
0
0
Prostate
AP
0
-0.6 mm
0.832 mm
1 mm
0
0
Prostate
ML
0.8 mm
0.4 mm
0.8 mm
0
0
0
Prostate
ML
1.1 mm
1.8 mm
-0.7 mm
-1 mm
0
0
Prostate
ML
0.4 mm
0
-1.2 mm
0
0
0
Prostate
ML
-0.4 mm
0
1.8 mm
-0.00568mm
0
0
Lung
AP
-4 mm
1.2 mm
-0.96 mm
1.2 mm
-1°
-1°
Lung
AP
-0.876 mm
0
-0.19 mm
0
0
0
Lung
AP
1.44 mm
-0.4 mm
1.04 mm
1.04 mm
0
0
supraclavicular Breast supraclavicular
Table 2: Average errors. Treatment
Average field
Average anat
Average field
errors in X
errors in X
errors in Y
Average anat errors Average field in Y
rot. errors
Average anat. rot. errors.
Total
± 1.531 mm
± 0.766 mm
± 1.278 mm
± 0.573 mm
± 0.087°
± 0.174°
4. Conclusions It was implemented software for image processing in MATLAB to determinate the right positioning of patient during radiotherapy treatments against cancer. The system of implemented algorithms allows calculating horizontal and vertical displacements, and rotation angles of radiation fields and anatomical structures of patient trough comparison with reference images. Software was able to calculate displacements registering values closer to real ones.
[16].
5. Acknowledgements
[19]
[17]
[18]
I would like to thank Elier Lara Mas and the work team from Medical Physic in the INOR. Also I would like to thank my professors from Bioengineering in CUJAE.
6. References [1] [2] [3]
[4]
[5]
[6]
[7]
[8]
[9]
[10]
[11]
[12] [13] [14]
[15]
Proyecto INOR: Modificación de EPID para su uso en equipos de Cobalto terapia, 2010. Atherton, S., Radiotherapy Hand Book. 2nd Edition ed2004. Glendinning, A.G., Dosimetric properties of the Theraview Fluoroscopic electronic portal imaging device. The British Journal of Radiology, 2000. 73: p. 517-530. Boer, H.C.J.D., Electronic portal image assisted reduction of systematic set-up errors in head and neck irradiation. Radiotherapy and Oncology, 2001. 61: p. 299-308. Herman, M.G., Clinical Use of Electronic Portal Imaging, in Seminars in Radiation Oncology, 2005. p. 157-167. Kirby, M.C., The performance of a fluoroscopic electronic portal imaging device modified for portability. The British Journal of Radiology, 1999. 72: p. 1000-1005. Díaz, A.L., ¿Es posible realizar el control de calidad diario del haz de radiación empleando el sistema electrónico de imagen portal iview?, in VI Congreso de la Sociedad Cubana de Bioingeniería2005: La Habana. Middleton, M., Paperless and paper-based processes in the modern radiotherapy department. Radiography, 2009. 15: p. 300-305. Langmack, K.A., Review article. Portal imaging. The British Journal of Radiology, 2001. 74: p. 789804. Mitchell, F., A study into the review and verification of breast images treated with isocentric technique. Radiography, 2007. 13: p. 180-186. Topolnjak, R., Breast patient setup error assessment: Comparison of electronic portal image devices and cone-beam computed tomography matching results. Int. J. Radiation Oncology Biol. Phys., 2010: p. 1-9. Technical Note 4. Analysis of data from the QC-3 phantom. OIEA. iview, Users Manual, 2003, Elekta Limited Technical Support. Elmpt, W.V., A literature review of electronic portal imaging for radiotherapy dosimetry. Radiotherapy and Oncology, 2008. 88: p. 289-309. Lasher, D.E., Case study of radiation therapy treatment of a patient with a cardiac ventricular
[20]
[21]
[22]
[23]
[24]
[25] [26]
[27]
[28]
[29]
[30]
assist device. Journal of Applied Clinical Medical Physics, 2008. 9(4). Solar, J.R., Apéndice, in Procesamiento Avanzado de imágenes. , U.d. Chile, Editor. p. 250-269. Forero, M.G., Aplicación para la lectura y conversión de formatos DICOM no estándar y génesis, in II Congreso Latinoamericano de Ingeniería Biomédica, 2001, Sociedad Cubana de Bioingeniería: La Habana, Cuba. Velandia, Á.G. Software compresor, descompresor, lector y visualizador de imágenes médicas bajo el estándar DICOM 3.0, 2007. Patallo, I.S., Uso del sistema imagen portal electrónica iViewGT para control de calidad del haz de radiación de un acelerador lineal de uso clínico. Revista Cubana de Física, 2010. 27(2B): p. 251256. Tutorial: Programación en MATLAB. Procesamiento Digital de Imágenes.Tecnología Digital de Imágenes, Colectivo de Autores, UNSAM. Jimenez, E.V.C. Visión por Computador utilizando MatLAB y el Toolbox de Procesamiento Digital de mágenes. Vidal, B.J.J., Aplicación del Método de Monte Carlo a la Planificación en Radioterapia y a la Reconstrucción de Espectros de Fotones de Aceleradores Lineales de Partículas (LinAc). in Departamento de Ingeniería Química y Nuclear, 2011, Universidad Politécnica de Valencia: Valencia. Germade, Y.A., Filtrado digital en el procesamiento de imágenes empleando MATLAB, in Convención Científica de Ingeniería y Arquitectura, 2010, ISPJAE: La Habana, Cuba. Díaz, W.R., Comparación de las Técnicas Dinámica y Estática para la Administración de la Dosis en Radioterapia de Intensidad Modulada (IMRT), in Departamento de Física, Facultad de Ciencias, 2011, Universidad Nacional de Colombia: Bogotá D.C., Colombia. Práctica 3: Detección de bordes en una imagen. Segmentación, 2005-2006. Piedrahíta, E.O., Implementación de la Transformada de Hough para la detección de líneas para un sistema de visión de bajo nivel, in Departamento de Ing. Eléctrica, Electrónica y Computación, Facultad de Ingeniería y Arquitectura, 2002, Universidad Nacional de Colombia: Manizales. Franco, L. Elaboración de códigos para el estudio de errores de posicionamiento en pacientes mediante EPIDs. Determinación de los márgenes PTV. Bayonas, P.M., Preprocesado y Registro de Imágenes Médicas Portal con Radiografías Reconstruidas Digitalmente, in Escuela Técnica Superior de Ingeniería de Telecomunicación, 2010, Universidad Politécnica de Cartagena: Cartagena. Informe No. 6: Análisis Probabilista de Seguridad del Proceso de Tratamiento de Radioterapia con un Acelerador Lineal de Uso Médico, in Foro Iberoamericano de Organismos Reguladores Radiológicos y Nucleares, 2009. Inc., T.M., Registering an Image Using Normalized Cross-Correlation, 2010.