Advanced Visual Interfaces Supporting Distributed Cloud-Based Big Data Analysis Marco X. Bornschlegl University of Hagen, Faculty of Mathematics and Computer Science, 58097 Hagen, Germany
[email protected] Abstract. Handling the complexity of relevant data requires new techniques with regard to data access, visualization, perception, and interaction for innovative and successful strategies. As a response to increased graphics performance in computing technologies and Information Visualization, Card et al. developed the Information Visualization Reference Model. Due to further developments in Information Systems as well as Data Analysis and Knowledge Management Systems in recent years, this model has to be adapted for addressing the recent advancements. Thus, the hybridly refined and extended IVIS4BigData Reference Model was derived from the original model to cover the new conditions of the represent situations with advanced visual interfaces providing opportunities for perceiving, managing, and interpreting Big Data analysis results to support insight and emerging knowledge generation. After deriving and qualitatively evaluating the conceptual IVIS4BigData model as well as deriving the competences with focus on supporting management functions, as key consumers of Big Data analysis in Business Intelligence scenarios, this research will address the modeling of end user empowerment to support distributed Big Data analysis in VREs to support insight and emerging knowledge generation, based on a functional system description for end users, domain experts, as well as for software architects.
Keywords: IVIS4BigData, Advanced Visual User Interfaces, Distributed Big Data Analysis, Information Visualization, End User Empowerment.
1
Introduction and Motivation
The availability of data has changed dramatically over the past ten years. The wide distribution of web-enabled mobile devices and the evolution of web 2.0 technologies are contributing to a large amount of data (so-called Big Data) [15]. Due to the fact that, “we live in the Information Age” [29], cognitive efficient perception and interpretation of knowledge and information to uncover hidden patterns, unknown correlations, and other useful information within the huge amount of data (of a variety of types) [24] is a big challenge. “The process of optimally controlling flows of large-volume, high-velocity, heterogeneous and uncertain data” [20], for creating value from data (emergent knowledge) [20], will become one of the key factors in competition, underpinning new waves of productivity growth, innovation, and consumer surplus [22]. “The revolutionary potential” of the benefits of Big Data technologies [27] and the use of scientific
methods in business / operational data analysis and problem solving for, e.g., managing scientific or industrial enterprise operations in order to support staying innovative and competitive and being able to provide advanced customer-centric service delivery, has also been recognized by Industry [21]. 1.1
Problem Statement
Distributed Systems, like, e.g., Hadoop [1], have already found their way into mainstream application and have seen wide-spread deployment in scientific communities as well as organizations across different industry fields. Nevertheless, there is a gap between having access to these tools that can leverage clusters of commodity computers for chugging through massive amounts of data and doing something useful with it, not only a so-called Data Scientist might care about [25]. An organization’s technical ability for Big Data analysis does not automatically result in corresponding availability of human resources for utilizing this infrastructure. Without strong technical background of specialists, who are capable of both to extract meaningful value from collected data and to manage the whole life cycle of Data, including supporting Scientific Data e-Infrastructures [17] [11] [21], designing, establishing, operating and customizing of new Big Data infrastructures will be difficult to achieve. The European Commission also recognized that an effective use of Data Science technologies requires new skills and demands for new professions, usually referred as the Data Scientist [17]. For this reason they started to fund the EDISON1 project [11] in 2015 which is pursuing the establishment of the Data Scientist as a new profession in support of the e-Infrastructure needs and beyond. However, educating and training such Data Scientists at a reasonable cost and with sufficient effectiveness also requires availability of easy to configure and manage Virtual Research Environments (VREs) [10] that can be utilized in educational environments in a cognitively efficient way and that support End User Empowerment [13] in order to reduce learning and training times for using such infrastructures. 1.2
Objectives and Challenges
The overall goal of this research is to develop a reference model that can support advanced visual user interfaces for distributed Big Data analysis in virtual labs to be used in e-Science, industrial research, and data science education. By enabling the dynamic ad-hoc definition of new interdisciplinary research projects within advanced visual user interfaces supporting cognitive efficiency as well as user empowerment, the surrounding infrastructure will support the life cycle of VREs. In this way, this research will create a visual user interface tool suite supporting a VRE platform infrastructure that can host Big Data analysis and corresponding research activities sharing distributed research resources (i.e., data, tools, and services) by adopting common existing open standards for access, analysis and visualization, realizing an ubiquitous collaborative workspace for researchers which is able to facilitate the research process and its Big Data analysis applications. 1
Education for Data Intensive Science to Open New Science Frontiers
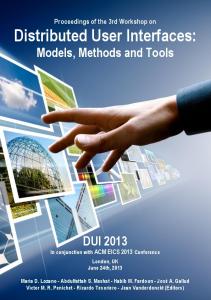
1.3 Research Questions For addressing and archiving the aforementioned goals, research questions were developed. In the following, gaps in current research are highlighted and for each gap an addressing research question is defined. By working on those research questions, the gaps in research in the highlighted fields will be addressed in this research. Research Question A: As a response to increased graphics performance in computing technologies and information visualization, Card et al. [9] developed the Information Visualization (IVIS) Reference Model. Due to further developments in information as well as knowledge management systems in recent years, this model, which is illustrated in Figure 1, has to be adapted for covering the recent advancements.
Fig. 1. IVIS Reference Model [9]
Modern cloud technologies and distributed computing are leading to almost unlimited storage and computing performance. Moreover, usable access to complex and large amounts of data over several data sources require new techniques for accessing and visualizing data with innovative and successful strategies, at the border between automated data analysis and enterprise decision making [14]. Not in alignment in these new required techniques, the original IVIS Reference Model transforms data from a single data source on the left directly to a visual representation for the end user on the right, without a direct view and interaction possibility in the single process stages. Due to the aforementioned aspects, the original model by Card et al. does not cover the new conditions of the present situation. In order to close this gap in research with regard to the IVIS model, the following research question is used. ⇒ How can an adaptation of the IVIS reference model look like, to cover the new conditions of the present situation with advanced visual interface opportunities for perceiving, managing, and interpreting distributed Big Data Analysis results to support insight in virtual labs to be used in e-Science, industrial research, and Data Science education? Research Question B: For archiving an usable and sustainable implementation of the reference model in practice, a Service-Oriented Architecture should be designed. However, this SOA must ensure easy operability as well as a certain flexibility for special accommodations by their customers. In addition, due to limited financial scope of medium-sized enterprises, the operating costs of this SOA must be considered as well. Therefore, the SOA should be implemented with open source solutions. For an implementation of the adapted IVIS reference model generated by answering Research Question A, the following research question is used.
⇒ How can a bookable and flexible visual user interface SOA look like, for demonstrations and hands-on exercises for the identified eScience user stereotypes with special attention to the overall user experience to meet the users (students, graduates, as well as scholars, and practitioners) expectation and way-ofworking [11]? Research Question C: “Users are increasingly willing and, indeed, determined to shape a software they use to tailor it to their own needs” [2]. To turn computers into convivial tools, to underpin the evolution of end users from passive information consumers into information producers, requires that people can use, change and enhance their tools and build new ones without having to become professional-level programmers [2, 12]. ⇒ How can a conceptual framework for the visual user interface, developed by answering Research Question B, look like, in which the users of the system become co-designers to give domain workers more independence from computer specialists? Research Question D: Big Data Analysis is based on different perspectives and intentions. Deduced from this perspectives and intentions, there are different use cases and related user stereotypes that can be identified for performing Big Data analysis collaboratively within an organization, which are important to tailor the reference model as well as the visual user interface to their demands. In order to evaluate the reference model and the corresponding visual user interface generated by answering Research Questions A, B and C with real use cases scenarios and user stereotypes, the following research question is used. ⇒ Which use cases scenarios and user stereotypes for applying Big Data analysis in Business Intelligence scenarios in industry can be identified? Research Question E: Only an organizations’ technical ability for Big Data analysis does not automatically result in human resources therefore. Within this research, based on the results of the research questions above, the competences of the new profession Data Scientist in designing, establishing, operating and customizing Big Data analysis infrastructures as well as extracting meaningful value from the Big Data analysis results, supposed to be derived and integrated into the EDISON Project. ⇒ Which competences with focus on supporting management functions, as key consumers of Big Data analysis in Business Intelligence scenarios, are required to apply the theoretical model and its implementation developed in Research Questions A, B, and C successful in practice?
2
Conceptual Model
As illustrated in figure 2, Big Data Analysis supporting emerging knowledge generation and innovation-oriented decision making [3] is based on different perspectives and intentions. “To support management functions in their ability of making sustainable decisions, Big Data analysis specialists are filling the gap between Big Data analysis result consumers and Big Data technologies” [3]. Thus, “these specialists need to understand their consumers/customers intentions as well as a strong technology watch, but are not equal to developers, because they care about having impact on the business” [26].
Fig. 2. Big Data Perspectives in Industry [3]
2.1 Data Science Competences Based on various perspectives and intentions and with focus on supporting management functions as key consumers of Big Data analysis in Business Intelligence scenarios, there are different Data Science competences. Nevertheless, in Business Intelligence scenarios in industry there is not an exclusive need for Data Scientists according to the Data Science Competences to Understand Big Data Analysis from a Management Perspective [3] at the EGI Community Forum 2015 workshop Demand Of Data Science Skills & Competences (Expert Roundtable) [19]. As outlined in figure 3, in addition to the two competence fields technical understanding (Technical Competences) and professional understanding of their customers contextual levels and perspectives (Management Functions), Social Skills is an important third competence field required in industry.
Fig. 3. Data Analyst Competences to support Management Functions in Industry [3]
In this illustration, the disposal of these three fields of Data Scientist competences clarifies the importance of the Social Skills. Whereas the Technical Competences as well as the Management Functions, derived from Lothar Gulicks POSDCoRB 2 [16] management function model, are located at the outsides, the Social Skills are the central element in this illustration, because social skills like creativity, flexibility, or eloquence are essential to combine the technical understanding and the understanding of their customers contextual levels and intentions. 2
Planning, Organizing, Staffing, Directing, Coordinating, Reporting, and Budgeting
2.2
IVIS4BigData Reference Model
As a response to increased graphics performance in computing technologies and information visualization, Card et al. [9] developed the IVIS Reference Model. Due to further developments in Information Systems as well Data Analysis and Knowledge Management Systems in recent years, this reference model has to be adapted for covering the recent advancements. Therefore, Bornschlegl et al. proposed the Road Mapping of Infrastructures for Advanced Visual Interfaces Supporting Big Data workshop [7, 8, 5]. Industrial researchers and practitioners working in the area of Big Data, Visual Analytics, and Information Visualization were invited to discuss and validate future visions of Advanced Visual Interface infrastructures supporting Big Data applications in Virtual Research Environments. Within that context, the IVIS4BigData Reference Model, that is illustrated in figure 4, was presented [5] and qualitatively evaluated [4] within the road mapping activity [6].
Fig. 4. IVIS4BigData Reference Model [5]
In IVIS4BigData, the IVIS pipeline is segmented in a series of data transformations. Furthermore, due to the direct manipulative interaction between different user stereotypes within the single process stages and their adjustments and configurations of the respective transformations by means of user-operated controls, each segment in the IVIS4BigData pipeline needs to support an interactive user empowerment workflow allowing to configure the transformations and visualizations in the different phases. 2.3
Process Structure
For enabling end-users “to articulate incrementally the task at hand” [13], “the information provided in response to their problem-solving activities based on partial specifications and constructions must assist users to refine the definition of their problem” [13]. To realize this interaction, represented with functional arrows at each process stage between the cross-functional Knowledge-Based Support layer and the corresponding layers above, Fischer’s and Nakakoji’s [13] multifaceted architecture, illustrated in figure 5, is utilized to derive a functional use case framework for the resulting user empowered configuration workflow use cases of the different IVIS4BigData process stages.
Fig. 5. Elements of a Multifaceted Architecture [13]
In this architecture model, five central elements (specification, construction, argumentation base, catalog base, and semantics base) can be identified, “that assist end users to refine the definition of their problem in their problem-solving activities based on partial specifications and constructions” [13]. Derived from an end users configuration perspective, a domain independent problem solving, i.e., user interface configuration process can be divided in three layers. The Design Creation layer contains the construction and specification components, that represent the interactive part of this process utilizing the three static components argumentation base, catalog base, and semantics base within the lowest Domain Knowledge layer. Moreover, the Feedback layer in the middle of this architecture represents the interactive user actions (critics, casebased reasoning, and simulation), that are initiated during the specification or construction process. In addition to this architectural illustration and to emphasize the importance of the construction and specification elements, Fischer and Nakakoji defined a process based illustration of the whole design process, that is outlined in figure 6.
Fig. 6. Construction and Specification of Design in Multifaceted Architecture [13]
In this process, “starting with a vague design goal, designers go back and forth between the components in the environment” [13]. Thus, “a designer and the system cooperatively evolve a specification and a construction incrementally by utilizing the available information in an argumentation component and a catalog and feedback from a simulation component” [13]. As a result, a matching pair of specification and construction is the outcome.
2.4 Use Case Framework Based on the described principles, a generic use case framework is defined that covers all activities within a IVIS4BigData process stage. Outlined in figure 7, this framework will be the context for the corresponding IVIS4BigData use cases.
Fig. 7. IVIS4BigData Use Case Framework
From a vertical perspective, the use case framework consists of three layers according to Fischer and Nakakoji [13]. Although it contains all elements of their multifaceted architecture, the layers differ from the constitutive model. Whereas the middle Domain Knowledge layer accord to the original model, Fischer and Nakakoji defined a separate layer especially for feedback. Not in alignment to the original model, this framework utilizes the Application layer, that represents Fischer’s and Nakakoji’s Design Creation layer, also for feedback and adaptation. Moreover, to cover the new situation of distributed processing, an additional Persistency layer is defined underneath both layers. In more detail, the Application Layer, where all design specification and construction functions of the IVIS4BigData process stage workflow are located as well as the the functions to run predefined workflows, is separated in three areas. Whereas the Semantic Representation and Knowledge Management area of this layer contains all activities to configure the data, analysis, or visualization workflow models depending on the IVIS4BigData process stage, the central Integration and Analysis area includes all functions to execute the resulting interactive workflow of each stage. This central area also includes the central transformation of each IVIS4BigData process stage (Data Integration, Data Transformation, Visual Mapping, or View Transformation) within the use cases. Finally, the Visualization, Adaptation, and Simulation area includes all activities to support the construction and specification process. In combination with the End User Stereotype and the Domain Expert, where both of them interacting with the activities within these three areas, the Workflow layer represents the central element of this framework. In this way, this central layer combines all Design Creation and Feedback activities of Fischer’s and Nakakoji’s Multifaceted Architecture in a more detailed and effective way. The Domain Knowledge layer in the middle of this framework contains all data, analysis, or visualization catalogs and other types of domain knowledge that can be utilized within the IVIS4BigData process stages. In this way, this
layer, based on its elements, will support the activities of the central Appl. layer with regard to the respective IVIS4BigData transformation of each process stage. Finally, the Persistency layer contains the data sources as well as the phases of the IVIS4BigData pipeline and is responsible for the data persistence during the interactive transformation between two consecutive IVIS4BigData phases. As a result of the ability to utilize distributed architectures and cloud services for data storage as well as for data processing, this layer emphasizes the importance to manage and control the data during and after an IVIS4BigData process stage.
3
Proof-of-Concept Implementation
To support researchers and organizations maintaining research resources, a proofof-concept reference implementation of our IVIS4BigData model will be implemented, by developing an interoperable, cognitive efficient and user empowering VRE infrastructure. As illustrated in Figure 8, the infrastructure is based on providing and managing access though open standards and is materialized though existing open components procured from successful research projects dealing with resources at scale, and supported by their owners as project partners.
Fig. 8. Conceptual Architecture for a VRE Infrastructure
It is building on the concept of semantic integration and mediation and corresponding mediator architectures to support information integration across borders of scientific knowledge domains. In this way digital research resources from different scientific disciplines can be mediated by means of semantic integration of domain models on the level of the mediator and by means of domain adaptation on the level of the corresponding wrappers. This means, information integration concept is independent of media types and persistency platforms.
Moreover, the infrastructure builds on the concepts and service model of Infrastructure as a Service (IaaS) Clouds exploiting its scalability, elasticity, and accounting capabilities as defined by NIST [23]. Finally, it will establish a scientific collaboration model within its VREs that is building on Computer Supported Collaborative Work (CSCW) concepts of configuring, using, and dissolving such VREs in a very controlled way that is at the same time very intuitive, i.e. user-centered and focusing on cognitive efficiencies and attractive user experiences. Thus, it lowers barriers of adoption by harmonizing these offerings with a cloud infrastructure for service delivery and provides services for the secure collaborative management of interdisciplinary research projects in VREs with a comprehensive set of standard-based services, interfaces, and tools that support their complete life cycle in a domain agnostic fashion.
4
Evaluation
After deriving the IVIS4BigData reference model which covers the new conditions of the present situation with identifying advanced visual user interface opportunities for perceiving, managing, and interpreting distributed Big Data analysis results, the necessity to evaluate the reference model still existed. In this context, a full day workshop on Road Mapping Infrastructures for Advanced Visual Interfaces Supporting Big Data Applications in Virtual Research Environments [7] at the Advanced Visual Interfaces (AVI) conference 2016 [8], was utilized to present, discuss, and evaluate the derived IVIS4BigData Reference Model. Instead of a public meeting, this workshop was organized as a focus event (expert roundtable) for invited researchers (domain experts) of accepted research papers after a public call for participation where all submissions were reviewed by an international expert programme committee. Therefore, the results of that qualitative user study [4] gathered by using the round table methodology are very significant for evaluating the demand of the IVIS4BigData Reference Model, potential use case scenarios, user stereotypes, and their required competencies for applying the presented model with focus on supporting management functions, as key consumers of Big Data analysis in Business Intelligence scenarios. In addition to the qualitative evaluation user study, the resulting IVIS4BigData proof of concept implementation has to be evaluated from a end user as well as from an applicability perspective. Thus, as utilized in [18] and [28], a usability study, where different types of end users first interacting with the resulting proof of concept implementation and then where interviewed about their experiences is planned as well as an application coverage study, where the applicability of different real world scenarios is evaluated.
5
Discussion and Outlook
After presenting [5] and qualitatively evaluating [4] the IVIS4BigData Reference Model in a road mapping activity [6], where all of the experts agreed that “this model can represent a framework for their research as well as a generic framework for distributed Big Data analysis applications to support Business Intelligence” [4], the current topic of this PhD research is the definition of a generic process structure framework and use case scenarios to close the existing gap between the architectural and the functional mapping of IVIS4BigData. Thus, this
research will currently address these issues with a special focus on modeling end user empowerment to support distributed Big Data analysis in VREs based on IVIS4BigData to support insight and emerging knowledge generation. However, what is still missing and can be considered as a remaining challenge for this research for achieving an usable and sustainable implementation of IVIS4BigData and its functional system description, is the implementation of a conceptual Service-Oriented Architecture (SOA) that must ensure easy operability as well as a certain flexibility for special accommodations by their customers. Moreover, after designing the architecture and to evaluate the generic process structure framework and use case scenarios, the integration of certain presented Advanced Big Data Applications of the road mapping activity in 2016 [6] as bookable service modules within this framework is intended.
6
Acknowledgments and Disclaimer
This research has been produced in context of the EDISON project [11], which has received funding from the EU Horizon 2020 research and innovation programme under grant agreement No 675419. However, this paper reflects only the author’s view and the European Commission is not responsible for any use that may be made of the information it contains.
References 1. Apache Software Foundation: Apache hadoop (version: 2.6.3) (2014), https:// hadoop.apache.org, accessed: 2016-01-10 2. Ardito, C., Buono, P., Costabile, M.F., Lanzilotti, R., Piccinno, A.: End users as co-designers of their own tools and products. Journal of Visual Languages & Computing 23(2), 78 – 90 (2012), special issue dedicated to Prof. Piero Mussio 3. Bornschlegl, M.X.: Data science competences to understand big data analysis from a management perspective - a top down view -. In: Hemmje et al. [19] 4. Bornschlegl, M.X.: IVIS4BigData: Qualitative evaluation of an information visualization reference model supporting big data analysis in virtual research environments. In: Advanced Visual Interfaces. Supporting Big Data Applications, LNCS, vol. 10084, pp. 127–142. Springer International Publishing (2016) 5. Bornschlegl, M.X., Berwind, K., Kaufmann, M., Engel, F.C., Walsh, P., Hemmje, M.L., Riestra, R., Werkmann, B.: IVIS4BigData: A reference model for advanced visual interfaces supporting big data analysis in virtual research environments. In: Advanced Visual Interfaces. Supporting Big Data Applications, Lecture Notes in Computer Science, vol. 10084, pp. 1–18. Springer International Publishing (2016) 6. Bornschlegl, M.X., Engel, F.C., Bond, R., Hemmje, M.L.: Advanced Visual Interfaces. Supporting Big Data Applications, LNCS, vol. 10084. Springer International Publishing, 1 edn. (2016) 7. Bornschlegl, M.X., Manieri, A., Walsh, P., Catarci, T., Hemmje, M.L.: Road mapping infrastructures for advanced visual interfaces supporting big data applications in virtual research environments. In: Proceedings of the International Conference on Advanced Visual Interfaces, AVI 2016, Bari, Italy, June 7-10. pp. 363–367 8. Buono, P., Lanzilotti, R., Matera, M., Costabile, M.F. (eds.): Proceedings of the International Working Conference on Advanced Visual Interfaces, AVI 2016, Bari, Italy, June 7-10, 2016. ACM (2016), http://doi.acm.org/10.1145/2909132 9. Card, S.K., Mackinlay, J.D., Shneiderman, B. (eds.): Readings in Information Visualization: Using Vision to Think. Morgan Kaufmann Publishers Inc. (1999)
10. Carusi, A., Reimer, T.: Virtual research environment collaborative landscape study. JISC, Bristol p. 106 (2010) 11. European Commission: Education for data intensive science to open new science frontiers. H2020-INFRASUPP-2015-1, Proposal number: 675419, Proposal acronym: EDISON (2015) 12. Fischer, G.: In defense of demassification: Empowering individuals. HumanComputer Interaction 9(1), 66–70 (1994) 13. Fischer, G., Nakakoji, K.: Beyond the macho approach of artificial intelligence: empower human designers - do not replace them. Knowledge-Based Systems 5(1), 15 – 30 (1992) 14. Fraunhofer IGD: Visual business analytics (2015), http://www.igd.fraunhofer.de/ en/Institut/Abteilungen/Informationsvisualisierung-und-Visual-Analytics/ Visual-Business-Analytics, accessed: 2015-12-02 15. Freiknecht, J.: Big Data in der Praxis. Carl Hanser Verlag GmbH & Co. KG, M¨ unchen, Deutschland (2014) 16. Gulick, L.: Notes on the theory of organization. Classics of organization theory 3, 87–95 (1937) 17. Harris, H., Murphy, S., Vaisman, M.: Analyzing the Analyzers: An Introspective Survey of Data Scientists and Their Work. O’Reilly Media, Inc. (2013) 18. Heer, J., Card, S.K., Landay, J.A.: Prefuse: a toolkit for interactive information visualization. In: Proceedings of the SIGCHI conference on Human factors in computing systems. pp. 421–430. ACM (2005) 19. Hemmje, M.L., Brocks, H., Becker, J. (eds.): Demand Of Data Science Skills & Competences (Expert Roundtable) (Nov 2015) 20. Kaufmann, M.: Towards a reference model for big data management (2016), https: //ub-deposit.fernuni-hagen.de/receive/mir mods 00000583 21. Manieri, A., Demchenko, Y., Wiktorski, T., Brewer, S., Hemmje, M., Ferrari, T., Riestra, R., Frey, J.: Data science professional uncovered - how the edison project will contribute to a widely accepted profile for data scientists (2015) 22. Manyika, J., Chui, M., Brown, B., Bughin, J., Dobbs, R., Roxburgh, C., Hung Byers, A.: Big data: The next frontier for innovation, competition, and productivity. McKinsey Global Institute (May 2011) 23. NIST: The nist definition of cloud computing. Recommendations of the National Institute of Standards and Technology (2011), http://csrc.nist.gov/publications/ nistpubs/800-145/SP800-145.pdf, accessed: 2016-01-05 24. Prajapati, V.: Big Data Analytics with R and Hadoop. Packt Publishing (2013) 25. Ryza, S., Laserson, U., Owen, S., Wills, J.: Advanced Analytics with Spark, vol. 1. O’Reilly Media, Inc., Sebastopol, CA, USA (3 2015) 26. Upadhyay, S., Grant, R.: 5 data scientists who became ceos and are leading thriving companies, http://venturebeat.com/2013/12/03/5-data-scientists-whobecame-ceos-and-are-leading-thriving-companies/, accessed: 2015-10-30 27. Wang, W.: Big data, big challenges. In: Semantic Computing (ICSC), 2014 IEEE International Conference on Semantic Computing. pp. 6–6 (June 2014) 28. Wongsuphasawat, K., Moritz, D., Anand, A., Mackinlay, J., Howe, B., Heer, J.: Voyager: Exploratory analysis via faceted browsing of visualization recommendations. IEEE transactions on visualization and comp. graphics (1), 649–658 (2016) 29. Wood, J., Andersson, T., Bachem, A., Best, C., Genova, F., Lopez, D.R., Los, W., Marinucci, M., Romary, L., Van de Sompel, H., Vigen, J., Wittenburg, P., Giaretta, D., Hudson, R.L.: Riding the wave: How europe can gain from the rising tide of scientific data. final report of the high level expert group on scientific data; a submission to the european commission (2011)