Jun 1, 2007 - root (Panax ginseng). Apart from the Asian subspecies, other subspecies of the ginseng plant are available such as the. American subspecies ( ...
Agilent MassHunter – Fast, computer-aided analysis of LC/ESI-TOF data from complex natural product extracts Part 2: Comparison of Agilent 6210 TOF data from different biological origin with the Mass Profiler in MassHunter software
Application Note
Edgar Naegele
Abstract
Agilent Equipment: 1200 Series Rapid Resolution LC system 6210 Time-of-Flight MS MassHunter Workstation software Application Area: Analysis of complex natural products in drug discovery
This Application Note describes: • Fast computer-aided identification of differences in complex natural product extracts • Accurate mass measurement with LC/ESI-TOF for the determination of complex natural compound structures • The use of the Agilent 1200 Series Rapid Resolution LC (RRLC) system with Rapid Resolution High Throughput (RRHT) columns for separation of ingredients in a complex ginseng root extract, and the use of the Agilent 6210 ESI-TOF mass spectrometer for accurate molecular mass measurement • Processing of TOF data with the Mass Profiler of the Agilent MassHunter Workstation software to identify statistically significant differences in a set of samples from two different ginseng subspecies • Identification of the different compounds by empirical formula calculations based on highly accurate mass measurement
Introduction Herbal extracts have been used since prehistoric times for the treatment of disease. The effects of these extracts on humans were determined by simple trial and error over generations. A good example for the efficiency achieved is Traditional Chinese Medicine (TCM). In Western medicine, drugs of natural origin are gaining importance due to their therapeutic potential. However, Western pharmaceutical quality standards require a deeper know-ledge of the ingredients in medicines based on natural products. A famous Asian herb, which has been used in herbal medicine for more than 5000 years, is the Asian ginseng root (Panax ginseng). Apart from the Asian subspecies, other subspecies of the ginseng plant are available such as the American subspecies (Panax quinquefolius). The pharmaceutically active compounds of each subspecies have different patterns of occurrence and concentration1. Therefore, it is important to know the composition of the plant extract, depending on its biological origin, to anticipate its medical activity before use. The main active compounds of ginsenosides are triterpene saponins, of which more than 80 have been isolated and characterized during the past years.
2
Much work has been done during the last 30 years to develop analytical methods for the analysis of ginseng extracts and medical formulations. The method of choice for the analysis of complex natural product extracts such as the ginseng root is highperformance liquid chromatography (HPLC)2. For determination of the complex and similar structures of ginsenosides, modern LC/MS equipment is currently used such as LC/ESI-TOF for accurate mass measurement and LC/ion trap or LC/triple quadrupole systems for structural elucidation by MS/MS and MSn3. However, the time-consuming bottleneck remains the examination of the acquired MS data. This Application Note describes the analysis of TOF data with the Mass Profiler of the Agilent MassHunter Workstation software for fast and easy identification of differences in the extracts from different ginseng subspecies. This note also describes the use of the Agilent 1200 Series Rapid Resolution LC (RRLC) system with Rapid Resolution High Throughput (RRHT) columns for the separation of the ingredients in complex ginseng root extracts together with the Agilent 6210 ESI-TOF mass spectrometer for accurate measurement of their molecular masses.
Processing of the TOF data with the Molecular Feature Extractor (MFE) of the Agilent MassHunter Workstation software to generate molecular features for the identification of natural product compounds is described in part 1 of this study4. An example for an automated approach to analyze complex natural product extracts is described in part 3 of this study5.
Experimental Equipment • Agilent 1200 Series binary pump SL with degasser. This pump is capable of performing high resolution HPLC analysis on 1.8 μm particle size columns for best resolution performance. • Agilent 1200 Series high performance autosampler SL with thermostat. This autosampler is designed specifically to be used with the binary pump SL. • Agilent 1200 Series thermostatted column compartment. This column compartment is supplied ready for use with the binary pump SL. Also available are heat exchangers for postcolumn cooling under optimized delay volume conditions, as well as a 2-position/10-port valve for alternating column regeneration. • Agilent 1200 Series diode array detector SL. This detector is capable of acquiring data at a sampling rate up to 80 Hz. • Agilent 6210 Time-of-Flight mass spectrometer. This orthogonal acceleration TOF MS has a dual sprayer interface for mass calibration and acquisition of molecular masses with highest accuracy, and is capable of acquiring data at 40 Hz and with positive/negative switching • Column: ZORBAX SB C18, 2.1 x 150 mm, 1.8 μm particles. • Software: TOF instrument control software Agilent MassHunter Workstation revision A.02.00 for data acquisition, Agilent Analyst Software for data review, and Agilent Mass Profiler software for data processing.
In this LC/TOF system setup, the binary pump SL is configured for low-delay volumes and connected to the high performance autosampler SL with a 0.17 mm ID stainless steel capillary. To reduce delay volume, the seat capillary in the high performance autosampler SL has an ID of 0.12 mm. The same type of capillary is used to connect the low delay volume (1.6 μL) heat exchanger, which is connected to the column, in the thermostatted column compartment. For UV detection, a 2 μL cell is built into the diode array detector SL. The outgoing capillary is connected directly to the sprayer in the electrospray source of the mass spectrometer. This instrument setup is optimized to achieve the highest possible resolution. Sample preparation Powdered freeze-dried Asian and American ginseng root (1 g each) was treated ultrasonically for 30 minutes in 10 mL methanol, filtered and directly used for analysis. Method • The Agilent 1200 Series binary pump SL was operated under the following conditions: Solvent A: Water + 0.1 % TFA Solvent B: ACN + 0.1 % TFA Flow: 0.5 mL/min Gradient: 0 min, 5 %B 1 min, 5 %B 60 min, 85 %B 61 min, 95 %B 70 min, 95 %B Stop time: 70 min Post time: 15 min
• The Agilent 1200 Series high performance autosampler SL was used to make sample injections of 10 μL sample and the samples were cooled to 10 °C. The sample loop was switched to bypass after one minute to reduce delay volume. • The Agilent 1200 Series thermostated column compartment was adjusted to 50 °C and equipped with the low delay volume heat exchanger. • The Agilent 1200 Series DAD SL was operated at 80 Hz for data acquisition at a wavelength of 220 nm/4 nm, reference 360 nm/100 nm with the 2 μL flow cell, 3 mm path length flow cell. • The Agilent 6210 TOF MS was operated under the following conditions: Source: ESI in positive mode with dual spray for reference mass Dry gas: 12 L/min Dry temp.: 200 °C Nebulizer: 35 psi Scan: 200-1300. Fragmentor: 150 V Skimmer: 60 V Capillary: 3000 V
3
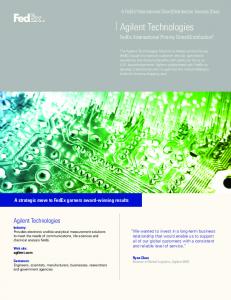
Results and discussion The ingredients of the Asian and American ginseng root extracts were separated with the Agilent 1200 Series RRLC system using an RRHT column (1.8 μm particle size) with subsequent ESI-TOF mass spectrometry (Agilent 6210 TOF). The high resolution LC facilitated excellent separation of the major and minor ingredients of the natural product extracts (figure 1). For the data analysis with Mass Profiler, five repeated injections of each extract sample were measured by the same LC/MS TOF method as described in the experimental section. The acquired TOF data were extracted by the Molecular Feature Extractor software as described4. In this process, the identified ions were clustered to molecular features comprising isotope compounds and adducts. The files obtained were grouped according to the biological origin of the measured extract samples into two respective groups for Asian and American ginseng and loaded into the Mass Profiler software. All 671 identified molecular features were displayed in a plot of mass against the retention time plot in the Mass Profiler software to inspect the quality of the data (figure 2). The molecular features for the known ginsenoside Rb1 (C54H92O23 at M = 1108.6029 and RT = 11.90) were enlarged.
4
Intensity [cps] 3.5e6 Re
Rb 1
(A) TIC of TOF-MS from Asian ginseng
Rb 2 Rc
Rd
3.0e6 Rg 1
2.5e6
Rf
2.0e6 1.5e6 1.0e6 5.0e5 0.0 8.0
9.0
10.0 11.0
Intensity [cps] 4.0e6 4.0e6 3.5e6 3.5e6
12.0
13.0 14.0
15.0 16.0 17.0
18.0
19.0 20.0
21.0
(B) TIC of TOF-MS from American ginseng
F11 11
(B) TIC of TOF -
Rb11
Re
Rd Rb22
3.0e6 3.0e6 2.5e6 2.5e6 Rg1 1 2.0e6 2.0e6 Rc 1.5e6 1.5e6 1.0e6 1.0e6 5.0e5 5.0e5 0.0
8.0
9.0
10.0
11.0
12.0
13.0
14.0
15.0
16.0
17.0
18.0
19.0
20.0
21.0
Time [min]
Figure 1 TIC of TOF-MS from an Asian (A) and an American (B) ginseng root extract between 8 and 21 minutes showing the main ginseosides.
The standard deviations for mass and retention time, the relative standard deviation of the abundance in each group as well as
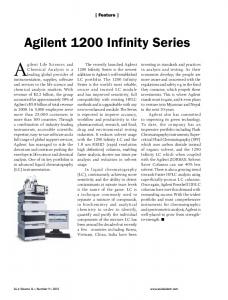
For the differential analysis of both groups, the features of each group are displayed in a logarithmic (log2) plot showing the abun-
the high relative mass accuracy of 1.38 ppm for this particular compound demonstrate the high quality of the data.
Mass [MU]
Mass vs. Retention Time 1200 HO
Mass accuracy = 1.38 ppm
1000
O
O
O
OH
O
OH
HO OH
HO
OH
HO
800 Mass
OH
CH 3
CH 3 CH3
CH3
600
O
CH3
O
OH
Retention time SD = 0.006 Mass SD = 0.0004 Abundance RSD = 0.23
CH3
H3C CH3
HO HO
O
O
OH HO OH
400 200 0
0
5
10
15 Retention Time (min)
20
25
30
Retention time [min]
Figure 2 Plot of mass against retention time shows all 671 molecular features found in the Asian (red) and American (blue) ginseng extracts and molecular features of ginsenoside Rb1 (C54H92O23 at M = 1108.6029 and RT = 11.90)
Log2 Abundance of American ginseng Log2 Abundance - American ginseng
American ginseng vs. Asian ginseng 26
Pseudoginsenoside F11
24
OH H3C
22
CH3
O OH H3C
20
CH3
CH3
CH3 HO
18
H3C CH3 HO
O O
OH HO
16
HO
O
HO
CH3
14
OH OH
O
O
O
OH
+4X
CH3
1X
HO
-2X
10
O OH
CH 3
OH
CH 3 CH3
+2X
12
Ginseoside Rc
O OH
OH HO
O OH
CH3 CH3
O H3C CH3
HO
-4X
HO
O
O
OH HO
8
OH
10
12
14
16
18
Log2 Abundance - Asian ginseng
20
22
24
Log2 Abundance of Asian ginseng
Figure 3 Differential analysis of Asian and American ginseng, showing pseudoginseoside F11 exclusively in American ginseng and higher concentration of ginsenoside Rc in Asian ginseng.
5
dance ratio of Asian and American ginseng extracts ( figure 3). In the plot there are five lines for selected levels of abundance difference in the two sample groups. Molecular features lying on the line in the middle (1x) are equal in both
ID 1 2 3 4 5 6 7 8 9 10
Name American Ginseng_1 American Ginseng_2 American Ginseng_3 American Ginseng_4 American Ginseng_5 Asian Ginseng_1 Asian Ginseng_2 Asian Ginseng_3 Asian Ginseng_4 Asian Ginseng_5
RT 12.550 12.505 12.557 12.491 12.493 12.538 12.534 12.545 12.545 12.534
groups, molecular features within the 2x margins are up to twice the abundance in one group and within the 4x margins up to fourfold. Beyond these margins a feature is nearly unique or exclusively present in one group. An
Mass Abundance Mass error [mDa] 1078.5909 143,961 -1.50 1078.5912 243,837 -1.20 1078.5921 240,121 -0.30 1078.5919 266,422 -0.50 1078.5904 252,872 -2.00 1078.5905 2,092,954 -1.90 1078.5912 2,023,553 -1.20 1078.5898 2,058,617 -2.60 1078.5906 2,052,396 -1.80 1078.5905 2,042,638 -1.90
example for a compound which has a higher concentration in the Asian ginseng sample group is the ginsenoside Rc (figures 1 and 3). The comparison of the abundances in each sample of the two groups clearly shows a significant eight-fold higher occurrence
Rel. mass error [ppm] 1.36 1.09 0.25 0.44 1.83 1.73 1.09 2.38 1.64 1.73
Av. rel. mass error [ppm]
0.99
1.71
Table 1 Retention times, abundancies and mass accuracies of ginsenoside Rc (C53H90O22 at M = 1078.5924) in Asian and American ginseng.
ID 1 2 3 4 5 6 7 8 9 10
Name American Ginseng_1 American Ginseng_2 American Ginseng_3 American Ginseng_4 American Ginseng_5 Asian Ginseng_1 Asian Ginseng_2 Asian Ginseng_3 Asian Ginseng_4 Asian Ginseng_5
RT Mass Abundance Mass error [mDa] 11.328 800.4900 2,835,414 -2.20 11.347 800.4910 2,836,847 -1.20 11.337 800.4924 2,815,218 0.20 11.333 800.4909 2,797,743 -1.30 11.335 800.4900 2,864,285 -2.20 11.337 800.4914 23,132 -0.80 11.337 800.4930 22,875 0.80 11.344 800.4927 20,865 0.50 11.346 800.4942 23,578 2.00 11.342 800.4912 22,556 -1.00
Rel. mass error [ppm] 2.70 1.50 -0.24 1.60 1.60 1.00 -1.00 -0.60 -2.48 1.25
Av. rel. mass error [ppm]
1.53
1.26
Table 2 Retention times, abundancies and mass accuracies for Pseudoginsenoside F11 (C42H72O14 at M = 800.4922), present nearly exclusively in American ginseng samples.
6
of ginsenoside Rc in Asian ginseng (table 1). The calculated relative mass errors are in the low single digit ppm range. The average for the Asian ginseng sample group is 1.71 ppm and the average for the American ginseng sample group is 0.90 ppm. The molecular feature, which is easily recognizable as almost exclusively present in the American ginseng samples, is the special the compound pseudoginsenoside F11 (figure 3). This compound has more than 100-fold higher abundance in the samples from the American ginseng root extract (table 2). For this compound, the average relative mass accuracy for the Asian ginseng sample group is 1.71 ppm and the average for the American ginseng sample group is 1.26 ppm.
Conclusion The ingredients of highly complex natural products can be separated with very low standard deviations of retention times using the Agilent 1200 Series RRLC system and 1.8 μm particle size columns. Connection to the Agilent 6210 ESI-TOF MS facilitates acquisition of highly accurate and repeatable mass data. With these system prerequisites, the data can be processed by the Mass Profiler software for statistical evaluation of the differences in the abundance of the molecular features in the different sample groups. This facilitates identification of differences in concentration and abundance of single compounds in very complex samples such as natural product extracts.
References 1. Chuang W.-C., Wu H.-K., Sheu S., Chiou S.-H., Chang H.-C., Chen Y.P., Planta Med. 61, 459 pp, 1995. 2. Fuzzati N., “Analysis methods of ginsenosides.” J. Chrom. B1-2, 812, 114-133, 2004. 3. Wang X., Sakuma T., AsafuAdjaye E., Shiu G. K., “Determination of ginsenosides in plant extracts from Panax ginseng and Panax quinquefolius L. by LC/MS/MS.” Anal. Chem. 71, 1579-1584, 1999. 4. Edgar Naegele: “Agilent MassHunter – Fast computer-aided analysis of LC/ESI-TOF data from complex natural product extracts – Part 1:Analysis of Agilent 6210 TOF data with the Molecular Feature Extractor in MassHunter Workstation software“, Agilent Application Note, Publication number 59895928EN, 2007. 5. Edgar Naegele: “Agilent MassHunter –Fast computer aided analysis of LC/ESI-TOF data from complex natural product extracts – Part 3: Automated analysis of Agilent 6210 TOF data from complex natural product extracts”, Agilent Application Note, Publication number 5989-6077EN, 2007.
7
Edgar Naegele is Application Chemist at Agilent Technologies, Waldbronn, Germany.
www.agilent.com/chem/tof
© 2007 Agilent Technologies, Inc. Published June 1, 2007 Publication Number 5989-6076EN