J Neurophysiol 91: 172–181, 2004. First published September 24, 2003; 10.1152/jn.00613.2003.
Aging and Rhythmical Force Output: Loss of Adaptive Control of Multiple Neural Oscillators Jacob J. Sosnoff,1,2 David E. Vaillancourt,3,4 and Karl M. Newell1 1
Department of Kinesiology, 2The Gerontology Center, The Pennsylvania State University, University Park, Pennsylvania 16802; and Department of Movement Sciences, 4Center for Magnetic Resonance Research, University of Illinois at Chicago, Chicago, Illinois 60608
3
Submitted 27 June 2003; accepted in final form 18 September 2003
Sosnoff, Jacob J., David E. Vaillancourt, and Karl M. Newell. Aging and rhythmical force output: loss of adaptive control of multiple neural oscillators. J Neurophysiol 91: 172–181, 2004. First published September 24, 2003; 10.1152/jn.00613.2003. The current study examined the influence of aging on the oscillatory activity of a population of motor units during rhythmical force production. Previously, it has been shown that aging humans have greater low-frequency and less high-frequency electromyographic (EMG) activity during constant and slow ramp force contractions. We hypothesized that more rapid force contractions would reverse the established finding of reduced high- and greater low-frequency EMG activity to greater high- and reduced low-frequency EMG activity in older adults. Intramuscular EMG activity and effector force were recorded while 45 human subjects (20 –31 and 60 – 88 yr of age) rhythmically produced force at four distinct frequencies (1– 4 Hz) and two force levels (5 and 25% maximal voluntary contraction). Spectral and coherence analyses were performed on the force output and EMG activity. In the 3- and 4-Hz targets, the older adults had greater 35- to 50-Hz and reduced 0- to 5-Hz EMG activity compared with the young adults. There was greater EMG-force coherence in the 0- to 5-Hz bandwidth for the young subjects. No systematic age difference in the phase relationship between the EMG and force signals were found. Higher frequency force contractions reversed the previously established aging differences in the relative contribution of low- and high-frequency EMG activity. Thus the frequency properties of the task goals channel the relative contribution of low and high EMG activity. Furthermore, it is proposed that aging humans lose the adaptive capability to coordinate the excitatory and inhibitory activity of multiple neural oscillators.
Human aging leads to more variable force output. Consistent empirical evidence demonstrates an aging-related increase in force variability during constant, ramp, discrete, and rhythmical force output tasks (Christou and Carlton 2001; Galganski et al. 1993; Laidlaw et al. 2000; Vaillancourt et al. 2003). Numerous experimental studies in young adults and simulated models demonstrate that differences in the mean motor unit discharge rate (Allum et al. 1978; Christakos 1982), discharge rate variability (Enoka et al. 2003; Laidlaw et al. 2000), and synchronization between motor units (Taylor et al. 2002; Yao et al. 2000) are associated with changes in force variability. Each of these mechanisms has been investigated as a possible explanation for the increased force variability found with aging (Enoka et al. 2003; Roos et al. 1997). In such studies, the primary technique that investigators have used measures the
behavior of single motor units and attempts to link the firing pattern of these isolated motor units with the aging-related changes in force variability. While assessing the behavior of single motor units is important, the number of motor units that are typically measured represents a very small fraction of the total number of motor units of the specific muscle. In addition, most of the age-related changes in force variability occur in the low-frequency (⬍4 Hz) bands of force output (Vaillancourt and Newell 2003), and this low-frequency band reflects the collective behavior of a large pool of motor units rather than output from a small set of individual motor units (Allum et al. 1978; Freund 1983). Another mechanism that may also contribute to the agerelated changes in force variability is the structure of the oscillatory input to a pool of motor units. The oscillatory input to a pool of motor units synchronizes the collective activity of the units at the frequency determined by the descending drive, and this frequency need not coincide with the frequency of each individual motor unit (Brown 2000). The discharge pattern of a pool of motor units can be assessed by the multiple oscillations present in the electromyographic (EMG) signal (Brown et al. 1997; McAuley et al. 1997). McAuley and colleagues (1997), manipulating an elastic load in a postural finger tremor task, showed the presence of 10-, 20-, and 40-Hz oscillations in the EMG and acceleration signals and suggested that these rhythms might reflect central neural firing to a pool of motor units. In a study of human aging that investigated both constant and 1-Hz rhythmical isometric abduction force, older adults had greater relative EMG power in the 10-Hz band and reduced relative EMG power in the 40-Hz band compared with young adults (Vaillancourt et al. 2003). That study also showed the relative power in the 10- and 40-Hz bands was exponentially related to measures of force variability. These findings led Vaillancourt and colleagues to postulate that a shift in the relative contribution of high- to low-frequency input to the motor neuron pool contributes to greater force variability with advanced age. However, the findings in support of that hypothesis were assessed during a constant and 1-Hz sinusoidal task and may not generalize to tasks where the contraction rate is faster than 1 Hz. For instance, when young adults produced force at 2-, 3-, and 4-Hz frequencies, there was a shift in the power of high-frequency (e.g., 35–50 Hz) EMG activity to low-frequency bands (0 –5 Hz) (Sosnoff et al. 2002). It remains unclear if older adults always have less high-frequency and
Address for reprint requests and other correspondence: J. J. Sosnoff, Dept. of Kinesiology, The Pennsylvania State University, 266 Recreation Hall, University Park, PA 16802 (E-mail:
[email protected]).
The costs of publication of this article were defrayed in part by the payment of page charges. The article must therefore be hereby marked ‘‘advertisement’’ in accordance with 18 U.S.C. Section 1734 solely to indicate this fact.
INTRODUCTION
172
0022-3077/04 $5.00 Copyright © 2004 The American Physiological Society
www.jn.org
AGING, FORCE VARIABILITY, AND TASK DEMANDS
greater low-frequency EMG activity or if they have a more general deficit in shifting EMG power over frequency bands. To date, there have been few studies that have examined the effects of aging on the collective, oscillatory behavior of a large pool of motor units. The purpose of this study was to examine the effects of aging on oscillatory EMG activity and the frequency of force production. The main hypothesis tested in this study was that the nature of the task channels the relative input dynamics between the low- and high-frequency EMG activity and that older adults have greater high-frequency and reduced lowfrequency EMG activity during fast rhythmical contractions. This hypothesis was examined over different force frequency (1– 4 Hz) and force level (5%, 25% MVC) conditions in three different age groups that spanned from 20 to 88 yr. Force and intramuscular fine wire EMG were recorded, and spectral analysis examined the oscillatory activity from the pool of motor units. Support for the hypothesis that older adults have an impaired ability to shift EMG power would require older adults to have reduced low-frequency and greater high-frequency EMG activity only at the faster force frequency conditions. METHODS
Subjects A total of 45 subjects (24 males and 21 females) were assigned to three different age groups: young group [n ⫽ 15, 20 –31 yr old, mean ⫽ 24.9 ⫾ 3.8 (SD) yr; 9 males and 6 females], old group (n ⫽ 15, 60 –74 yr old, mean ⫽ 67.8 ⫾ 4.1 yr; 8 males and 7 females), and older old group (n ⫽ 15, 75– 88 yr old, mean ⫽ 79.7 ⫾ 4.2 yr; 7 males and 8 females). To be a participant in the study, subjects had to be living independently, free of any neuromuscular disorders, nondiabetic, not on blood-thinning medication, and able to locomote without the use of an assistive device. Forty four of the subjects were righthand dominant, and one subject was left-hand dominant. The subjects signed informed consent forms that had been approved by the University Institutional Review Board.
Apparatus ISOMETRIC FORCE RECORDING. Subjects were seated in a chair facing a 17-in video monitor (CTX International, California) with their dominant hand placed in a prone position in an apparatus designed to isolate abduction force of the index finger. The apparatus was placed on a table 75 cm off of the ground. The movement of the middle finger was restricted, while the thumb was free to move. Orthogonal to the index finger and 36 cm from the subject’s midline was an Eltran EL-500 load cell (diameter: 1.27 cm). The load cell measured compressive force produced by the index finger. The lateral side of the distal portion of the index finger was in constant contact with the load cell producing compressive force. Voltage changes from the load cell were amplified by a Coulbourn (V72–25) resistive bridge strain amplifier with an excitation voltage of 10 V and an amplifier gain of 100. The analog force signal was sampled at 100 Hz by a 16-bit analog-to-digital converter. The smallest increment of change in force that could be detected was 0.0016 N. At each sampling interval, the force produced was presented on the video monitor. The monitor had a viewing area of 1,200 horizontal pixels and 1,000 vertical pixels. The video monitor was ⬃50 cm from the subject’s eyes and 100 cm from the ground. On the monitor, subjects viewed both a red sine wave, which spanned the width of the monitor, and a series of illuminated yellow pixels both on a black background. The red sine wave served as the force target the subjects
J Neurophysiol • VOL
173
were to match, and the yellow pixels depicted the force trajectory produced by the subject. INTRAMUSCULAR RECORDINGS. During each trial, intramuscular EMG activity was recorded from the first dorsal interosseous of the subject’s dominant hand. A disposable paired-hook wire electrode (Nicolet Biomedical), which consisted of two 50-m insulated nickel alloy wires threaded inside a 25-gauge needle, was inserted into the first dorsal interosseous. The EMG activity recorded by the electrode was sampled at 2 kHz and amplified by a Coulbourn V75– 01 bioamplifier with a gain of 1,000 and band-passed filtered (8 –10,000 Hz). Force and intramuscular EMG data were all saved to the hard disk of the microcomputer.
Procedures The subject’s maximal voluntary contraction (MVC) was determined at the start of the experimental session. Subjects were instructed to produce the maximal amount of isometric force by abducting their index finger. The force applied to the load cell was displayed on the monitor to provide visual feedback. Three 6-s maximal contractions were recorded with 30 s rest between each contraction. The subject’s MVC was determined to be the average of the highest force produced in each trial. EXPERIMENTAL DESIGN AND INSTRUCTIONS. Subjects adjusted their force level to match a red target line displayed on the monitor. Subjects viewed on-line feedback of their performance in the form of yellow force trajectory that moved left to right across the screen with time. They were instructed to minimize the deviations between the yellow force trajectory and the target line throughout all trials. Subjects were presented a feedback score at the end of the trial to encourage maximal performance. The score was the absolute error during the last 20 s of the trial and was calculated with the equation: E ⫽ (兺 Si ⫺ Fi )/n ⫺ 1, where Si is the ith value of the target sinewave, Fi is the ith force sample, and n is the number of data samples. To investigate task effects on the structure of neuromuscular activity and force variability, subjects produced force in a sinusoidal fashion at the 5 and 25% of their MVC (see Fig. 1). Four sinusoidal target frequencies (1– 4 Hz) were presented to each subject. The amplitude of the sinusoidal target was 10% of the individual subject’s MVC, while the midpoint of the target was set to the subject’s target force level. For instance in the 25% force condition, a subject with a MVC of 40 N would sinusoidally modulate their force output around a mean of 10 N with a maximum of 12 N and a minimum of 8 N. There were three 25-s trials at each unique condition with a 60-s rest between trials. The order of the force and sinusoidal targets were randomly presented. ESTIMATION OF MAXIMAL VOLUNTARY CONTRACTION.
Data analysis The initial 4 s and final 1 s of the force data were removed to eliminate any transitory force production in the beginning or end of each trial. The force data were then digitally filtered using a ninthorder low-pass Butterworth filter with a cutoff frequency of 30 Hz. All data processing was performed using software written in Matlab (The Math Works, Natick, MA). To examine if subjects were able to produce force at the given task frequency, modal force production frequency was calculated. Autospectral analysis of the force data was performed using Welch’s average periodogram method. A window size of 256 was used with a sampling rate of 100 Hz resulting in a 0.3906-Hz frequency bin for each power spectral estimate. Modal frequency was determined to be the frequency with the highest power density. Task performance was determined by calculating the root mean square error (RMS) of each trial using the equation: [兺(si ⫺ fi)2/ n ⫺1]1/2, where si is the ith value of the target sinewave, fi is the ith
91 • JANUARY 2004 •
www.jn.org
174
SOSNOFF, VAILLANCOURT, AND NEWELL
force sample, and n is the number of data samples. The calculation of RMS yielded a global measure of task performance. It was used to access age-related changes in movement accuracy as a function of task demands.
16.85 N). The force target levels used in the experiment were scaled to each individual subject’s MVC. Isometric force output
Frequency structure of intramuscular EMG activity The frequency structure of the first dorsal interosseous muscle EMG was examined using Welch’s averaged periodogram method of auto-spectral analysis. The frequency structure of the EMG signal in particular bandwidths reveals varying neural rhythms present in motor output (McAuley et al. 1997, 2001; Vaillancourt et al. 2003). During data collection, the analog EMG signal was high-pass filtered at 8 Hz to remove skin movement artifacts. Following the analog-to-digital converter, the first dorsal interosseous muscle EMG was rectified and digitally low-pass filtered with a cutoff frequency of 70 Hz. By rectifying and filtering the EMG signal, this resulted in the demodulated EMG signal (Fox and Randall 1970). The demodulated EMG signal enhances the spectral power at the low frequencies (e.g., 0 –30 Hz) where motor unit synchronization and entrainment are of principle interest (Elble and Koller 1990; Halliday et al. 1999). For spectral analysis, the window size of 2,048 combined with a sampling frequency of 2,000 Hz resulted in a 0.9766-Hz frequency bin for each power spectral density. The modal frequency of the EMG spectrum was determined to be the frequency bin with the greatest power density. Additionally, the relative power (power in frequency bin divided by total amount of power) between 0 and 5, 5 and 15, 15 and 30, and 35 and 50 Hz was calculated. This provided a method to assess gradual shifts in power at specific frequencies as a function of age and task frequency conditions.
Coherence analysis We examined whether there was coupling between different levels of motor output by performing coherence analysis between force output and intramuscular EMG. The EMG signal was downsampled to 100 Hz so that coherence could be calculated between the force and EMG signals. A window size of 128 points and a sampling rate of 100 Hz resulted in a 0.78-Hz frequency bin for each power spectral estimate. Shifts in the coherence due to age and task frequency demands were evaluated by calculating maximal coherence. Also, to further examine the lag between the force output and EMG, phase was calculated. Phase was only quantified where coherence was significant and extended over five frequency bins. The constant time lag between the two signals was estimated by fitting a line through the phase spectrum over the five significant coherent frequency bins. The time lag was calculated by dividing the slope of this line by 2 (Grosse et al. 2003).
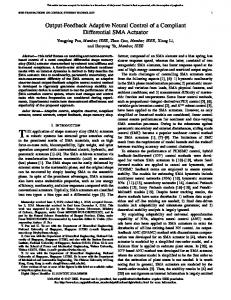
Figure 1 depicts the force output and the EMG activity of a young subject and an older-old subject across the 1- and 3-Hz force target conditions at 5% MVC. Figure 1, Y, demonstrates that the young participant was able to scale the frequency of force output to the 1- and 3-Hz target frequencies. Although the older subject was able to produce force at the correct frequency for the 1-Hz target condition (Fig. 1, O), the force output was neither as smooth nor sinusoidal as the young subject. The 3-Hz target condition proved more difficult for the older subject as the frequency of force was actually at 2 Hz instead of the required 3-Hz target. This behavioral finding was further examined in the force output by calculating the force frequency and RMS values. Figure 2 shows that the frequency of force production increased with target frequency. The three-way age by force by target frequency ANOVA revealed that the young group had a significantly greater modal frequency compared with the two older groups (P ⬍ 0.05), all three groups increased the modal frequency with the increased target frequency (P ⬍ 0.05), and there was a significant age by target frequency interaction (P ⬍ 0.05). The force level did not influence the modal frequency of force output. Post hoc analysis revealed that the age by target frequency interaction was due to the young age group producing force at a greater frequency in the 3-Hz task than the older-old group and at a greater frequency than both older age groups in the 4-Hz task. At both the 1- and 2-Hz targets, the young, old, and
Statistical analysis The dependent variables discussed above were each placed independently in a mixed model ANOVA with age as a between subject factor and repeated measures on target frequency and force level. When relevant, Tukey’s honestly significant difference (HSD) test was used to determine the specific effects contributing to the general ANOVA. All statistics were evaluated as significant when there was less than a 5% chance of making a type I error (P ⬍ 0.05), and only significant effects are reported. All statistical analyses were completed using Statistica statistical package (StatSoft). RESULTS
The MVC ranged from 6.6 to 38.5 N with a mean of 19.9 ⫾ 6.2 (SD) N. There was a main effect for age (P ⬍ .05), and post hoc analysis revealed that the effect of age was due to the young having a greater MVC than the oldest-old (21.84 vs. J Neurophysiol • VOL
FIG. 1. Force output and electromyographic (EMG) activity at 1- and 3-Hz targets at 5% maximal voluntary contraction ((MVC). Left: the 1-Hz condition; right: the 3-Hz condition. Y, force output and EMG activity of a young subject. O, force output and EMG activity of a older-old subject at 1- and 3-Hz targets at 5% MVC. Top trace in each panel is force output at the respective conditions; bottom trace is the EMG activity.
91 • JANUARY 2004 •
www.jn.org
AGING, FORCE VARIABILITY, AND TASK DEMANDS
175
quency of force output with the target frequency, whereas the older adults were unable to match the target frequencies in the 3- and 4-Hz conditions. In the young group, RMS values were reduced in the 1-Hz condition compared with the 2-, 3-, and 4-Hz conditions, but force accuracy did not change across target frequency in the older groups. The target frequency by aging interaction was due to the greater force accuracy in the young group at the 1-Hz target compared with no age differences at the higher frequency targets. Overall, the main performance differences between the young and older adults was the older adults’ inability to produce force at the higher target frequencies and reduced accuracy at the 1-Hz target. FIG. 2. Modal force frequency as a function of target frequency for each age group averaged across force levels.
older-old groups produced force at frequencies that closely matched the target frequency and there were no age group differences (P ⬎ 0.05). Figure 2 indicates that the age group difference became apparent at the 3- and 4-Hz targets. At the 3-Hz target, the young group produced force at ⬃3 Hz, whereas both of the older groups varied ⬃2.5 Hz at each force level (P ⬍ 0.05). A similar finding occurred at the 4-Hz target condition, as the young group produced force slightly less than the 4-Hz target and the older groups slightly ⬍2.5 Hz (P ⬍ 0.05). Two dependent sample t-test statistics were performed between the 3- and 4-Hz targets for each older age group. This analysis showed there was no difference in the modal frequency for the 3- and 4-Hz targets (P ⬎ 0.05). Figure 3 depicts the RMS values for each age group across the target frequency averaged across force level. A three-way age by force by target frequency ANOVA indicated that the young group had lower RMS values compared with the older groups (P ⬍ 0.05), the RMS values increased with both force and target frequency (P ⬍ 0.05), and there was an age by target frequency interaction (P ⬍ 0.05). Post hoc analysis revealed that the age by target frequency interaction was due to the young subjects having significantly lower RMS values only at the 1-Hz target compared with the older subjects (P ⬍ 0.05). To examine if force accuracy was constant across frequencies in the older age groups, one-way ANOVAs with target frequency as the main factor were performed for the old and older-old age groups. It was found that there was no difference in force accuracy as a function of target frequency in the old age groups. In summary, the young subjects increased their modal fre-
FIG. 3. Root mean square error (RMS) as a function of target frequency for each age group averaged across force levels.
J Neurophysiol • VOL
Frequency structure of intramuscular EMG activity Figure 4, A–D, depicts the normalized spectral analysis of the EMG signal of a young participant at the higher force level over the four target frequencies. It is clear that there is a pronounced shift in the frequency structure of the EMG as force is produced at higher frequencies. More specifically, at the 1-Hz frequency condition (Fig. 4A), several distinct spectral peaks are noticeable in the 0- to 5-Hz, 5- to 15-Hz, 15- to 30-Hz, and 35- to 50-Hz bandwidths. As force is produced at higher frequencies, there is a dramatic decrease in relative power in the 10- to 50-Hz bandwidth and the emergence of a dominant peak near the frequency of force production (see Fig. 4, B–D). Figure 5 shows the EMG modal frequency for each age group as a function of force production frequency in the 5% (left) and 25% (right) conditions. Because the Fourier analysis binned the frequency every 0.78 Hz, this marks the resolution of the axes in Fig. 5. For all age groups, at the lowest frequency of force production (0.78 Hz), the EMG modal frequency is
FIG. 4. The normalized frequency structure of EMG activity for a young subject from 0 to 60 Hz at each distinct target frequency. A: at the lowest target frequency, several dominant peaks are present. B–D: as target frequency increases, there is a systematic decrease in higher frequency activity and the emergence of a dominant peak at the target frequency.
91 • JANUARY 2004 •
www.jn.org
176
SOSNOFF, VAILLANCOURT, AND NEWELL
FIG. 5. Modal frequency of the EMG signal for individual trials as a function of modal force frequency for each age group at both 5 and 25% MVC. Left: the 5% condition; right: the 25% condition. Top: the young age group’s data; middle: the old age group’s data; bottom: the older old age group’s data.
spread throughout the frequency range. Figure 5 also reveals that as force frequency increases, a different relation between the force output frequency and EMG modal frequency is found between age groups. For the young group, it appears that as force frequency increases, the EMG modal frequency became concentrated at the target force frequency and never occurred ⬎10 Hz. For the old group, the disappearance of the higher modal frequencies did not occur until a much higher frequency of force production (⬎3 Hz), and the older-old group did not show the same concentration of EMG modal frequency even at the higher force frequency levels. Additionally, at the low force level, there were no trials where the EMG modal frequency of the older-old group occurred in the 40-Hz band. However, the older-old group did have a few trials of 40-Hz EMG activity at the 25% force level, but this was still considerably less than the younger individuals (Fig. 5). To further examine this relationship, k-means cluster analysis (Statistica v5.1, StatSoft) was performed at each force frequency for each age group. Table 1 lists the mean and SD of each cluster of EMG modal frequencies at each force frequency for all age groups. ConJ Neurophysiol • VOL
firming the observations made from Fig. 5, the cluster analysis reveals that the young age group only has multiple clusters (centered around 2.88, 20.93, and 40.31 Hz) at the lowest frequency of force (0.78 Hz). Additionally, the clusters at the lowest force frequency are very similar in all age groups, although they are somewhat suppressed in the older-old. Last, the persistence of the multiple clusters as force frequency increases in the old age groups can also be seen in Table 1. This relationship between age, force frequency and distribution of EMG was further examined by calculating the relative power in bandwidths (0 –5, 15–35, and 35–50 Hz) corresponding to the clusters revealed in the cluster analysis. Also, because previous work supports the importance of the 5- to 15-Hz band (Elble and Randall 1976; Vaillancourt et al. 2003), this region was also examined. Figure 6, A and B, shows the relative power in the 0- to 5- and 35- to 50-Hz bands across target frequency and age groups averaged across force levels. In the 0- to 5-Hz band, the three-way age by force by target frequency ANOVA showed that the relative power increased with the target frequency (P ⬍ 0.05), and there was an age by
91 • JANUARY 2004 •
www.jn.org
AGING, FORCE VARIABILITY, AND TASK DEMANDS TABLE
177
1. Cluster analysis of EMG modal frequencies at each modal force frequency as a function of age and force level Force Frequency 0.78 Hz
Age Young
Old
Older-old
1.56 Hz
2.34 Hz
3.12 Hz
3.9 Hz
Cluster
5%
25%
5%
25%
5%
25%
5%
25%
5%
25%
1 2 3 1 2 3 1 2 3
39.96 ⫾ 2.34 21.34 ⫾ 4.60 3.44 ⫾ 1.76 37.11 ⫾ 3.49 18.39 ⫾ 2.83 4.15 ⫾ 2.75 31.25 ⫾ 0.00 18.55 ⫾ 2.10 3.53 ⫾ 1.92
40.65 ⫾ 3.12 20.51 ⫾ 4.91 2.31 ⫾ 1.32 39.55 ⫾ 1.26 21.57 ⫾ 4.33 3.94 ⫾ 2.70 38.80 ⫾ 7.5 18.81 ⫾ 3.61 2.96 ⫾ 2.14
3.35 ⫾ 1.22
2.93 ⫾ 0.00
3.78 ⫾ 1.70
3.41 ⫾ 0.70
4.26 ⫾ .69
4.19 ⫾ .52
4.73 ⫾ .49
4.65 ⫾ .92
40.36 ⫾ 5.64 21.22 ⫾ 4.43 4.28 ⫾ 2.00 28.32 ⫾ 0.0 18.55 ⫾ 2.11 3.53 ⫾ 1.91
29.05 ⫾ 3.30 21.73 ⫾ 2.54 3.74 ⫾ 1.83 33.20 ⫾ 1.38 14.65 ⫾ 1.95 3.39 ⫾ 1.69
38.03 ⫾ .01 16.27 ⫾ 3.99 3.58 ⫾ 1.42 16.11 ⫾ 0.56 7.53 ⫾ 0.48 3.49 ⫾ 0.51
20.02 ⫾ 2.07 11.58 ⫾ 1.82 3.36 ⫾ 0.61 16.41 ⫾ 1.27 7.32 ⫾ 0.82 2.93 ⫾ 0.64
49.80 ⫾ 0.01 10.74 ⫾ 0.01 3.83 ⫾ 0.84 20.58 ⫾ 9.67 4.34 ⫾ 1.30
4.07 ⫾ .38
17.58 ⫾ 1.38 4.88 ⫾ 0.47
20.02 ⫾ 0.69 5.06 ⫾ 0.38
20.18 ⫾ 5.39 5.16 ⫾ 1.84
Values are means ⫾ SD.
target frequency interaction (P ⬍ 0.05). The force level did not affect the relative power in the 0- to 5-Hz band. Post hoc analysis revealed that the age by target frequency interaction was due to the young subjects having greater relative power in the 0- to 5-Hz band at the 3- and 4-Hz targets (P ⬍ 0.05), whereas there was no difference between groups at the 1- and 2-Hz targets. This is consistent with the modal force frequency results where young subjects increased their force frequency, but the older groups were unable to produce force at the faster target frequency conditions (Fig. 2). The three-way age by force by target frequency ANOVA confirmed that the increase in relative power in the 5- to 15-Hz band with the target frequency was significant (P ⬍ 0.05; 0.217, 0.235, 0.257, and 0.264, respectively). The age by target frequency interaction was not significant and there was no significant main effect for age in the 5- to 15-Hz band. The three-way age by force by target frequency ANOVA of the 15- to 35-Hz band revealed that there was a main effect for force, frequency, and an age by force by frequency interaction. The 25% MVC task was found to have greater relative power (P ⬍ 0.05). Relative power was also found to decrease with an increase in target frequency (P ⬍ 0.05). Post hoc analysis revealed that the interaction among age, force, and target frequency was due to the young group having less relative power than the old age groups in the 3-Hz task at the lower force level, in addition to having less relative power in the 3and 4-Hz task at the higher force level. Figure 6B shows the relative power in the 35- to 50-Hz band
FIG. 6. A: the relative power in the 0- to 5-Hz bandwidth of EMG spectral analysis as a function of target frequency for each age group averaged across force levels. B: the relative power in the 35- to 50-Hz bandwidth of EMG spectral analysis as a function of target frequency for each age group averaged across force levels.
J Neurophysiol • VOL
also decreases as a function of target frequency. The three-way age by force by target frequency ANOVA revealed that the young subjects had less 35- to 50-Hz power compared with the older groups (P ⬍ 0.05), greater relative power with increased force level (P ⬍ 0.05), and an age by target frequency interaction (P ⬍ 0.05). The age by target frequency interaction was due to the young group having significantly lower relative power compared with the older groups (P ⬍ 0.05) at the 3- and 4-Hz target frequency conditions but not at the 1- and 2-Hz targets. In summary, three main observations were found in the frequency structure of the intramuscular EMG: 1) as a function of the target frequency, all age groups shifted power from high (35–50 Hz) to low (0 –5 Hz) bandwidths; 2) as the target frequency increased, the young group had greater relative EMG activity in the 0- to 5-Hz band compared with the older groups; and 3) at the higher target frequencies, the young group reduced relative EMG activity in the 35- to 50-Hz band to a greater extent than the older group. These findings support the hypothesis that older adults have a reduced ability to shift EMG power across frequency bands. Coherence analysis To determine if there was a consistent change in the relation between the levels of the neuromuscular system, coherence and phase analysis was performed between force output and intramuscular EMG. Figure 7A shows the force-EMG coherence from a young and old subject at 5% MVC in the 3-Hz target condition. In the young subject, most of the significant coherence was concentrated ⬍10 Hz, whereas the elderly subject had significant coherence ⬃20 and 45 Hz as well as ⬍10 Hz. There was greater coherence in the 0- to 5-Hz band for the young subject compared with the older participant. Figure 7, B and D, shows the maximal coherence in the 0- to 5-Hz band across the target frequency conditions for each age group at both force levels. The age by force by target frequency ANOVA showed a significantly greater coherence in the young subjects compared with the two older groups (P ⬍ 0.05). The age group difference was even greater at the 25% MVC condition than the 5% condition supported by an age by force interaction (P ⬍ 0.05). However, there was no age difference during the 4-Hz task at the lower force level, whereas there was an age difference at the same task at the higher frequency leading to an age by force level by target frequency interaction. Thus the coherence revealed a stronger force-EMG relation in
91 • JANUARY 2004 •
www.jn.org
178
SOSNOFF, VAILLANCOURT, AND NEWELL
FIG. 7. A: coherence plot between the force signal and the EMG signal during rhythmical force production at the 5% MVC and 3-Hz condition for a young and old subject. B: maximal coherence value for the 0- to 5-Hz bandwidth between force and EMG signals as a function of age and target frequency at 5% MVC. C: phase plot between the force signal and the EMG signal during rhythmical force production at the 5% MVC and 3-Hz condition for a young and old subject. D: maximal coherence value for the 0- to 5-Hz bandwidth between force and EMG signals as a function of age and target frequency at 25% MVC. E: phase difference between force and EMG signals as a function of age and target frequency at 5% MVC. F: phase difference between force and EMG signals as a function of age and target frequency at 25% MVC.
the 0- to 5-Hz band for the young group compared with the older groups and this difference was even greater at the highest force level. Figure 7C shows the force-EMG phase relationship for the same young and old subject as in Fig. 7A at 5% MVC in the 3-Hz condition. It can be seen that there is relatively little difference between the older and younger subject in the phase relationship in the lower frequency bandwidth. As phase values are only meaningful at frequencies with significant coherence, we calculated the phase difference (time lag) between the EMG signal and force output only if coherence was significant over five consecutive frequency bins. Figure 7, E and F, shows phase difference (ms) across the target frequency conditions for each age group at both force levels. Importantly, the phase relation between force and EMG is negative, indicating that oscillations in the EMG precede the force output oscillations. The age by force by target frequency ANOVA revealed a significant main effect for force and target frequency as well as an age by target frequency by force interaction (P ⬍ 0.05). Post hoc analysis revealed that the 3- and 4-Hz target frequency had significantly smaller phase difference (⫺42 and ⫺35 ms) than the other tasks (⫺55 and ⫺50 ms, respectively). It was also J Neurophysiol • VOL
found that the higher force level had a lower phase difference (⫺42 vs. ⫺49 ms). Post hoc analysis revealed that age-target frequency-force interaction was a result of the oldest age group having smaller phase difference (⫺48 ms) than the young (⫺64 ms) in the 1-Hz task during the low force level, but greater phase difference in the 2-Hz task during the high force level (⫺51 vs. ⫺38 ms, respectively). These phase values are slightly larger than those reported by McAuley et al. (1997), and methodological differences between the studies readily explain this discrepancy. Corcos and colleagues (1992) have shown that the time separating electrical activity of the muscle and first detectable production of force (i.e., electromechanical delay) is dependent on several factors including the rate of muscle force production and the mechanical impedance of the measuring device. Both of these factors were quite different in the current investigation and the McAuley et al. (1997) study. In short, McAuley and colleagues measured constant force output using an elastic load and an accelerometer directly attached to the finger, whereas in the current study isometric rhythmical force output was quantified with a load cell. The elastic band and accelerometer attached to the finger would give the shortest phase estimates.
91 • JANUARY 2004 •
www.jn.org
AGING, FORCE VARIABILITY, AND TASK DEMANDS DISCUSSION
The purpose of this study was to examine the effects of aging on the relation between oscillatory EMG activity and the frequency of force production. The main hypothesis tested in this study was that the nature of the task channels the relative input dynamics between the low- and high-frequency EMG activity and that older adults have greater high-frequency and reduced low-frequency EMG activity during fast rhythmical contractions. The experiment examined a pool of motor units using fine wire EMG from the first dorsal interosseous muscle of 45 subjects spanning 20 – 88 yr over 1-, 2-, 3-, and 4-Hz force sinewave targets. Spectral analysis examined the multiple oscillations present in the intramuscular EMG that represent the frequency modulation of a population of motor units (Brown 2000). The findings provide significant insight into the relative contribution of low- and high-frequency oscillatory mechanisms that alter force control with aging. Aging and rhythmical force output The current investigation demonstrated that older adults are less accurate in their force output compared with young adults when rhythmically producing force at 1 Hz. The impaired motor performance of older adults is in agreement with much of the work on constant, ramp, and discrete force output (Christou and Carlton 2001; Galganski et al. 1993; Laidlaw et al. 2000). Also, this finding confirms the work of Vaillancourt and colleagues (2003) that force accuracy is reduced with aging during low-frequency rhythmic contractions but extends their findings to show that accuracy does not change with age at 2-, 3-, and 4-Hz contractions. It is important to note that although there was no difference in force accuracy as indexed by RMS between age groups at greater target frequencies, the young adults did reach the force frequency requirements in all conditions, whereas the older adults reached a force frequency plateau ⬃2.5 Hz. This contrast between frequency error and RMS suggests that older adults focused on a different aspect of the task demand and utilized a different strategy to minimize RMS error. Poulton (1974) theorized that to minimize RMS error when lagging behind a target, the best strategy is to decrease amplitude, and Jagacinski and colleagues (1995), in a joystick tracking task, have shown that older adults adopt this behavior. It is proposed that older adults are unable to produce force at fast contraction rates (Christou and Carlton 2001) and, as a consequence, maximized their performance by decreasing their force amplitude. This strategic difference between age groups shows that older adults are able to compensate for physiological deficits with behavioral modifications.
179
ally, when patients with Parkinson’s disease are given levodopa therapy, 10-Hz EMG activity decreases and 40-Hz EMG activity increases (McAuley et al. 2001). Finally, deep brain stimulation of the internal pallidum in Parkinson’s disease patients creates a shift in the relative power of EMG from 12 to 40 Hz (Brown et al. 1999). The present experiment examined the high- to low-frequency shift of intramuscular EMG activity with aging to determine if changes in the task frequency could alter the ratio of frequency contributions with aging. At slow force contractions, there were minimal differences between age groups in high-frequency (35–50 Hz) EMG activity (Fig. 6). However, when the target frequency increased to ⬎2 Hz, the young adults increased low-frequency EMG power (0 –5 Hz and 5–15 Hz) to levels that were higher than the older adults. Additionally, the young adults decreased the high-frequency (35–50 Hz) EMG activity below that of the older adults. This observation was also confirmed by the modal frequency analysis of the EMG activity where the young adults entrained their motor unit output to the task frequency but the older adults were more variable (Fig. 5). These findings support the hypothesis (see INTRODUCTION) that the nature of the task channels the relative input dynamics between low- and high-frequency EMG activity. Most importantly, the findings demonstrate that older adults have an impaired ability to coordinate excitatory and inhibitory activity of multiple neural oscillators. To elaborate on the relation between aging and EMG activity over different target frequency conditions, coherence and phase analyses between the force and EMG signals were performed. The frequency at which maximal coherence was obtained between force and the EMG signal was tightly coupled with the target frequency. The coherence level was quantified in the 0- to 5-Hz band and was stronger in younger adults over all target frequency conditions (Fig. 7, A, B, and D). The phase analysis consistently showed that the EMG signal preceded the force output (Fig. 7, E and F) (McAuley et al. 1997). However, the phase analysis did not reveal systematic differences between young and older adults at all of the target frequency conditions as did the coherence analysis. The important implication of these findings is that the temporal properties of the electromechanical process did not influence the aging-related changes in motor performance. This outcome is consistent with the postulate that young adults have greater EMG-force coherence due to a greater strength of coupling from the task-related oscillatory drive coordinating large pools of motor units. This ability to coordinate the neural drive to the motor neuron pool at the task frequency allows for a smoother force trajectory at the required rate of force production.
Low- and high-frequency neuromuscular activity with aging
Do individual motor units or a pool of motor units alter force variability?
It was previously shown that during isometric force production, older adults have less 40-Hz and greater 10-Hz intramuscular EMG activity when compared with young adults (Vaillancourt et al. 2003). These findings on aging were consistent with work that has shown that when Parkinson’s disease patients maintain a constant limb position or a constant force level, a loss of 20- and 40-Hz EMG activity is observed, and there is an increase in 10-Hz EMG activity (Brown 1997; Brown et al. 1997; Vaillancourt and Newell 2000). Addition-
A dominant feature of human aging is that motor output becomes more variable. Considerable empirical work has examined the firing patterns of individual and pools of motor units (Enoka et al. 2003; Roos et al. 1997) in hopes of finding neurophysiological correlates for the aging-related changes in force variability. The mechanisms examined at the individual motor-unit level include the force exerted by single motor units (Erim et al. 1999; Galganski et al. 1993) and the variability in motor-unit discharge (Erim et al. 1999; Laidlaw et al. 2000).
J Neurophysiol • VOL
91 • JANUARY 2004 •
www.jn.org
180
SOSNOFF, VAILLANCOURT, AND NEWELL
However, although Erim and colleagues (1999) found that single motor-unit discharge variability at 20% MVC was greater in older compared with young adults, no difference in force output variability was found with aging. Similarly, while Vaillancourt and colleagues (2003) found a difference in force variability with aging, there were no differences in the motorunit discharge rate variability with aging. In their review of aging motor performance and motor-unit mechanisms, Enoka and colleagues (2003) emphasized that the mixed experimental findings on the variability of motor unit discharge indicate that other neural mechanisms also contribute to the performance decrement with aging. The frequency structure of the isometric force output provides a window into revealing the mechanisms of other oscillatory processes influencing aging effects on motor performance. For instance, isometric force variability has a dominant frequency at ⬃1 Hz related to slow sensori-motor processes (Slifkin et al. 2000). This ⬃1-Hz peak captures most of the variance of the force spectrum and corresponds to large changes in the net activity of the motor neuron pool (Allum et al. 1978; Freund 1983). A smaller component of force variability occurs in the 8- to 12-Hz range and is often referred to as physiological tremor. The 8- to 12-Hz component has been directly related to motor-unit synchrony in the same bandwidth (Elble and Randall 1976; Halliday et al. 1999). In human aging, most of the force variability changes occurs in the force spectrum ⬍4 Hz (Vaillancourt and Newell 2003). Thus the changes in force performance with aging are also affected by population level changes in motor-unit activity. This observation is consistent with the finding that multiple features of motor-unit activity (i.e., individual and population effects) influence force fluctuations (Taylor et al. 2003). Changes in the oscillatory neural output with age It is well documented that there are multiple oscillations present in the population activity from a pool of motor units (Brown 2000). For example, the lowest frequency documented in motor unit output is the 1- to 2-Hz common drive rhythm that is considered to be of central origin (De Luca et al. 1982; Kamen and De Luca 1992). Elble and Randall (1976) initially showed that 10-Hz motor-unit activity is a contributing mechanism to the 10-Hz tremor measured in force output, and Wessberg and Vallbo (1996) observed similar 10-Hz motorunit activity during slow, voluntary finger movement. Semmler and colleagues (2002) have shown that 2- to 12-Hz motor-unit synchronization is enhanced in postural and lengthening contractions compared with shortening contractions. Also, numerous studies have reported that 15- to 30-Hz motor-unit activity is present during constant force production (Conway et al. 1995; Farmer et al. 1993) and a 20-Hz electroencephalographic-EMG and magnoencephalographic-EMG coherence exists between distal hand muscles and cortical areas (Baker et al. 1997; Kilner et al. 1999; Mima et al. 2001), suggesting a central cortical drive for the 15- to 30-Hz band. The 35- to 50-Hz (Piper) rhythm has been shown in the EMG during strong and weak contractions (Brown 1997; McAuley et al. 1997), and this oscillation has been related to the contralateral motor cortex through magnoencephalographic-EMG coherence analyses during repeated maximal force contractions (Brown et al. 1998). J Neurophysiol • VOL
These previous studies offer converging evidence that multiple oscillations from cortical circuits provide amplitude- and frequency-varying input to the motor neuron pool. Although the importance of these neural oscillators in the physiology of motor control is well established (Brown 2000), the particular function of each of these neural rhythms in the collective force output remains unclear. Nevertheless, these previous studies along with the present findings hold theoretical implications for the mechanisms of aging-related changes in force output performance. We postulate that in healthy young adults there is wide adaptive flexibility to modulate the excitatory and inhibitory properties of the neural oscillators that input to the motor neuron pool. Young adults are able to regulate each of these neural oscillators in a coordinative output to match the required task demand (Kilner et al. 1999). In contrast, aging humans lose the adaptive ability to coordinate the excitatory and inhibitory properties of the multiple neural oscillators. A similar postulate regarding the “loss of common drive” with aging was advanced by Erim and colleagues (1999). The major difference between the model of Erim and DeLuca and the present postulate is that the common drive model only considers lowfrequency neural rhythms, whereas we suggest that human aging results in losing the adaptive capability to modulate and balance multiple neural oscillators (Lipsitz 2002; Vaillancourt and Newell 2002). Focusing the amplitude of the oscillatory input frequency at the motor neuron pool allows motor units to become coordinated at the input frequency, creating a smooth force output with reduced complexity (Vaillancourt and Newell 2003). By contrast, distributing power to multiple frequencies balances the synchronization of motor units at these specified frequencies causing more complex force output (Vaillancourt and Newell 2003), a strategy that is very effective in reducing error in constant force tasks. In conclusion, it is proposed that the progressive inability with human aging to adaptively modulate the multiple oscillatory inputs to the motor neuron pool contributes, along with other mechanisms of motor unit contraction (Enoka et al. 2003), to the functional losses in motor performance. ACKNOWLEDGMENTS
We thank the two anonymous reviewers for helpful comments in revising the paper. GRANTS
This research was supported in part by grants from the National Institutes of Health (T32-AG-00048 and F32-NS-44727) and the Gerontology Center at The Pennsylvania State University (GERO 423-141001). We are grateful for the nursing care provided by the staff of the Penn State General Clinical Research Center at the Noll Physiological Research Laboratory (supported by National Institutes of Health Grant M01-RR-10732). REFERENCES
Allum JHJ, Dietz V, and Freund H. Neuronal mechanisms underlying physiological tremor. J Neurophysiol 41: 557–571, 1978. Baker SN, Olivier E, and Lemon RN. Coherent oscillations in monkey motor cortex and hand muscle EMG show task-dependent modulation. J Physiol 501: 225–241, 1997. Brown P. Muscle sounds in Parkinson’s disease. Lancet 349: 533–535, 1997. Brown P. Cortical drives to human muscle: the Piper and related rhythms. Prog Neurobiol 60: 97–108, 2000. Brown P, Corcos DM, and Rothwell JC. Does Parkinsonian action tremor contribute to muscle weakness in Parkinson’s disease? Brain 120: 401– 408, 1997.
91 • JANUARY 2004 •
www.jn.org
AGING, FORCE VARIABILITY, AND TASK DEMANDS Brown P, Salenius S, Rothwell JC, and Hari R. Cortical correlate of the piper rhythm in humans. J Neurophysiol 80: 2911–2917, 1998. Brown RG, Dowsey PL, Brown P, Jahanshahi M, Pollak P, Benabid AL, Rodriguez-Oroz MC, Obeso J, and Rothwell JC. Impact of deep brain stimulation on upper limb akinesia in Parkinson’s disease. Ann Neurol 45: 473– 488, 1999. Christakos CN. A study of the muscle force waveform using a population stochastic model of skeletal muscle. Biol Cybern 44: 91–106, 1982. Christou EA and Carlton LG. Old adults exhibit greater motor output variability than young adults only during rapid discrete isometric contractions. J Gerontol A Biol Sci Med Sci 56: B524 –532, 2001. Conway BA, Halliday DM, Farmer SF, Shahani U, Maas P, Weir AI, and Rosenberg JR. Synchronization between motor cortex and spinal motoneuronal pool during the performance of a maintained motor task in man. J Physiol 489.3: 917–924, 1995. Corcos DM, Gottlieb GL, Latash ML, Almeida GL, and Agarwal GC. Electromechanical delay: an experimental artifact. J Electromyogr Kinesiol 2: 59 – 68, 1992. De Luca CJ, LeFever RS, McCue MP, and Xenakis AP. Control scheme governing concurrently active human motor units during voluntary contractions. J Physiol 329: 129 –142, 1982. Elble RJ and Koller WC. Tremor. Baltimore, MD: The John Hopkins University Press, 1990. Elble RJ and Randall JE. Motor-unit activity for 8- to 12- Hz component of human physiological finger tremor. J Neurophysiol 39: 370 –383, 1976. Enoka RM, Christou EA, Hunter SK, Kornatz KW, Semmler JG, Taylor AM, and Tracy BL. Mechanisms that contribute to differences in motor performance between young and old adults. J Electromyogr Kinesiol 13: 1–12, 2003. Erim Z, Beg MF, Burke DT, and Luca CJD. Effects of aging on motor-unit control properties. J Neurophysiol 82: 2081–2019, 1999. Farmer SF, Bremner FD, Halliday DM, Rosenberg JR, and Stephens JA. The frequency content of common synaptic inputs to motoneurons studied during voluntary isometric contraction in man. J Physiol 470: 127–155, 1993. Fox JR and Randall JE. Relationship between forearm tremor and the biceps electromyogram. J Appl Physiol 29: 103–108, 1970. Freund HJ. Motor unit and muscle activity in voluntary motor control. Physiol Rev 63: 387– 436, 1983. Galganski ME, Fuglevand AJ, and Enoka RM. Reduced control of motor output in a human hand muscle of elderly subjects during submaximal contractions. J Neurophysiol 69: 2108 –2114, 1993. Grosse P, Guerrini R, Parmeggiani L, Bonanni P, Pogosyan A, and Brown P. Abnormal corticomuscular and intermuscular coupling in high-frequency rhythmic myoclonus. Brain 126: 326 –342, 2003. Halliday DM, Conway BA, Farmer SF, and Rosenberg JR. Load-independent contributions from motor-unit synchronization to human physiological tremor. J Neurophysiol 82: 664 – 675, 1999. Jagacinski RJ, Liao MJ, and Fayyad EA. Generalized slowing in sinusoidal tracking by older adults. Psychol Aging 10: 8 –19, 1995.
J Neurophysiol • VOL
181
Kamen G and De Luca CJ. Firing rate interactions among human orbicularis oris motor units. Int J Neurosci 64: 167–175, 1992. Kilner JM, Baker SN, Salenius S, Jousmaki V, Hari R, and Lemon RN. Task-dependent modulation of 15–30 Hz coherence between rectified EMGs from human hand and forehand muscles. J Physiol 516: 559 –570, 1999. Laidlaw DH, Bilodeau M, and Enoka RM. Steadiness is reduced and motor unit discharge is more variable in old adults. Muscle Nerve 23: 600 – 612, 2000. Lipsitz LA. Dynamics of stability: the physiologic basis of functional health and frailty. J Gerontol A Biol Sci Med Sci 57: B115–125, 2002. McAuley JH, Corcos DM, Rothwell JC, Quinn NP, and Marsden CD. Levodopa reversible loss of the Piper frequency oscillation component in Parkinson’s disease. J Neurol Neurosurg Psychiatry 70: 471– 476, 2001. McAuley JH, Rothwell JC, and Marsden CD. Frequency peaks of tremor, muscle vibration and electromyographic activity at 10 Hz, 20 Hz, and 40 Hz during human finger muscle contraction may reflect rhythmicities of central neural firing. Exp Brain Res 114: 525–541, 1997. Mima T, Matsuoka T, and Hallett M. Information flow from the sensorimotor cortex to muscle in humans. Clin Neurophysiol 112: 122–126, 2001. Poulton EC. Tracking Skill and Manual Control. New York: Academic, 1974. Roos MR, Rice CL, and Vandervoort AA. Age-related changes in motor unit function. Muscle Nerve 20: 679 – 690, 1997. Semmler JG, Kornatz KW, Dinenno DV, Zhou S, and Enoka RM. Motor unit synchronisation is enhanced during slow lengthening contractions of a hand muscle. J Physiol 545: 681– 695, 2002. Slifkin AB, Vallancourt DE, and Newell KM. Intermittency in the control of continuous force production. J Neurophysiol 84: 1708 –1718, 2000. Sosnoff JJ, Vaillancourt DE, Larsson L, and Newell KM. Rhythmical force production and spectral analysis of intramuscular EMG and motor unit discharge patterns. Orlando, FL: Society for Neuroscience, 2002. Taylor AM, Christou EA, and Enoka RM. Multiple features of motor-unit activity influence force fluctuations during isometric contractions. J Neurophysiol 90: 1350 –1361, 2003. Taylor AM, Steege JW, and Enoka RM. Motor-unit synchronization alters spike-triggered average force in simulated contractions. J Neurophysiol 88: 265–276, 2002. Vaillancourt DE, Larsson L, and Newell KM. Effects of aging on force variability, single motor unit discharge patterns, and the structure of 10, 20, and 40 Hz EMG activity. Neurobiol Aging 24: 25–35, 2003. Vaillancourt DE and Newell KM. The dynamics of resting and postural tremor in Parkinson’s disease. Clin Neurophysiol 111: 2046 –2056, 2000. Vaillancourt DE and Newell KM. Changing complexity in human behavior and physiology through aging and disease. Neurobiol Aging 23: 1–11, 2002. Vaillancourt DE and Newell KM. Aging and the time and frequency structure of force output variability. J Appl Physiol 94: 903–912, 2003. Wessberg J and Vallbo AB. Pulsatile motor output in human finger movements is not dependent on the stretch reflex. J Physiol 493: 895–908, 1996. Yao W, Fuglevand RJ, and Enoka RM. Motor-unit synchronization increases EMG amplitude and decreases force steadiness of simulated contractions. J Neurophysiol 83: 441– 452, 2000.
91 • JANUARY 2004 •
www.jn.org