Attention, Perception, & Psychophysics 2010, 72 (1), 226-235 doi:10.3758/APP.72.1.226
Aging and tactile temporal order James C. Craig, Roger P. Rhodes, Thomas A. Busey, Diane Kewley-Port, and Larry E. Humes Indiana University, Bloomington, Indiana
Although it is generally held that speed of processing declines with age, there have been few studies in which tactile temporal processing has been examined with older subjects. In the present study, temporal order judgments were obtained from a group of younger subjects (n 5 28, mean age 5 23.5 years) and a group of older subjects (n 5 93, mean age 5 69.8 years). The subjects judged the temporal order of two patterns presented to the same finger, four patterns presented to the same finger, and two patterns presented to different hands. Depending on the task, the average thresholds for the older subjects ranged from two to five times longer than the thresholds from the younger subjects. In absolute terms, the largest difference between the young and older subjects was seen in correctly identifying the order of four patterns, a difference of more than 500 msec. There was some support for the decline in temporal processing being due in part to a slowing in cognitive processing, and, depending on the task, in part to stimulus persistence and difficulty in pattern identification.
A number of researchers have documented changes in sensory processing with age. Many fewer researchers have compared tactile sensitivity in older and younger groups of subjects, and fewer still have examined changes in temporal processing of tactile stimuli with age (Laasonen, Lahti-Nuuttila, & Virsu, 2002; see Verrillo, 1993, for a review). In line with results from other modalities, the general finding from the relatively few studies on temporal processing is that processing slows with age. The results from several studies have shown poorer tactile gap detection performance (Humes, Busey, Craig, & KewleyPort, 2009; Van Doren, Gescheider, & Verrillo, 1990) and a greater amount of temporal masking (Gescheider, Valetutti, Padula, & Verrillo, 1992) with older subjects. Several mechanisms have been proposed to account for the declines in sensory processing with age, including increased stimulus persistence (Botwinick, 1978) and declines in the speed of cognitive processing (Salthouse, 1985). This latter mechanism would, presumably, have a greater effect on tasks that require a greater cognitive load. In the present study, we obtained tactile temporal order judgments (TOJs) from both younger and older subjects. There were several reasons for examining TOJs and the effects of aging on these judgments. First, much of the information that we obtain by the sense of touch comes by means of haptic exploration of surfaces. This exploration typically requires sequential processing of spatial and intensive patterns. For example, to properly judge the spatial orientation of an object, one may need to know whether a raised edge is encountered before or after a concave surface. A decline in the ability to correctly judge the order in which surface features are encountered would result in slower or less accurate judgment of the object. Second,
and related to the first issue, is interference resulting from the close temporal proximity of two patterns. The results from several studies of the effect on identifying a target pattern of the presence of a second pattern (a nontarget) have shown considerable interference, in part because of the subjects’ mistakenly responding to the nontarget rather than to the target (Evans, 1987). In other words, when presented with a target and a nontarget pattern in close temporal proximity, subjects apparently make an error in temporal order by identifying the nontarget rather than the target. Again, if age results in poorer TOJs, the subjects may well show increases in this type of interference and reduced accuracy in haptic exploration. Third, the study reported here is part of a larger project in which sensitivity and temporal processing in younger and older subjects is being measured and compared across three modalities: vision, hearing, and touch. The goal of the project is to test a substantial number of older subjects on a range of laboratory measures, primarily those having to do with temporal processing. Performance by the older subjects will be compared with similar measures conducted with younger subjects. By testing a substantial number of older subjects, it is possible to make comparisons not simply between younger and older subjects, but also among the older subjects. The latter point is important, first, because the performance from older subjects often shows considerable variability (Stevens & Cruz, 1996) and, second, because correlations across the extremes of the age continuum, which is often done with smaller samples, may lead to inflated correlations (Hofer, Berg, & Era, 2003; Hofer, Flaherty, & Hoffman, 2006). Also, many variables change with age, and thus, comparing any two variables determined from a group of younger subjects and a group
J. C. Craig,
[email protected]
© 2010 The Psychonomic Society, Inc.
226
Aging and Tactile Temporal Order 227 of older subjects is likely to produce a significant but perhaps relatively meaningless correlation (e.g., between grip strength and visual acuity). It has been suggested that a more meaningful analysis can be carried out within a group of older subjects. For example, do older subjects who perform relatively well on one task also perform well on a second, and perhaps related, task? Such analyses require a large sample of older subjects. To our knowledge, there have been no studies of TOJs with tactile stimuli with older subjects (60 years and older). There has been one study in which tactile TOJs were measured as a function of age (Laasonen et al., 2002). In that study, both normal and dyslexic readers were tested. For the normal reading groups, the youngest group (n 5 15) showed temporal order thresholds of somewhat greater than 100 msec for judging which of two fingers was stimulated first. For the oldest group (ages 50–59 years, n 5 8), thresholds were greater than 250 msec. Although not specifically concerned with TOJs, a study of temporal masking and aging produced results relevant to the issue of temporal order. Cholewiak and Collins (1993) presented pairs of spatial patterns to a group of older subjects (n 5 5) and a group of younger subjects (n 5 5). The subjects were instructed to identify either the first or second pattern. The time between the onset of the target and masker was varied. In this study, the pattern that was used as a masker could, on other trials, be the target pattern. Thus, subjects could err by mistakenly responding with the masker pattern, an error that might be the result of an error in TOJs. As the time between the target pattern and masker decreased, the subjects made an increasing number of these errors, identifying the masker rather than the target. Consistent with the view that temporal acuity declines with age, the older subjects made more of these errors than the younger subjects. In another study involving temporal judgments and age, Poliakoff, Ashworth, Lowe, and Spence (2006) conducted a multimodal study in which subjects judged which came first, a visual or a tactile stimulus. In this task, the older subjects had thresholds of 131 msec. The younger subjects had significantly shorter thresholds (98 msec). In a fourth study (Axelrod, Thompson, & Cohen, 1968), subjects judged when two electrocutaneous stimuli felt successive. Consistent with the general view of reduced temporal acuity with age, the threshold for successiveness was greater for the older subjects than for the younger subjects. There have been several studies in which TOJs have been measured in younger, typically college-age, subjects. Most frequently, the focus of these studies has been on the accuracy of reporting which of two locations on the skin was stimulated first (e.g., Hirsh & Sherrick, 1961; Marks et al., 1982; Sherrick, 1970; Shore, Gray, Spry, & Spence, 2005; Shore, Spry, & Spence, 2002). In a few studies, subjects were required to judge the order of stimuli presented to the same or different locations on the basis of the nature of the stimuli rather than the location (Craig & Xu, 1990; Yuan, Reed, & Durlach, 2005). In the present study, measurements were made both of subjects’ ability to judge which of two locations was stimulated first and also the order in which patterns were presented.
In conducting these measurements, we adopted testing procedures to reduce nonsensory factors that might lead to poorer performance in the older subjects, factors such as unfamiliarity and/or lack of comfort with laboratory testing procedures. We went to some lengths to ensure that the subjects felt comfortable with the testing procedures. The subjects were brought back for repeated testing for a number of sessions. By the time the older subjects had finished testing in the present study, they had participated in a total of approximately 30–35 h of screening and laboratory measurements, including similar measures in other modalities. Not only were the subjects tested over repeated sessions, but they were also tested several times on the same task. Stevens, Cruz, Marks, and Lakatos (1998) found that repeating psychophysical measures reduced the variance often found when testing older subjects. Also, to reduce problems associated with older subjects adopting more conservative response criteria in sensory tasks (Potash & Jones, 1977; Rees & Botwinick, 1971), we used an identification procedure with a fixed set of responses. There were four different temporal order tasks in the present study. Three of these involved judging the temporal order of tactile patterns. In the fourth, the subjects judged which of two locations had been stimulated first. We had the subjects judge the order of patterns for several reasons. First, as was noted, in haptic exploration, it may be important to know the order in which features are encountered by the hand. Second, the requirement that subjects be able to both identify the patterns and judge the order in which they were delivered likely increases the cognitive complexity of the task, which, in turn, may reveal greater differences due to age. Results from earlier studies indicate that the localization task is less demanding: The thresholds for this task (Sherrick, 1970) are considerably shorter than the thresholds for patterns when, in the latter case, subjects had to both identify the patterns and report them in the correct temporal order (Craig & Xu, 1990). In addition, one of the tasks in the present study required the subjects to correctly report the order of four patterns, adding an additional cognitive load. We expected temporal thresholds to be greater for older subjects than for younger subjects. To the extent that there is a slowing in cognitive processing with age, the more cognitively challenging tasks should show an even greater difference with age. In the present study, we had several aims. The first, and most important, was to collect a set of temporal measures on a substantial sample of older subjects. To our knowledge, such measures have not been made. Sensory studies with older subjects have often shown large variability across subjects, making it more important to have a large sample size. Second, because of the general perception that cognitive processing slows with age, one might expect that judging the order in which two patterns were presented would show greater changes with age than has been seen in the few previous studies in which subjects had to make less cognitively demanding judgments. We could compare the results from the presumably less cognitivedemanding tasks (TOJ of localization) with more demanding tasks (TOJ for the identification of sequences of two and four patterns). Third, with a substantial number of
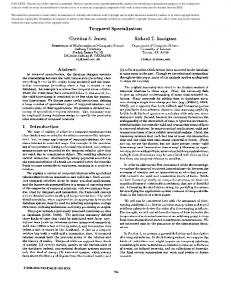
228 Craig, Rhodes, Busey, Kewley-Port, and Humes older subjects, we could see what factors might be correlated with differences in TOJs, such as differences in vibratory sensitivity or memory. Frequently, in studies of aging, a single measure of performance may be made, and from this measure, generalizations may be made concerning some capability. Having multiple measures involving temporal processing should indicate the extent to which such a generalization about temporal processing is justified. It will be possible to see the extent to which the measures are correlated with one another and provide an indication of whether common processes underlie the various measures. Method Subjects Prior to participating in the measures of tactile sensitivity reported here, the subjects passed visual, auditory, and cognitive screening tests. These tests consisted of measures of visual acuity, auditory thresholds, and the WAIS III, among others. The younger group consisted of 28 adults (19 female, 9 male) with a mean age of 23.5 years (range 5 18–30 years). The older group consisted of a total of 93 adults (55 female, 38 male) with a mean age of 69.8 years (range 5 60–88 years). Apparatus The patterned stimuli for the temporal order task were generated on a pair of tactile displays similar to that found in the Optacon, a reading aid for the blind (Telesensory Systems, Palo Alto, CA). Each display consisted of an array of six columns and 24 rows of pins. The pins were driven by pulses at a rate of 230 pps. Each display was 11 3 27 mm and fit against the distal portion of the finger pad. The intensity of the vibratory stimuli was controlled by the voltage applied to piezoelectric benders that drove the pins. The presentation and timing of the stimuli were controlled by a PC (Craig, 1980). Stimuli Four patterns were generated on the tactile array. A previous study (Cholewiak & Collins, 1993) and our preliminary work showed that some older subjects would have difficulty identifying tactile patterns. For that reason, we generated a set of patterns that were fairly distinctive (Figure 1). Pattern 1 consisted of 18 pins oriented proximally/distally on the finger pad; Pattern 2 consisted of 18 pins
1
2
oriented laterally/medially in the center of the distal finger pad; Pattern 3 consisted of activating the top 10 rows and all six columns of the display; and Pattern 4 consisted of activating the bottom 10 rows and all six columns. The patterns were presented at a moderate intensity for 26 msec. The voltage to the left display was set at 45 V. The voltage to the right display was set to an intensity (36 V) that would generate patterns judged to be approximately equal in perceived intensity to the left display. The intensity levels were the same for all of the subjects. Procedure As was noted, the subjects completed several types of testing prior to the present study, including the WAIS III. One of the subscales of the WAIS measured digit span, a measure of working memory. Also, vibratory thresholds were measured on the distal finger pad of the left index finger. Thresholds were measured for two vibratory signals, 500 msec in duration, one at a low frequency (30 Hz) and one at a high frequency (250 Hz) (see Humes et al., 2009, for more details). Both high- and low-frequency vibration sensitivity was measured, because the device used to generate the patterns operates at a frequency of 230 pps (see below) and stimulates both low- and high-frequency first-order afferents (Gardner & Palmer, 1989). All of the subjects received training in identifying the four patterns. During training, the patterns were presented one at a time, and the subjects were told in advance which pattern was to be presented. The subjects received three trials with each pattern. Next, and still part of the training phase, the subjects were tested in 20-trial blocks in which they attempted to identify the patterns one at a time. Training was stopped and data collection begun if the subjects performed at the 90% correct level. The subjects received training on both the left and right index fingers. We wanted to include as many of the older subjects in as much of the data collection as possible: If an older subject did not achieve the 90% level after approximately four blocks, we noted it but proceeded to the test phase. As is noted below, if the subjects were unable to achieve performance levels on the identification tasks above 50% at the longest stimulus onset asynchronies (SOAs), their data were excluded from analysis. The testing phase consisted of four sets of temporal order measurements. Because one of the goals of the project was to compare performance across tasks and eventually across three modalities, all of the subjects were tested in the same order. The first TOJ task required the subjects to correctly identify, in order, two patterns presented to the same location, their left index finger pads (2-ID.S). In this task, the subjects had to identify the two patterns selected from the set of four and correctly report their order. There were 12 possible
3
Figure 1. Representations of the four tactile patterns.
4
Aging and Tactile Temporal Order 229 pairs; chance performance was at 8%. For the second measurement, the subjects had to identify four patterns in order, again presented to the left index finger pad (4-ID.S). For this task, there were 96 possible orderings of the patterns; chance performance was at 1%. For the remaining two tasks, the stimuli were presented bilaterally, to the left and right index finger pads. The third set of measurements were similar to the first set, in that the subjects had to correctly identify the two patterns in order, but in this case, one pattern was presented to the left index finger and one to the right index finger (bilaterally; 2-ID.B); chance performance was at 8%. The final set of measurements was similar to the third set. The stimuli were presented in exactly the same way, but in this task, the subjects had to simply identify which location—which finger—received the pattern first (2-Loc.B); chance performance was at 50%. Although an order effect could not be entirely ruled out, we kept the stimulus conditions the same for the 2-ID.B and 2-Loc.B tasks so that differences in threshold could be more readily attributed to the difference in task— that is, temporal order for location versus identification. Threshold values for the 2-ID.S, 4-ID.S, and 2-ID.B tasks were set at 50% correct. For the 2-Loc.B task, threshold was set at 75% correct. For all four sets of measurements, the same pattern was never presented twice in a row. For the 4-ID.S task, there was one additional constraint: No pair of patterns was repeated. For example, no trial such as Pattern 1, Pattern 2, Pattern 1, Pattern 2 was allowed. The subjects were tested individually. The subjects responded orally with a number (1–4) that corresponded to one of the four patterns, and the experimenter entered their responses via keyboard. The subjects were informed by means of a computer screen whether they were correct, and the correct order was displayed. One of the older subjects preferred not to receive trial-by-trial feedback, and the screen was turned off. To complete the four sets of measurements required approximately 12 h for the older subjects and 7 h for the younger subjects; however, as was noted, the subjects had been screened and tested in related tasks, and the total testing time was between 30 and 35 h. The method of constant stimuli was used. It became obvious, however, that the same set of SOAs could not be used for all of the subjects. The difference in SOAs required to achieve even above-chance performance between the younger and older subjects was quite large. Also, there were large differences among the older subjects. Because of these differences, a different set of six SOAs was generated for each subject. Two preliminary measurements were made in order to determine the range of SOAs to be tested for each subject and to ensure that differences in threshold were not due to range effects. We tested a wide range of SOAs for each subject, such that performance extended below and above predicted thresholds. The longest SOAs for the younger subjects overlapped with the shortest SOAs for the older subjects. From these two wide-range measurements, we estimated a threshold value, the 50% SOA for the three identification tasks, and the 75% SOA for the bilateral localization task. This estimated threshold value in milliseconds was multiplied by 0.33, 0.57, 0.80, 1.25, 1.75, and 3.0 to generate the six SOAs used in testing. On each trial, one SOA was selected pseudorandomly from among the six SOAs. With the exception of the 4-ID.S task, a total of 72 trials, 12 at each SOA, constituted a single experimental run. For the 4-ID.S task, there were 16 trials at each SOA, a total of 96 trials for a single run. There were three runs per subject for each of the four sets of measurements. The subjects wore earphones through which white noise was presented to eliminate auditory cues. Some of the subjects also used earplugs in addition to the white noise.
Results The results were analyzed first to examine the overall differences between young and older subjects. Next, we computed correlations between the tasks to see the extent to which thresholds on the four tasks were related, and finally, we analyzed the data to examine factors that might affect the performance of the older subjects.
Table 1 Numbers of Subjects Included and Excluded From the Four Temporal Order Tasks Older Younger Task Included Excluded Included Excluded 2-ID.S 69 24 28 0 4-ID.S 61 32 28 0 2-ID.B 63 30 26 2 2-LOC.B 93 0 28 0 Note—2-ID.S, two-pattern identification on a single finger; 4-ID.S, fourpattern identification on a single finger; 2-ID.B, two-pattern bilateral identification; 2-LOC.B, two-location bilateral.
Overall Differences Between Groups Some subjects, particularly older subjects, had difficulty in identifying the patterns. If the subjects could not identify the patterns with a reasonable degree of accuracy, they would be unable to perform any of the three temporal order tasks that required the sequence of patterns to be identified. Each subject’s data were examined to determine whether their performance exceeded chance levels, particularly at the longest SOAs. Table 1 shows the number of subjects tested in each task and the number excluded. For the 2-Loc.B task, if the subjects had difficulty feeling the patterns with the right index finger, we tried presenting patterns to the right middle finger. Two subjects were able to do the task with their middle finger. For each subject, the data from the three separate runs were combined and a Weibull function with two free parameters corresponding to the threshold and slope was fit to these values. From this function, a threshold value was computed. Both mean and median thresholds were computed for each measure. The mean values were larger than the median values and, in some cases, were considerably larger, because of the extremely long values from some of the older subjects. For this reason, the median values are reported in Table 2. As was noted, 50% correct was used as the estimate of threshold for the 2-ID.S, 4-ID.S, and 2-ID.B tasks, and 75% correct was used as the estimate for the 2-Loc.B task. For the data presented in Table 2, the data from the subjects who did not consistently exceed 50% or better performance at the longer SOAs were excluded. Also shown are 75% correct values for the 2ID.S and 2-ID.B tasks; the reasons for showing these values are explained below. For all four tasks, the older subjects required considerably greater temporal separations between patterns to Table 2 Median Threshold Values for the Four Temporal Order Tasks for Older and Younger Subjects Older Younger 50% 75% 50% 75% Task Threshold Threshold Threshold Threshold 2-ID.S 288 991 55 205 4-ID.S 998 445 2-ID.B 50 676 9 54 2-LOC.B 44 14 Note—2-ID.S, two-pattern identification on a single finger; 4-ID.S, fourpattern identification on a single finger; 2-ID.B, two-pattern bilateral identification; 2-LOC.B, two-location bilateral.
230 Craig, Rhodes, Busey, Kewley-Port, and Humes perform at the same level as the younger subjects. Depending on the task, the older subjects’ average thresholds were two to more than five times the thresholds for the younger subjects, with differences as great as 500 msec or more. For all of the tasks, the older subjects’ thresholds were significantly longer than the younger subjects’ thresholds (Mann–Whitney U test; 2-ID.S, Z 5 6.32, p , .0001; 4-ID.S, Z 5 6.33, p , .0001; 2ID.B, Z 5 5.95, p , .0001; 2-Loc.B, Z 5 5.61, p , .0001). The threshold values for the 2-ID.B task with the younger subjects appeared to be very short (9 msec). As was noted, we used 50% correct as the threshold value for this task; however, if the subjects could correctly identify the two patterns, they would simply have to guess as to the order. In that case, chance would be 50% correct. This appeared to be the case for many of the younger subjects. For that reason, and because 75% correct has been used in previous studies of temporal order with patterned stimuli (Craig & Xu, 1990), we also calculated 75% thresholds for the 2-ID.B condition (see Table 2). Again, the older subjects showed significantly longer SOAs (Z 5 6.04, p , .001). Similarly, for the 2ID.S condition, the 75% thresholds
50 Y mean O1 O2 O3 O mean
0
100
2-ID.S
10
100
1,000
Percentage Correct
Percentage Correct
100
were significantly longer for the older subjects (Z 5 5.84, p , .001). For the purposes of illustration, the data were analyzed in another way. We averaged the data for the older and younger groups separately as follows: We calculated the average SOA for the briefest time at which the younger subjects were tested, then the next briefest time, and so forth, to determine the six average SOAs at which the younger subjects were tested. To determine the average percentage correct achieved at each SOA, we averaged the percentages correct for each subject at his or her individual SOA (the SOA used to determine the average SOA). At each SOA, we calculated the average percent correct achieved at that SOA. Similarly, the SOAs and percentages correct were averaged for the older subjects. The two functions for each of the four tasks (solid lines), one for the younger subjects and one for the older subjects, are shown in the four panels in Figure 2. If the subjects were unable to complete three runs, the data from two runs were used. This occurred less than 1.0% of the time. A comparison of the functions for the older and younger subjects’ data shows that the two functions tend to parallel
4-ID.S
50 Y mean O1 O2 O3 O mean
0 100
10,000
1,000
SOA (msec)
SOA (msec) 100
100
2-ID.B
50 Y mean O1 O2 O3 O mean
0
2-LOC.B
Percentage Correct
Percentage Correct
10,000
75 Y mean O1 O2 O3 O mean
50 1
10
100
SOA (msec)
1,000
10,000
1
10
100
1,000
SOA (msec)
Figure 2. Percentage correct as a function of log stimulus onset asynchrony (SOA) for the four temporal order tasks. The solid lines show the mean performance for the older (O mean) and younger (Y mean) subjects. The three dashed lines in each panel represent the performance from the older subjects divided into three groups: Those subjects who performed the best (i.e., required the shortest SOAs; O1), those in the middle group (O2), and those who required the longest SOAs (O3). 2-ID.S, two-pattern identification on a single finger; 4-ID.S, four-pattern identification on a single finger; 2-ID.B, two-pattern bilateral identification; 2-LOC.B, two-location bilateral.
Aging and Tactile Temporal Order 231 one another, with the possible exception of the 4-ID.S task at the longer SOAs. Also, in Figure 2, we wanted to give some indication of the variability among the group of older subjects. To do this, the data for each set of measurements for the older subjects were divided into thirds: the third of the subjects with the highest thresholds (O3), the third with the lowest thresholds (O1), and the third in the middle (O2). In general, studies of sensory functioning with older subjects have shown considerable variability among subjects. In addition, in studies of tactile sensitivity, small numbers of subjects have been tested. Each of the functions in Figure 2 represents the results from 20–30 subjects. The separation among the three functions provides an indication of the variability of performance on these tasks and, moreover, serves as a reminder that studies in which small samples of subjects are used may produce results that are atypical of the group as a whole. Correlations Among Measures Next, correlations were computed between the thresholds on the various tasks. As was noted in the introduction, correlations across wide age ranges may lead to misleadingly large correlations. In the present study, we calculated correlations only within the same age group. For these correlations, outliers whose thresholds were more than 3 SDs above the mean were excluded. One or 2 subjects were excluded from each of the correlations. Table 3 shows these correlations separately for the younger and older subjects. If these tasks are tapping a common mechanism, relatively high correlations between tasks are expected. Looking first at the correlations for the older subjects, there are modest but significant correlations among the three identification tasks but no significant correlations with the localization task. This pattern of results suggests that the TOJs on the identification tasks might be affected by other abilities, such as the ability to identify the tactile patterns. This possibility is considered in more detail in a subsequent section. The younger subjects show a different pattern of correlations: a high correlation between the 2-ID.S and the 4-ID.S tasks, but no significant correlations with the 2-ID.B task (although the small number of younger subjects may have contributed to this lack of significance) and several significant correlations between the localization task and the identification task. This latter finding—quite different from the older subjects’ results—may indicate some differences in the nature of the limitations or factors that affect Table 3 Pearson r Correlation Coefficients Among the Four Temporal Order Tasks Older Younger Task 2-ID.S 4-ID.S 2-ID.B 2-ID.S 4-ID.S 2-ID.B 4-ID.S .43* – .81* – 2-ID.B .48* .41* – .34 .36 – 2-LOC.B .12 .12 .04 .31 .58* .54* Note—2-ID.S, two-pattern identification on a single finger; 4-ID.S, fourpattern identification on a single finger; 2-ID.B, two-pattern bilateral identification; 2-LOC.B two-location bilateral. *p , .05.
performance between older and younger subjects. Some of these factors are examined in the next section. Other Factors Affecting Temporal Processing Finally, the data were analyzed to examine what factors, other than changes in temporal processing, might have affected the large decline in TOJs with the older subjects. One possible factor is response bias. If the older subjects showed large response biases, especially relative to the younger subjects, this might significantly reduce their performance. The patterns of responses for the three identification tasks were analyzed separately for the older and younger subjects. There were no notable differences between the older and younger subjects in the frequency with which the various pattern orders were given as responses. In short, response bias does not appear to contribute to the differences between older and younger subjects’ TOJs. The largest absolute difference between the older and younger subjects was observed in the 4-ID.S task. In this task, short-term memory might have affected performance. The subjects might have been able to correctly perceive the order of the four patterns but unable to correctly recall them in order. To see the extent to which memory might have played a role, we made use of a section of the WAIS III—the digit-span test—which all of the subjects completed as part of their initial screening. In the digit-span task, subjects have to recall lists of digits in order, both forward and backward. We correlated the older subjects’ scores on this measure with their thresholds on each of the four tasks. There was no significant correlation with the 4-ID.S task [r(58) 5 2.20, p . .05; a negative correlation indicates a greater number of items remembered and shorter SOAs] and no correlation with the other two tasks involving pattern identification [2-ID.S, r(66) 5 2.20, p . .05; 2-ID.B, r(60) 5 2.24, p . .05]. Somewhat surprisingly, there was a significant correlation with the 2-Loc.B task [r(90) 5 2.32, p , .01]. It seemed odd that the one task that did not require the subjects to remember the patterns should be the one correlated with a measure of short-term memory. A closer analysis of the data revealed the likely reason for this. As is shown in Table 1, the largest number of older adults (n 5 93) were able to complete the 2-Loc.B task. With the other three tasks, approximately 30% of the 93 older subjects were unable to do one or more of the tasks. We looked specifically at the 32 subjects (Table 1) unable to do the 4-ID.S task. Their correlation of the 2-Loc.B task and WAIS III memory scale was r(30) 5 2.401 ( p , .05), whereas the correlation for the remaining 60 subjects (after removing 1 outlier) was r(60) 5 2.16 ( p . .05. Also, the scores on the digit-span task were lower for the group of subjects unable to do the 4-ID.S task than for the larger group of subjects [t(90) 5 2.88, p , .01]. It appears that the main reason for a significant correlation between memory and the 2-Loc.B task was the inclusion of a number of subjects who indeed had some problems with short-term memory and difficulty with this task. In turn, this suggests that one reason that the 32 subjects were unable to do the 4-ID.S task was the difficulty that they had with memory; however, for the subjects who
232 Craig, Rhodes, Busey, Kewley-Port, and Humes completed this task, there was no significant correlation with short-term memory. As was noted, the four temporal order tasks were run in the same order for all of the subjects. With such a procedure, there is a concern that the subjects’ experience on one task will affect—likely improve—their performance on subsequent tasks, making it difficult to compare threshold levels across tasks. We analyzed the data to see whether there was obvious evidence of such training effects. For each subject, thresholds were measured on each task three times. If experience were producing improvements in thresholds, one might expect to see it within the testing on the same task: better performance on the third threshold measurement than on the first. We compared overall thresholds on the first and third measurements for the four tasks for both the older and the younger subjects. There were no significant differences between the two measurements for any of the eight comparisons (all ps . .05)—thus, no evidence of training effects. Because training effects cannot be entirely ruled out, caution should be observed in making comparisons between these tasks. It is possible that part of the difficulty that the older subjects had in judging the temporal order of patterns may have been due to poor absolute sensitivity and difficulty in feeling the patterns. A number of studies have shown a decline in tactile sensitivity with age. Of particular importance in the present study is the decline in vibratory sensitivity (Verrillo, 1993). Absolute thresholds for both low-frequency vibration (less than 80 Hz) and highfrequency vibration increase with age. All of the subjects could feel the patterns, but it might be that for some of the older subjects, the patterns were so close to threshold that elements of the patterns might not be felt. To see the effect that reduced vibratory sensitivity might have on the older subjects’ TOJs, we examined the correlations between vibratory thresholds at 30 and at 250 Hz and thresholds on each of the four tasks for both the younger and the older subjects. As Table 4 shows, none of the 16 correlations was significant (all ps . .05): With respect to the differences in the reported TOJ thresholds and for all the subjects who completed these tasks, whether an older subject had relatively good or relatively poor vibratory sensitivity appeared to have no effect on their TOJs. A slightly different picture emerges with regard to vibratory sensitivity when we look at those subjects who
Table 4 Pearson r Correlation Coefficients Among the Vibratory Thresholds at 30 and 250 Hz and the Thresholds From the Four Temporal Order Tasks Older Younger 30-Hz 250-Hz 30-Hz 250-Hz Task Threshold Threshold Threshold Threshold 2-ID.S 2.13 2.16 .09 .01 4-ID.S 2.13 2.07 .11 .05 2-ID.B 2.10 .07 2.02 2.02 2-LOC.B .17 .19 .16 2.03 Note—2-ID.S, two-pattern identification on a single finger; 4-ID.S, fourpattern identification on a single finger; 2-ID.B, two-pattern bilateral identification; 2-LOC.B, two-location bilateral.
Table 5 Pearson r Correlation Coefficients Between Pattern Identification Performance and Performance on the Four Temporal Order Tasks for Older Subjects 2-ID.S 4-ID.S 2-ID.B 2-LOC.B ID-Perf 2.35* 2.21 2.34* 2.30* Note—ID-Perf, pattern identification performance; 2-ID.S, two-pattern identification on a single finger; 4-ID.S, four-pattern identification on a single finger; 2-ID.B, two-pattern bilateral identification; 2-LOC.B, two-location bilateral. *p , .05.
were unable to do the 4-ID.S task. For the group of 32 subjects who were unable to do this task, it was not possible to correlate their thresholds on that task with their vibratory sensitivity. What we could do is to compare their vibratory sensitivity with the sensitivity of the 60 subjects who were able to complete the task. The thresholds for the 32 subjects unable to do the 4-ID.S task were 3 dB higher at 30 Hz and 4 dB higher at 250 Hz than the thresholds for the 60 subjects who could do this task (for the 30 subjects at 30 Hz, 21.4 dB, and at 250 Hz, 24.3 dB, as compared with the thresholds for the 60 subjects of 18.4 dB at 30 Hz and 28.3 dB at 250 Hz; all values re 1 micron peak). These differences, although small, are significant [at 30 Hz, t(91) 5 2.4, p , .05; at 250 Hz, t(91) 5 2.7, p , .01]. Thus, poorer vibratory sensitivity may contribute to these subjects’ inability to do the four-item TOJ task, although it appears not to be a factor for the subjects who were able to do the task. However, there was considerable overlap in vibratory sensitivity between the two groups of subjects. One could not point to a particular threshold value that would establish whether a subject could do the 4-ID.S task. The older subjects showed considerable variability in their ability to identify the tactile patterns, as was revealed in their performance on the initial training prior to temporal order testing. From these training results, we calculated the mean identification threshold from the left and right index fingers for each subject and then determined the correlation between this measure and the older subjects’ thresholds on the four tasks (Table 5; negative correlations indicate shorter SOAs and higher identification performance). Moderate but significant correlations were seen for three of the four tasks, including the 2-Loc.B task, which did not require the subjects to identify the patterns. With this latter task, we suspected that this correlation was due to the same factors that we saw with the 2-Loc.B task and memory: the addition of subjects who were unable to do some of the other identification tasks but were able to do the localization task. Again, the data from the 32 subjects who were unable to do the 4-ID.S task were analyzed separately from the remaining 60 subjects. The average percentage correct in the training phase for these 32 subjects who could not do the 4-ID.S task was 67%, as compared with 84% correct for the 60 subjects who could do this task [t(90) 5 7.1, p , .001]. Finally, the data were also analyzed to determine whether there were any major differences between the younger and older subjects in the identifiability of patterns by temporal position. For example, did the older
Aging and Tactile Temporal Order 233 subjects have greater difficulty than the younger subjects in identifying patterns in the first position? We calculated the percentage correct performance for items in first position and in second position for the 2-ID.S and 2-ID.B tasks and in Positions 1– 4 for the 4-ID.S task. No differences were seen between the younger and older subjects in this analysis. General Discussion We expected that, as a group, the older subjects would show a decline in temporal processing relative to the younger subjects. The size of the difference in thresholds between the younger and older subjects was, however, surprising. To match the performance of the younger subjects, the older subjects required two to more than five times the temporal separation required by the younger subjects. The absolute differences ranged from tens to hundreds of milliseconds. These large differences might be expected to affect other judgments involving tactile stimulation and to have substantial consequences. In object recognition, for example, keeping track of the order in which features are received might be difficult for older subjects, particularly if there were time constraints. Kleinman and Brodzinsky (1978) tested subjects in a haptic matching task. They reported that older subjects were less accurate and used less relevant search strategies than did younger subjects. Ballesteros and Reales (2004) found that older and younger subjects performed a haptic matching task with approximately equal accuracy; however, the older subjects took more than a second longer. Norman et al. (2006) also found that older subjects performed as well as younger subjects in a haptic-to-haptic matching task; however, older subjects performed significantly worse in a haptic-to-visual matching task when time constraints were imposed. In the specific haptic-to-haptic matching task in which the older subjects performed as well as the younger subjects, 3 sec was allowed to explore the objects. It may be that to match these objects, the temporal order in which features were encountered was not particularly relevant or that 3 sec was long enough that time was not a limitation for the older subjects. We also expected that the older subjects would show a good deal of variability, and they did. This variability underscores the need for large samples of older subjects. In tactile research, sample sizes of 5–12 are typical. As Figure 2 shows, such sample sizes might lead to very different estimates for the performance of older subjects. Somewhat unexpected was the fact that correlations were relatively small among the identification tasks with the older subjects. Also unexpected was the lack of significant correlations with the localization task. These correlations serve as a reminder to avoid overgeneralizing from any single measure of performance. Had we just completed the 2-Loc.B task, we might have concluded that a particular subject showed poor temporal acuity. With the results from just the 2-ID.S task, we might have concluded that the same subject showed relatively good temporal acuity. The lack of correlation between vibra-
tory sensitivity and any of the TOJ measures also serves to caution conclusions based on a single measure that a particular subject shows good or poor tactile sensitivity. As was noted, several explanations have been offered for the decline with age in temporal processing: the common cause hypothesis, temporal slowing, and sensory persistence. The common cause hypothesis attributes cognitive and sensory changes to widespread systematic changes with age. In the present study, performance by the older subjects relative to that of the younger subjects was poorer in all four tasks and poorer in the measures of vibratory sensitivity (Humes et al., 2009), a result that is consistent with the common cause hypothesis. The pattern of results within the older group of subjects, however, is inconsistent with the hypothesis, such as the lack of a correlation between some of the tasks (Table 3). The clearest inconsistency is the lack of any correlation between the vibratory sensitivity measures and performance on any of the TOJ tasks; the common cause hypothesis would predict that the subjects who showed poor vibratory sensitivity would show poor temporal sensitivity as well. If cognitive slowing were the primary reason for the difference between the older and younger subjects, there would not necessarily be a significant correlation between vibratory sensitivity and TOJs. One would expect significant correlations between the temporal order tasks for older subjects. As Table 3 shows, there were significant correlations between the three identification tasks but not between those tasks and the localization task. Also, greater declines for the more cognitively demanding tasks might be seen if cognitive slowing were a major factor. The 4-ID.S task provided the greatest cognitive load, as is evidenced by the very long SOAs at threshold, and it was in this task that the greatest absolute difference between the older and younger subjects (553 msec) was seen. On the other hand, other, less demanding tasks showed greater relative declines for the older subjects. On balance, support for cognitive slowing as the explanation for the decline in performance across the various tasks is modest at best. In addition to cognitive slowing, stimulus persistence might play some role in the decline in temporal acuity seen in the older subjects. Stimulus persistence would be a factor in processing patterns presented to the same location, which might be reflected in temporal masking. To the extent that the representation of a stimulus lasts beyond the stimulus offset, it could interfere with the perception of subsequent stimuli. The greater temporal separation required by the older subjects to achieve the same threshold levels as did the younger subjects might be due in part to overcoming greater amounts of temporal masking. There should be very little of this type of interference with the 2-ID.B task (as is discussed below). The most relevant comparison is between the 2-ID.B task and the 2-ID.S task, where persistence should be in evidence. A comparison of the 50% thresholds (Table 2) shows a much larger absolute difference between younger and older subjects for the 2-ID.S (233-msec) than for the 2-ID.B (41-msec) task. The relative differences are comparable; the older
234 Craig, Rhodes, Busey, Kewley-Port, and Humes subjects’ thresholds were 5.2 times larger than the younger subjects’ thresholds for the 2-ID.S task. The comparable value for the 2-ID.B task was 5.6. Using the 75% thresholds, the absolute difference between the younger and older subjects was somewhat greater for the 2-ID.S task (786 msec) than for the 2-ID.B task (622 msec); however, the relative difference is smaller for the 2-ID.S task (4.8 times larger) than for the 2-ID.B task (12.5 times larger). Persistence may play some role in these TOJs, but it is unlikely to be the sole reason for the difference between the older and younger subjects’ thresholds on these tasks. A major issue is the extent to which the large differences between the older and younger subjects are due to changes in temporal processing (including persistence) rather than to other factors. Several lines of evidence indicate that other factors may affect the older subjects’ thresholds. Chief among these may be difficulties in identifying the patterns. There is clear evidence that as a group, the older subjects had more difficulty identifying the patterns than did the younger subjects. For example, in the initial training phase on pattern identification, the older subjects took more blocks of trials to reach criterion and had overall lower scores than the younger subjects. From Figure 2, one can see that even at the longest SOAs, the older subjects’ percentage correct did not rise to the same level as the younger subjects’. The exception to this was on the 2-Loc.B task (Figure 2, bottom right panel). In this task, the only task that did not involve pattern identification, the older and younger subjects reached similar levels of performance, approximately 90% correct, at the longest SOAs. The fact that the longest temporal separation does not result in performance as good as that achieved by the younger subjects in the three identification tasks is another indication that performance by the older subjects may be limited by difficulty in identifying the patterns. There are, however, several observations that indicate that threshold values for the older subjects who were able to complete the TOJ tasks are not limited simply by an inability to identify the patterns. First, because SOAs were adjusted to produce the same level of performance in judging temporal order, one might expect that pattern identification thresholds would be nearly identical for the older and younger subjects. As was noted, an analysis of the data by temporal position showed this to be the case: The older subjects identified the patterns as accurately as did the younger subjects. Thus, the differences in threshold values between the younger and older subjects were determined with both groups performing at the same level of pattern identification. Second, for all four tasks, performance increased with SOA for both the younger and the older subjects, as would be expected in any temporal order task. However, temporal masking, which would interfere with pattern identification, would also result in performance improvements with greater temporal separation. If older subjects do show greater temporal masking than do the younger subjects, this might have affected the two tasks in which the patterns were presented to the same location; there is, however, considerably less bilateral than same-site masking (Craig, 1985a, 1985b;
Sherrick, 1970). One would not expect masking to play much of a role in the bilateral tasks; yet, the relatively larger difference between the older and younger subjects’ thresholds remains (Table 2). Separate measures of temporal masking would be necessary to determine the extent to which masking contributed to the differences between the older and younger subjects observed in these temporal order tasks. In addition to pattern identifiability, there is the question of whether other factors might have affected thresholds, such as memory or tactile sensitivity. The answer here seems to be both yes and no. A number of the subjects were unable to do one or more of the identification tasks, and these subjects appear to have poorer working memory, to be less sensitive to vibratory stimuli, and to have greater difficulty in identifying the patterns. To this extent the answer is yes, having a relatively low score on these factors is associated with being unable to do the temporal order identification tasks at all. For those subjects who were able to do the tasks, however, there were no significant correlations between their thresholds and measures of memory, vibratory sensitivity, and pattern identifiability. It should also be noted that the scores on the memory test, the threshold values for vibratory sensitivity, and the pattern identification scores all show overlap between the group of subjects able to do the TOJ tasks and those unable to do the tasks. Author Note The authors thank Dana Kinney, Shamim Razawi, and Christopher Clark for their assistance with this project. The support of several students—undergraduate and graduate—working in the laboratories involved in this study is also acknowledged. We also thank the subjects for giving so generously of their time for this study and subsequent phases of the larger project. Finally, this work was supported in part by NIA R01 AG022334 and by NIDCD R01 DC00095. Correspondence concerning this article should be addressed to J. C. Craig, Department of Psychological and Brain Sciences, Indiana University, 1101 E. 10th St., Bloomington, IN 47405-7007 (e-mail:
[email protected]). References Axelrod, S., Thompson, L. W., & Cohen, L. D. (1968). Effects of senescence on the temporal resolution of somesthetic stimuli presented to one hand or both. Journal of Gerontology, 23, 191-195. Ballesteros, S., & Reales, J. M. (2004). Intact haptic priming in normal aging and Alzheimer’s disease: Evidence for dissociable memory systems. Neuropsychologia, 42, 1063-1070. Botwinick, J. (1978). Aging and behavior (2nd ed.). New York: Springer. Cholewiak, R. W., & Collins, A. A. (1993). A comparison of complex vibrotactile pattern perception on the OPTACON by young and old observers. Journal of the Acoustical Society of America, 93, 2361. Craig, J. C. (1980). Modes of vibrotactile pattern generation. Journal of Experimental Psychology: Human Perception & Performance, 6, 151-166. Craig, J. C. (1985a). Attending to two fingers: Two hands are better than one. Perception & Psychophysics, 38, 496-511. Craig, J. C. (1985b). Tactile pattern perception and its perturbations. Journal of the Acoustical Society of America, 77, 238-246. Craig, J. C., & Xu, B. H. (1990). Temporal order and tactile patterns. Perception & Psychophysics, 47, 22-34. Evans, P. M. (1987). Vibrotactile masking: Temporal integration, persistence, and strengths of representations. Perception & Psychophysics, 42, 515-525. Gardner, E. P., & Palmer, C. I. (1989). Simulation of motion on the
Aging and Tactile Temporal Order 235 skin. I. Receptive fields and temporal frequency coding by cutaneous mechanoreceptors of OPTACON pulses delivered to the hand. Journal of Neurophysiology, 62, 1410-1436. Gescheider, G. A., Valetutti, A. A., Jr., Padula, M. C., & Verrillo, R. T. (1992). Vibrotactile forward masking as a function of age. Journal of the Acoustical Society of America, 91, 1690-1696. Hirsh, I. J., & Sherrick, C. E., Jr. (1961). Perceived order in different sense modalities. Journal of Experimental Psychology, 62, 423-432. Hofer, S.M., Berg, S., & Era, P. (2003). Evaluating the interdependence of aging-related changes in visual and auditory acuity, balance, and cognitive functioning. Psychology & Aging, 18, 285-305. Hofer, S. M., Flaherty, B. P., & Hoffman, L. (2006). Cross-sectional analysis of time-dependent data: Problems of mean-induced association in age-heterogeneous samples and an alternative method based on sequential narrow age-cohorts. Multivariate Behavioral Research, 41, 165-187. Humes, L. E., Busey, T. A., Craig, J. C., & Kewley-Port, D. (2009). The effects of age on sensory thresholds and temporal gap detection in hearing, vision, and touch. Attention, Perception, & Psychophysics, 71, 860-871. Kleinman, J. M., Brodzinsky, D. M. (1978). Haptic exploration in young, middle-aged, and elderly adults. Journal of Gerontology, 33, 521-527. Laasonen, M., Lahti-Nuuttila, P., & Virsu, V. (2002). Developmentally impaired processing speed decreases more than normally with age. NeuroReport, 13, 1111-1113. Marks, L. E., Girvin, J. P., O’Keefe, M. D., Ning, P., Quest, D. O., Antunes, J. L., & Dobelle, W. H. (1982). Electrocutaneous stimulation: 3. The perception of temporal order. Perception & Psychophysics, 32, 537-541. Norman, J. F., Crabtree, C. E., Norman, H. F., Moncrief, B. K., Hermann, M., & Kapley, N. (2006). Aging and the visual, haptic, and cross-modal perception of natural object shape. Perception, 35, 1383-1395.
Poliakoff, E., Ashworth, S., Lowe, C., & Spence, C. (2006). Vision and touch in ageing: Cross-modal selective attention and visuotactile spatial interactions. Neuropyschologia, 44, 507-517. Potash, M., & Jones, B. (1977). Aging and decision criteria for the detection of tones in noise. Journal of Gerontology, 32, 436-440. Rees, J. N., & Botwinick, J. (1971). Detection and decision factors in auditory behavior of the elderly. Journal of Gerontology, 26, 133-136. Salthouse, T. A. (1985). A theory of cognitive aging. New York: NorthHolland. Sherrick, C. E. (1970). Temporal ordering of events in haptic space. IEEE Transactions on Man–Machine Systems, MMS-11, 25-28. Shore, D. I., Gray, K., Spry, E., & Spence, C. (2005). Spatial modulation of tactile temporal-order judgments. Perception, 34, 1251-1262. Shore, D. I., Spry, E., & Spence, C. (2002). Confusing the mind by crossing the hands. Cognitive Brain Research, 14, 153-163. Stevens, J. C., & Cruz, L. A. (1996). Spatial acuity of touch: Ubiquitous decline with aging revealed by repeated threshold testing. Somatosensory & Motor Research, 13, 1-10. Stevens. J. C., Cruz, L. A., Marks, L. E., & Lakatos, S. (1998). A multimodal assessment of sensory thresholds in aging. Journals of Gerontology, 53B, P263-P272. Van Doren, C. L., Gescheider, G. A., & Verrillo, R. T. (1990). Vibrotactile temporal gap detection as a function of age. Journal of the Acoustical Society of America, 87, 2201-2206. Verrillo, R. T. (1993). The effects of aging on the sense of touch. In R. T. Verrillo (Ed.), Sensory research: Multimodal perspectives (pp. 285-298). Hillsdale, NJ: Erlbaum. Yuan, H. F., Reed, C. M., & Durlach, N. I. (2005). Temporal onsetorder discrimination through the tactual sense. Journal of the Acoustical Society of America, 117, 3139-3148. (Manuscript received December 12, 2008; revision accepted for publication July 24, 2009.)