1580
J. Opt. Soc. Am. A / Vol. 24, No. 6 / June 2007
Hom et al.
AIDA: an adaptive image deconvolution algorithm with application to multi-frame and three-dimensional data Erik F. Y. Hom* Graduate Group in Biophysics and Department of Biochemistry and Biophysics, University of California, San Francisco, Genentech Hall, 600 16th Street, San Francisco, California 94143-2240, USA
Franck Marchis Department of Astronomy, University of California, Berkeley, 601 Campbell Hall, Berkeley, California 94720, USA
Timothy K. Lee and Sebastian Haase Department of Biochemistry and Biophysics, University of California, San Francisco, Genentech Hall, 600 16th Street, San Francisco, California 94143-2240, USA
David A. Agard Howard Hughes Medical Institute and Department of Biochemistry and Biophysics, University of California, San Francisco, Genentech Hall, 600 16th Street, San Francisco, California 94143-2240, USA
John W. Sedat† Department of Biochemistry and Biophysics, University of California, San Francisco, Genentech Hall, 600 16th Street, San Francisco, California 94143-2240, USA Received June 6, 2006; revised October 19, 2006; accepted December 7, 2006; posted January 2, 2007 (Doc. ID 71624); published May 9, 2007 We describe an adaptive image deconvolution algorithm (AIDA) for myopic deconvolution of multi-frame and three-dimensional data acquired through astronomical and microscopic imaging. AIDA is a reimplementation and extension of the MISTRAL method developed by Mugnier and co-workers and shown to yield object reconstructions with excellent edge preservation and photometric precision [J. Opt. Soc. Am. A 21, 1841 (2004)]. Written in Numerical Python with calls to a robust constrained conjugate gradient method, AIDA has significantly improved run times over the original MISTRAL implementation. Included in AIDA is a scheme to automatically balance maximum-likelihood estimation and object regularization, which significantly decreases the amount of time and effort needed to generate satisfactory reconstructions. We validated AIDA using synthetic data spanning a broad range of signal-to-noise ratios and image types and demonstrated the algorithm to be effective for experimental data from adaptive optics–equipped telescope systems and wide-field microscopy. © 2007 Optical Society of America OCIS codes: 100.1830, 100.3020, 100.3190, 010.1080, 180.0180, 180.6900.
1. INTRODUCTION Images acquired using any optical system are fundamentally limited in resolution by diffraction and corrupted by measurement noise. Aberrations intrinsic to the optical system and imaging medium result in further degradation and distortions of the observed images. In groundbased astronomical imaging, atmospheric turbulence is the primary source of aberrations. In microscopic and biological imaging, significant aberrations arise as a result of index-of-refraction inhomogeneities within the sample under study. Aberration artifacts can be largely corrected using adaptive optics (AO) methods.1 Limited by the spatial and/or temporal response of AO hardware, however, such corrections remain imperfect. AO-corrected images are of1084-7529/07/061580-21/$15.00
ten contaminated by residual blurring that can significantly reduce the contrast of fine image details. Significant denoising and improved image contrast can be obtained using post-acquisition deconvolution techniques,2 implying that both hardware and software correction strategies are needed for optimal image recovery. Deconvolution is an explicit attempt to model and computationally compensate for measurement nonidealities. Classic approaches presume that the imaging pointspread function (PSF) of the optical system is exactly known. In practice, however, the PSF is estimated either theoretically3,4 or by imaging a subresolution pointlike object (e.g., guide star or fluorescent bead).5,6 Such estimates may deviate significantly from the true PSF, yet no margin is given in classical methods for the PSF to adjust © 2007 Optical Society of America
Hom et al.
Vol. 24, No. 6 / June 2007 / J. Opt. Soc. Am. A
to a more appropriate estimate. Using a fixed, imperfect PSF thus inherently limits one’s ability to generate the most accurate and highest-resolution object reconstructions. Myopic or blind deconvolution approaches allow an imprecise or unknown PSF estimate to adapt to a more correct form and thereby offer the possibility of improved object reconstructions over classical methods. The success of these myopic–blind methods, however, is dependent upon a priori constraints that compensate for the lack of information associated with having the PSF be variable.7–11 In this paper, we describe an adaptive image deconvolution algorithm (AIDA) for myopic deconvolution of twodimensional (2D) and three-dimensional (3D) image data within a maximum a posteriori framework. AIDA is a de novo implementation and extension of the MISTRAL (Myopic Iterative STep-preserving Restoration ALgorithm) method, originally developed by Mugnier and co-workers12 to effectively deconvolve a broad range of astronomical targets with superior photometric restoration and sharp-edge feature preservation. We have significantly improved AIDA’s run-time performance over the original MISTRAL implementation and have developed a simple yet effective scheme to balance maximumlikelihood estimation with object regularization in the deconvolution process. Moreover, AIDA has capabilities to process multiple image frames simultaneously, thereby leveraging the information available through multiple observations.2,11 In Section 2, we present the deconvolution approach. In Section 3, we describe how AIDA was implemented and describe our automatic regularization scheme. In Section 4, we demonstrate AIDA’s effectiveness on both synthetic and experimental single-frame data. In Sections 5–7, we present the application of AIDA to multiple-image-frame data and 3D images. We conclude with a survey of possible algorithmic improvements and applications, offering AIDA as an open-source alternative to MISTRAL for further development.
2. ADAPTIVE DECONVOLUTION APPROACH A. Imaging Model Consider an image, i!r", of an object, o!r", observed through a telescope or microscope system and measured using a CCD detector array. This image may be viewed as a probabilistic mapping of the object’s brightness distribution to an intensity count distribution sampled over the discrete pixel/voxel position, r : o!r" ! i!r". Assuming that (i) image formation is linear and space invariant (isoplanatic approximation), (ii) the response of each CCD pixel element is equivalent and independent of all others, and (iii) signal-independent Gaussian and signaldependent Poisson noise sources are present,13 the image formed can be described by the following equation: !1" where h!r" is the PSF, g!r" denotes the noise-free image, n˘G!r" is a Gaussian random variable characterized by variance !2G, and n˘P!r" represents a stochastic Poisson
1581
process with variance !2P # g!r". The operator, ! , denotes a convolution, and " denotes a pixel-by-pixel operation. While the response of CCD pixel elements is rarely uniform in practice, we will assume that any nonuniformity can be accounted for through image flat fielding with negligible effect on the validity of Eq. (1). Moreover, we assume that if any constant image background is present, it can be subtracted from i!r" so that n˘G!r" is zero centered. When both Gaussian and Poisson noise sources are present and images are not photon-limited, a nonstationary but additive weighted-Gaussian noise model with variance 2 w!r" $ !n2˘ !r"!r" = !G + !P2 !r"
!2"
is a very good approximation.12,14 With this noise model, the operator " in Eq. (1) may be replaced by simple addition, and Eq. (1) may also be expressed as ˘ !k", I!k" = O!k"H!k" + N
!3"
where capitalization denotes the Fourier transform of the variable, H!k" is the optical transfer function (OTF), and k is the conjugate spatial frequency. For brevity, the dependence on r and k will often be implicit hereafter. B. Bayesian Deconvolution Framework The goal of deconvolution is to invert Eq. (1). Classical deconvolution approaches aim to find the best estimate, oˆ, of the true object given a single image frame, i, and an exactly known PSF convolution kernel, h. Such approaches are ill-posed (lacking a unique solution, or having a solution that is discontinuous with respect to the data) and illconditioned (numerically sensitive to small errors and thus unstable) for two reasons: (1) h is intrinsically bandlimited by the resolution limit of the optical system, and (2) noise is present at frequencies beyond the band limit.8,15 This situation is further complicated in the case of myopic or blind deconvolution where the characteristics of the PSF kernel are poorly known, if at all. Because of ill-posedness, the quality of the deconvolution depends critically on the quantity and quality of a priori information that is incorporated into the inversion process.8,16 This a priori information can be divided into three classes related to n˘, o, and h. Owing to the presence of noise, deconvolution may be viewed as a problem of stochastic inversion. It is helpful to state the goal of deconvolution in Bayesian terms, namely, to maximize the a posteriori probability of observing the object, o, and PSF, h, given an image, i, and a set of model assumptions, a, p!o,h%i,a" =
p!i%o,h,a"p!o%a"p!h%a" p!i%a"
.
!4"
p!i % o , h , a" is the posterior probability density of observing an image, i, as expressed by the forward-imaging equation, Eq. (1). This term is the focus of maximumlikelihood methods, which aim to optimize the fidelity of the observed data to a set of parameters and subject to a particular noise model. p!o % a" , p!h % a", and p!i % a" are the a priori probability distributions for the object, PSF, and image, respectively. These a priori distributions must be
1582
J. Opt. Soc. Am. A / Vol. 24, No. 6 / June 2007
Hom et al.
inferred based on the assumptions, a. In classical deconvolution methods for which the PSF is known, for example, p!h % a" is assumed to be a constant. In maximumentropy deconvolution methods, p!o % a" is set implicitly by the definition of the entropy measure used.17 When the positivity of the variables o , h, and i can be assumed (e.g., under incoherent imaging conditions), the a priori probabilities for negative values can be set to zero. Each probability term in Eq. (4) may be interpreted as a Gibbs distribution with an energy cost function, J!x", and partition function, Z!x" = &x exp'−J!x"(dx,18,19 !5"
p!x" = exp'− J!x"(/Z!x", so that p!o,h%i,a" = exp'− J!o,h%i,a"(/Z = !Zi/ZnZoZhZ"exp'− Jn!i%o,h,a" − Jo!o%a" − Jh!h%a" + Ji!i%a"(,
!6"
where we have used the subscripts n to denote noisemodel-related data fidelity terms, o to denote the terms arising from the a priori object distribution, h to denote the terms arising from the a priori assumptions for the PSF, and i to denote the terms arising from the a priori distribution of images. The mode or best estimate for both o and h can be found by maximizing Eq. (6) with respect to these variables or, equivalently, by minimizing the corresponding negative log-likelihood, J!o , h % i , a", 'oˆ,hˆ(Z = arg min)J!o,h%i,a"* = arg min)Jn!i%o,h,a" + Jo!o%a" + Jh!h%a"*. 'oˆ,hˆ(Z
!7"
Since Ji!i % a" is formally independent of variables o and h given the set of assumptions a, we have dropped this term in Eq. (7). We have also dropped the constant term involving the ratio of partition functions, which embodies information on the relative normalization of the component probability distributions [cf. Eq. (6)]; we use the subscript Z to serve as a reminder of this. C. Myopic Deconvolution with Edge Preservation Our goal is to minimize Eq. (7) subject to a specific set of model assumptions for Jn!i % o , h , a", Jo!o % a", and Jh!h % a". We follow the recommendations of Mugnier et al.12 in assigning functional forms to each of these component terms as detailed below. 1. Data Fidelity Term: Jn!i % o , h , a" Assuming the mixed-Gaussian noise model of Eq. (2), the fidelity of the reconstructed object oˆ and PSF hˆ with respect to the observed image i can be described by the following weighted maximum-likelihood term: Jn!i%o,h,a" =
2
+ r
2. Edge-Preserving Object Term: Jo!o % a" Equation (8) may also be regularized through a quadratic penalty term based on an object’s spatial gradient.15,16 Quadratic regularization, however, often yields results that are oversmoothed and have compromised image contrast when applied uniformly to all object features. Using a roughness penalty that is instead subquadratic for regions of high contrast has been very successful in preserving edges and other sharp object features.15,20–22 The underlying assumption here is that large gradient discontinuities in the image arise from genuine object features and should be penalized comparatively less than small gradients due to noisy background features. We use the isotropic edge-preserving prior proposed by Mugnier et al.,12 which is based on the work of Brette and Idier23: Jo!o%a" = "o
!i!r" − oˆ!r" ! hˆ!r""2 w!r"
.
!8"
Deconvolution approaches that are based solely on this term often lead to noise amplification and severe ringing artifacts. The Landweber method and the Richardson–
+ #!$!oˆ, % "", r
!9"
#!$" = $ − ln!1 + $",
!10"
$!oˆ, %r" =
'oˆ,hˆ(Z
1
Lucy or expectation-maximization algorithm are examples of such approaches, which assume a stationaryGaussian and Poisson noise model for w!r", respectively.8,17 To minimize noise amplification artifacts and find a unique and stable solution in practice, Eq. (8) must be regularized. In the aforementioned methods, regularization is accomplished empirically by limiting the number of deconvolution iterations.
r
,
- !o ˆ !r" -
%r
.
,
!11"
where -!oˆ!r" - = '!!xoˆ!r""2 + !!yoˆ!r""2 + !!zoˆ!r""2(1/2 is the norm of the spatial gradient of the object, %r and "o are auxiliary parameters or hyperparameters of the object prior distribution, $ is a reduced gradient modulus, and #!$" is called the clique potential. #!$" is a function that characterizes the local object texture at a position r based on a subset or clique of neighboring pixels. This clique is defined in practice through the calculation of the gradient norm in Eq. (11). For large values of $ , #!$" # $, whereas for small values of $ , #!$" = $ − !$ − $2 / 2 + ¯ " # $2 / 2, resulting in so-called L1–L2 (linear–quadratic) behavior. Numerous L1–L2 regularization functionals have been suggested in the literature (e.g, see Teboul et al.22). The advantage of Eq. (10) over other forms is that it is convex and its derivative with respect to oˆ does not involve any transcendental or exponential functions, making cost function optimization easier and less expensive (see Subsection 3.C). The scaling parameter "o plays an important role in balancing maximum-likelihood fidelity to the data, with the preservation of high-contrast features in the object estimate. The hyperparameter, %r, sets the width and shape of the Gibbs distribution in Eq. (5). It governs the point at which regularization transitions from being quadratic to being linear. In Mugnier et al.’s treatment,12 the same scalar pair of values !"o , %" is applied to each pixel element of the object. We have found that using an inhomogeneous hyperparameter model as advocated by others,24–27 in which %r is pixel/voxel dependent (as indi-
Hom et al.
Vol. 24, No. 6 / June 2007 / J. Opt. Soc. Am. A
1583
cated by the subscript) and adapted to the local object texture, results in better deconvolution results. !14"
3. Harmonic OTF Constraint: Jh!h % a" To myopically reconstruct the PSF, the following Fourier domain constraint is used:
Jh!h%a" =
"H 2
+ k
ˆ !k" − H ¯ !k"%2 %H v!k"
,
!12"
where "H controls the degree of the OTF regularization ˆ !k" constraint relative to the data fidelity term [Eq. (8)], H is the true estimate of the OTF, H!k" is a measured OTF, and the overbar denotes an average over l measured OTF samples. v!k" is the OTF sampling variance or power spectral density defined as v!k" =
/%Hl!k" − H¯ !k"%20l = /%Hl!k"%20l − %H¯ !k"%2 .
!13"
v!k" serves as a spring constant to harmonically constrain each OTF k component to a mean value, consistent with a set of measured OTFs. Equation (12) intrinsically handles band-limitedness of the OTF; frequencies beyond the optical system’s resolution are essentially ignored, since they are not represented in the measured samples. Conan and co-workers28,29 have shown that this harmonic OTF constraint performs noticeably better toward recovering the true OTF than a simple band-limited constraint typically used in blind deconvolution methods.7,30 An harmonic constraint for each spatial frequency, %k%, which is functionally equivalent to using a radially averaged v!k", may be used, although we have found that using the less stringent constraint, Eq. (12), is sometimes more robust. D. Extension to Multiple-Frame Data The focus thus far has been on a single image frame. One of our goals in developing AIDA was to combine the demonstrated strengths of MISTRAL with the multiple-frame synthesis capabilities available in a method such as IDAC, the Iterative Deconvolution Algorithm in C.2,30,31 Christou et al.31 have argued that the use of multiple observations can serve as an additional deconvolution constraint: the ratio of unknown variables to measured quantities being reduced from 2:1 for a single image frame to !M + 1" : M for M image frame observations. The simultaneous analysis of multiple observations implicitly accounts for correlations that may exist among variables as well as between variables and the data.32 Consequently, multiple-frame deconvolution should result in systematically lower error bounds with more reliable results than when individual image frames are deconvolved separately or when multiple frames are merged into an averaged “shift-and-added” image (i.e., an image generated by averaging the image frames after appropriate pixel shifts are made to maximize image correlation) and then deconvolved.2,11,33–36 The extension to multi-frame deconvolution is straightforward. For multiple-image observations, Eq. (1) may be expressed generally in vector form:
where !¨ specifies a convolution performed over appropriate oj : hj pairs and we have assumed the noise model of Eq. (2). In general, for Mi measured images, there may be Mo unique objects and Mh unique PSFs: Mo & Mi ' Mh. In addition to mono-frame data sets where Mi = Mo = Mh = 1, we consider two multi-frame data-set types in this work: (i) multi-PSF data sets where Mi = Mh and Mo = 1 and (ii) multi-object data sets where Mi = Mo and Mh = 1. MultiPSF deconvolution may be used to process AO images for which there is a common target object but a variable PSF per image observation. Multi-object deconvolution may be used to process time-lapsed microscopy images for which a single common PSF does not change significantly between frames. The cost function to be minimized for multi-PSF deconvolution is given by
JM_PSF!o,h%i,a" =
1 2 1 Mh
2
+( +
+ " h(
+
!i( − oˆ ! hˆ("2 w(
r
ˆ −H ¯ %2 %H ( v
k
34
+ "o
+ #!$!oˆ, % "" r
r
!15" and for multi-object deconvolution by
12, Mo
JM_object!o,h%i,a" =
+) + r
!i) − oˆ) ! hˆ"2 2w)
+ "o)#!$!oˆ), %r,)""
.34
+
"h 2
+ k
ˆ −H ˆ %2 %H v
,
!16" where ) and ( are used to index multiple objects and PSFs, respectively.
3. IMPLEMENTATION STRATEGY A. Algorithmic Overview We implemented AIDA using Numerical Python–Numarray,37 with calls to a specialized C + + conjugate gradient (CG) optimizer (see Subsection 3.B), which were handled by code generated using the Simplified Wrapper and Interface Generator38,39 (SWIG). Fast Fourier transforms were computed using the FFTW (version 2.1.5) subroutine library40 (see also http:// www.fftw.org) in lieu of the standard Numarray FFTPACK library, resulting in about a factor of 2 improvement in the overall speed of the algorithm. A schematic of the algorithm is shown in Fig. 1.
1584
J. Opt. Soc. Am. A / Vol. 24, No. 6 / June 2007
AIDA begins with a preprocessing stage to estimate data fidelity weights, w (see below, Subsection 3.C), and ¯ , and OTF variance, v. It is to calculate the mean OTF, H
assumed that all the images supplied have been properly flat fielded and optionally background subtracted. In cases where the image does not have negative pixels following background subtraction (as is the case for an image without true dark areas), the user must supply either a value for !G or a dark image from which it can be estimated. The present version of AIDA expects images of reference PSFs (e.g., of a guide star or subdiffraction-sized ¯ bead), which are normalized to 1 and used to compute H
and v. If only one PSF image is supplied, v is calculated based on the noise statistics of the image as for w. AIDA is equipped with an optional clean-up module to remove hot–dark pixels from these PSF images and remove noise according to some user-defined threshold. An option to use a radially averaged OTF variance is provided to enable a more stringent harmonic constraint of spatial frequencies (see Subsection 2.C.3). The default mode for AIDA uses automatic hyperparameter settings as described below in Subsection 3.D. The option to directly specify hyperparameter values or a
Hom et al.
scale factor by which to multiply the automatic estimates is available for fine-tuning purposes. For mono-frame deconvolutions, AIDA is also capable of performing unsupervised deconvolutions over a grid of "o and %r hyperparameter values centered about automatic estimates or userdefined centers. Although it is possible to simultaneously estimate both ˆ , by stacking them into a sets of objects, oˆ, and PSFs, h single variable to be optimized [see Eq. (7)], doing so could result in slower convergence, since significant differences ˆ can result in a skewed opin magnitude between oˆ and h timization landscape and ill-conditioning.41 Although variable renormalization could solve this issue, we have chosen instead to alternate between the minimization of oˆ ˆ in the current version of AIDA, as advocated by and h Mugnier et al.12 For nonquadratic cost functions, solution convergence can often be improved by periodically restarting the CG minimization after a defined number of steps so as to interlace steepest-descent steps with CG steps. We have found this partial conjugate gradient (PCG) approach41 to be more effective than a simple CG approach in minimizing the quasi-quadratic cost functions Eqs. (15) and (16), consistent with the findings of Mugnier et al.12
Fig. 1. AIDA optimization protocol. A: Setup and variable initialization stage. Equation numbers for variables are shown in curly brackets. Mo and Mh are the number of objects and PSFs to be estimated, respectively. B: Deconvolution scheme. The subscript j indexes the optimization round, which consists of two partial conjugate gradient (PCG) estimation loops (each indicated by a dashed box): one for the ˆ . The deconvolution is stopped after a max_ optimization_ count number of sequential PCG object(s), oˆ, followed by one for the PSF(s), h estimation loops have converged (see below). C: Schematic of the PCG estimation loop used to estimate the object(s) or PSF(s) [indicated generically by the variable !xˆj"] for the jth optimization round. *p is an Mo- or Mh-length array of root-mean-square deviations between sequential PCG iterations used to monitor convergence progress. Minimization of each xˆj in xˆj is continued until *p falls below some PCG_ tolerance for a total of convergence_ count times or until a rising_ rmsd_ count number of uphill moves is registered (default= 3 for both). Each PCG iteration entails a steepest-descent minimization step followed by up to + − 1 conjugate gradient (CG) steps for the set of unconverged object or PSF estimates. When the fraction of object(s) or PSF(s) that have converged is ,-, the PCG estimation is stopped, and convergence for that PCG estimation loop is noted.
Hom et al.
ˆ set to the mean of the Starting with each PSF in h ¯ (", each object in oˆ is optimized via a sampled PSFs !F−1'H PCG approach. CG optimization is capped by a set number of iterations, + (typically 25), constituting a CG block and repeated for .o PCG iterations. The resulting estiˆ is optimized mate for oˆ is then fixed, and each PSF in h ˆ via . PCG iterations. The multi-frame estimates oˆ and h h
are alternatively optimized, with each pair of estimations constituting one AIDA optimization round. The number of ˆ is typiPCG iterations per optimization round for oˆ and h cally increased progressively, with the possibility of sepaˆ . By default, the rate PCG iteration plans for oˆ and h number of PCG iterations executed per optimization round is given by PCG'j( = 2!j − 1" + 1, where j is the optimization round, from 1 to /, the maximum default number of optimization rounds (typically 8). Progressively increasing the number of PCG iterations in this manner ensures that the optimization of the current variable (e.g., oˆ) does not get fixed too quickly relative to the other variˆ ), which may yet be suboptimal. Multi-frame able (e.g., h ˆ is continued until the fraction of optimization of oˆ and h ˆ individual oˆj and hj frame estimates that have converged is greater than some tolerance, - (typically ,0.9), or until a specified maximum number of optimization rounds is reached. The convergence of each oˆj or hˆj frame optimization is achieved when the root-mean-square deviation between two consecutive PCG iteration estimates falls below a specified tolerance for at least three times within one optimization round. We have found these default settings sufficient for processing most data sets; stricter convergence–stopping criteria typically do not yield significantly improved results. B. Constrained Conjugate Gradient Minimization AIDA’s quasi-quadratic cost function was minimized using a constrained CG algorithm developed by Goodman and co-workers42 and is freely available as part of the EDEN Holographic Method package.43,44 This algorithm incorporates three significant advances over the conventional CG method.45 First, to ensure that solutions are positive (or within a user-specified bound), a projected gradient or active sets approach is used.41 Johnston et al.46 have shown that such an approach is superior to maintaining solution positivity via reparametrization, since reparametrization often leads to the creation of spurious minima that can complicate the optimization process. Second, to prevent zig-zagging behavior that can arise when using an active sets approach or minimizing nonquadratic functions, an adaptive bending line search is used to set the most effective conjugate direction step size (typically called )). Third, to better preserve conjugacy between successive directions, the CG deflection parameter (typically called () is computed using the Hestenes–Stiefel formula instead of the standard Fletcher–Reeves or Polak–Ribiere formula.41 C. Cost Function and Derivative Calculations To facilitate modification and future developments of AIDA, the calculation of the cost function was written in an extensible manner in which cost function terms may
Vol. 24, No. 6 / June 2007 / J. Opt. Soc. Am. A
1585
be turned on or off. For computational efficiency, only terms that are dependent upon the variable being estimated are computed (e.g., for oˆj, data fidelity and object regularization terms, but not the OTF constraint, are computed). The data fidelity weights for each image frame, w!r" [see Eq. (8)], can be computed as a sum of Gaussian and Poissonian contributions according to Eq. (2) as proposed by Mugnier et al.12: !17"
The first term accounts for Gaussian detection–electronic readout noise, !2G, which can be estimated using the average over all negative pixels in the image. For images of extended objects that do not have any negative-pixel areas (common in microscopy), a separate dark image is required from which !2G can be computed directly. The second term in Eq. (17) accounts for Poisson photonic noise, !2P; this term is derived from the fact that the variance equals the mean and the mode for a Poisson distribution. Although this term should technically be determined using a noise-free image estimate, !2P = max'gˆ!r" , 0(, we did not observe a significant improvement in deconvolution quality to merit using this more accurate though algorithmically complicated approach. The estimates for the variances in Eq. (17) implicitly assume that i has been properly background subtracted so as to lead to a properly centered and sampled Gaussian distribution for readout noise. Only noise arising from the image formation is accounted for here. “Scientific noise” (e.g., cellular autofluorescence in microscopy imaging), which may be irrelevant to image features of scientific interest, are not accounted for here explicitly but treated as an optically genuine component of the object under observation. The clique potential [see Eq. (10)] used for edgepreserving object regularization requires that effective spatial gradients of the object estimate be computed. This can be done efficiently by convolving the object estimate with a gradient mask:
!roˆ!r" = oˆ!r" ! 0Gr ,
!18"
where Gr, is a 3 1 3 matrix operator corresponding to the gradient of interest in the direction r and 0 is a scaling normalization factor. Many different gradient masks that have been developed for image segmentation may be used.17,47 We prefer masks based on the work of Frei and Chen,48 since it is equally effective on horizontal, vertical, and diagonal edges, and we have found these operators to be more effective in recovering subtle object features than traditional nearest-neighbor finite-difference approximations (see, e.g., Press et al., Section 5.745). In two dimensions this is given by
1586
J. Opt. Soc. Am. A / Vol. 24, No. 6 / June 2007
Gx =
5
1
0
62
−1
1
7 5
− 62 ;
0 0
−1
Gy =
− 62
−1
0
0
0
1
62
1
−1
7
"J ,
" h(
=
!19"
5 5
Gx = !0",
5 5
Gy = !0",
Gz = + ·
55
0
62
0
1
0
−1
7 7
− 62 ,!0" ; −1
−1
− 62
−1
0
0
0
1
62
1
0
−1
0
− 62
0
−1
0
7 5
0 ,!0", 0 0
7 7
,!0" ;
0
1
0
62
0
1
0
0
77
,
where 0 = !2 + 62"−1 and 2 is a z-resolution compensation factor. In 3D microscopic imaging, the OTF support in the axial direction is significantly smaller than in the radial direction. This leads to a greater loss of information and thus increased blurring in the z direction relative to the x or y direction; 2 is used compensate for a more diffuse and uncertain gradient observed in the z direction of the image stack so that axial and lateral gradient information are on equal footing. Given the lateral and axial resolutions of a microscope, rxy and rz , 2 can be estimated as 2 8 rxy / rz. If we define optical resolution as the distance between the central maximum and the first minimum of the lateral or axial component of a PSF Airy disk, the lateral and axial resolutions of a microscope are given by rxy = 0.6"em / NA and rz = 2"emn / NA2, where "em is the wavelength of light, n is the index of refraction of the sample, and NA is the numerical aperture of the microscope objective lens.49 Thus, !21"
and, using values typical in microscopic imaging (n # 1.33, NA# 1.4), 2 # 3. Minimizing the AIDA cost function [Eq. (15) or (16)] with the CG method requires analytical derivatives with respect to both object and PSF estimates. These can be determined through functional differentiation50 and are given by
"J " o)
1 , NPSFs
=
+(
hˆ( !
oˆ) ! hˆ( − i( w(
.4 , +
" o)
!r2oˆ)
%r2
1 + $!oˆ), %r"
+)
+ " h(
oˆ) !
,
!Nd + 1" 2
oˆ) ! hˆ( − ia wa
F−1
2
.4
ˆ −H ¯" !H ( v
3
,
!r2oˆ = oˆ!r" ! 0L, !20"
2 8 3 . 33n/NA,
Nobjects
!23"
where ! denotes a correlation. In practice, the terms in curly brackets are computed in the Fourier domain, in accordance with the convolution- and correlation-Fourier theorems.45,51 We assume that the arrays (or region-ofinterest subarrays) used in Fourier calculations are sufficiently padded so that boundary aliasing problems can be ignored. In computing the derivative of the OTF constraint with respect to h [rightmost term in Eq. (23)], we have used the property of the discrete Fourier transform, F'x*( = NdF−1'x(, where x* is the conjugate of x. The spatial Laplacian of the object in Eq. (22) may be computed by convolving the spatial object gradient with a gradient mask [cf. Eq. (18)] as proposed by Mugnier et al.52 Alternatively, the object may be convolved directly with the following Laplacian operator mask, which we find to be faster and yield finer results:
and in three dimensions it is given by 1
1
Hom et al.
.
,
!22"
!24"
where in two dimensions
0=
1 12
,
5
−1
−2
−1
L= −2
− 12
−2
−1
−2
−1
7
!25"
and in three dimensions
0=
L=
55 5
1 16!1 + 2"
75 77
,
−1
−1
−1
−2
− 22
−1
− 22
−1 ,
− 22
16!1 + 2"
−1
−1
−1
−2
− 22
−1
−1
−1
−1
− 22
−1
−1
−1
−1
,
−2
7
− 22 , −2
!26"
where 2 once again compensates for the relative loss in resolution in the z versus xy directions (typically 83). D. Automatic Hyperparameter Estimation Methods to estimate the hyperparameters that tune object regularization terms such as Eq. (9) have been a subject of considerable attention.24–27,53–59 A number of approaches have been advocated including L-curve analysis and generalized cross validation.54,55 These heuristic methods are computationally expensive, essentially requiring that multiple deconvolutions be performed over a grid of "o values for each image to be processed. Other more advanced and theoretically rigorous approaches attempt to optimize hyperparameters jointly with object reconstruction.54,58,59 These methods aim to maximize the marginal likelihood of observing the measured image given an incomplete data set over the space of hyperpa-
Hom et al.
Vol. 24, No. 6 / June 2007 / J. Opt. Soc. Am. A
1587
Fig. 2. Subset of reference objects used to test AIDA and establish its automatic hyperparameter estimation scheme. Each object (with maximum intensity set to 100, 1000, or 10,000) was blurred with a Gaussian PSF (FWHM= 4 pixels), had intensity-based Poisson noise and Gaussian detector noise added according to Eq. (34) to yield a series of images with SNR= −10, −3, 0, 7, 10, 17, 20, or 27 dB.
rameters: !%ˆ r , "ˆ o" = arg max%r,"op!i % %r , "o"; this is functionally equivalent to maximizing the ratio of partition functions, Z / ZoZn [cf. Eq. (6)], with respect to the hyperparameter variables.27,59 In practice, these methods require nontrivial Monte Carlo expectation-maximization sampling steps prior to object reconstruction, which increases the computational expense of a deconvolution considerably.24,57 In contrast to all of these methods, our AIDA approach directly calculates hyperparameter estimates using a semiempirically-based scheme, forgoing any stochastic sampling steps or comprehensive grid searching. Our initial efforts to derive an automatic scheme were founded upon a large collection of deconvolution results generated over a grid of %r and "o values spanning several orders of magnitude. We used a variety of different 2D object types and natural scenes to build a reference set of images covering a broad range of signal-to-noise ratios. A subset of these reference objects is shown in Fig. 2. These reference images were used to assess deconvolution quality as a function of hyperparameter pairs. From a grid search over hyperparameters, a plane of acceptable !%r , "o" solutions (determined by visual inspection) was found to exist, in agreement with observations by Jalobeanu et al.26 This finding implies that one hyperparameter may be defined while the other hyperparameter is optimally adjusted to balance data fidelity with object regularization. Within the AIDA cost function framework for a single image frame, we found a balance can be achieved by setting %r according to
%r $ 6w!r"/!G
!27"
and computing "o directly via the approach detailed below. The form of %r was motivated by general trends observed in the aforementioned set of grid search results as well the desire for a simple scalar form for "o (see below). From Eqs. (8) and (9), the following partition functionlike integrals may be defined over the distribution of possible data-model variations, 3 $ i − o ! h, and the distribution of possible gradient norm values for each pixel element:
+n!r"!"3 $
9
3
exp'− !3r"2/2w!r"(d3 ,
!28"
+o!r"!"-!o- $
9
2 ,
exp − "o
- !o!r" -
,
− ln 1 +
- !o!r" -
%!r"
- !o!r" -
%!r"
..3
d- !o!r" - .
!29"
A convenient relation linking %r and "o can be obtained by equating these integrals:
+n!r"!"3 # +o!r"!"-!o- ,
62.w!r" = %re"
o
9
4
e−"ot/t−"odt.
1
# %r
, . 1
"o
+1 ,
!30"
where the approximation holds for "o 5 10. The elementby-element equivalence of these integrals essentially assumes that the behavior of each pixel/voxel element can be decoupled and that the Gibbs distribution (and thus partition function Z) of Eq. (5) can be represented as a product of separable functions (i.e., a mean-field approximation).59 Equating these integrals effectively defines the balance of maximum-likelihood estimation with edge-preserving regularization: it is achieved by properly normalizing the probability distributions for data fidelity and object gradient norms with respect to one another. In more rigorous marginal likelihood–based hyperparameter estimation approaches,24,54,57–59 partition functions over primitive model variable(s) (e.g., i or o) are used, which lead to nonanalytical equalities that require expectationmaximation sampling in order to be solved. Our scheme estimates the sum over all states using conglomerate variables instead [Eqs. (28) and (29)], leading to the approximate though analytical relation of Eq. (30). Solving for "o in expression (30): "o = !62.w!r"/%r − 1"−1 .
!31"
This definition, along with the vector definition of %r, Eq. (27), leads to a simple, pixel-independent scalar expression for "o:
1588
J. Opt. Soc. Am. A / Vol. 24, No. 6 / June 2007
"o = !62.!G − 1"−1 .
Hom et al.
!32"
From Eq. (17) and given the quantized nature of real, noisy data, !G is guaranteed to be '6. / 2 such that %r and "o are well defined by Eqs. (27) and (32). Using w!r" as defined in Eq. (17) and object gradients and Laplacians calculated according to expressions (18)–(26), this estimation scheme is quite robust for data with PSFs of compact spatial extent (effective FWHM 58 pixels). For imaging data with spatially extended or oversampled PSFs, the pixel-by-pixel integral equivalence approximation used in Eq. (30) breaks down and can lead to somewhat overregularized results. In such cases, scaling the single scalar hyperparameter estimate, "o, down by typically no more than a factor of 10–100 is sufficient to generate optimal reconstructions. It is important to note that careful estimates of !G and w!r" in accordance with Eq. (17) are important for the success of this estimation scheme. For the OTF constraint, a quadratic term in real space [Eq. (8)] must be balanced with a quadratic term in Fourier space [Eq. (12)]. Consistent with the fast Fourier transform40 normalization scheme used in our algorithm, we have found that this balance can be approximately achieved by setting "H = 1/Nd ,
!33"
where Nd, the number of pixel/voxel elements, is assumed. The heuristic motivation for this comes from the power conservation relation of Parseval’s theorem for disNd−1 % x!r"%2 crete Fourier, transforms, in which +r=0 Nd−1 2 ˜ = !1 / Nd"+k=0 % x!k"% .
4. VALIDATION AND APPLICATION TO MONO-FRAME DATA In Fig. 3, we present classical deconvolution results for one of our synthesized data sets to demonstrate the effectiveness of the automatic estimation scheme. The brain object !2561 256 pixels" shown in Fig. 3(A) is from a magnetic-resonance imaging (MRI) scan available from the Computer Vision Group at the University of Granada.60 This object was convolved with a Gaussian
PSF of FWHM of 4 pixels and normalized to a maximum intensity of 1000. This noise-free image, g!r", was subjected to a Poisson noise transformation. Varying amounts of Gaussian noise were subsequently added (mimicking CCD detector readout noise) according to a predetermined image signal-to-noise ratio (SNR), which we define as SNR $ 10 log10
var'g!r"( /w!r"0r
!34"
,
where var'g!r"( is the variance of the noise-free image.8 Significant denoising can be observed after deconvolution [Fig. 3(B)] with a contrast enhancement of about 50%. Average contrast improvement was computed by multiple !N ' 6" comparisons of average intensities over an area of 3 1 3 pixels within a region of interest !IROI" versus over an adjacent background region !Ibackground" (separated by at least 4 pixels, the FWHM of the PSF): *Contrast $
:
/IROI0area − /Ibackground0area /Ibackground0area
;
. N samples
!35" Using the definition *SNR $ 10 log10
-i
− o-
-o ˆ
− o-
,
!36"
we see signal-to-noise improvements of 6.2, 4.2, and 2.4 dB for the deconvolution results of SNR= 0, 10, and 20 dB images, respectively. Figure 4 shows the deconvolution results for the SNR = 20 dB image of Fig. 3 over a grid of "o or %r values that are 20 times larger or smaller than those automatically estimated. Using the estimated hyperparameters (Fig. 4, center) gave the best visual results and balance between data fidelity and regularization. Using the estimated "ˆ o and a value of %r = %ˆ r / 20 also gave acceptable results (though contrast was slightly compromised). In general, the deconvolution results were generally less sensitive to changes in %r than "o over the range of values examined.
Fig. 3. Classical deconvolution test results using automatic hyperparameter estimation. A: Deconvolution series for image SNR of 0, 10, and 20 dB; top, convolved image with Poisson and Gaussian noise !i"; bottom, corresponding deconvolution result !oˆ" and signal-to-noise improvement, *SNR [Eq. (36)]. B: Top, original 2561 256 pixel brain object with intensities from 0–1000 !o"; bottom, convolved noise-free image !g" with Gaussian PSF !h" inset (FWHM= 4 pixels).
Hom et al.
Vol. 24, No. 6 / June 2007 / J. Opt. Soc. Am. A
1589
Fig. 4. Automatic hyperparameter estimates are close to the optimum. Classical deconvolution results for the SNRI 6 20 dB brain image from Fig. 3, over a grid of "o and %r values that are 201 larger or smaller than those estimated automatically. Center: Deconvolution result using the automatically estimated hyperparameters. Signal-to-noise improvements are shown in the lower right of each panel.
Fig. 5. Myopic deconvolution results for a test phantom. A: The original phantom object, o. B: The convolved and noisy phantom image, i !SNR= 17 dB". C: Reconstructed object after classical deconvolution using the average of synthetically generated PSFs (see Fig. 6) !*SNR = 1.7 dB". D: Reconstructed object after myopic deconvolution with automatic hyperparameter estimates and the average PSF, ¯h,
as an initial PSF guess !*SNR = 2.9 dB". E: Same as D, except the hyperparameter, "o, is scaled to 1/2 of the value of the automatic estimate !*SNR = 4.2 dB". F: Reconstructed object after classical deconvolution using the true PSF [see Fig. 6(B)] with the same hyperparameter settings as in (E) !*SNR = 3.8 dB".
Although not shown, we note that AIDA’s hyperparameter estimation scheme works equally well for a range of maximum intensity scalings (i.e., images for which the maximum intensity of the noise-free image is 100 or 10,000). Deconvolution results were typically generated within 30– 90 s per !2561 256" image pixels on a 2.8 GHz Intel Xeon Linux machine. In Figs. 5 and 6, we demonstrate the capabilities of the
myopic deconvolution approach with a synthetic phantom composed of pointlike, line, and smooth extended elements. The object in Fig. 5(A) was convolved with a true PSF [Fig. 6(B), left] taken from a set of aberrated PSFs generated using pupil functions with random Zernike polynomial phase components of up to order 15 (Gaussian-distributed amplitudes with mean 6 0 and standard deviation= 0.1). The resulting noise-free image
1590
J. Opt. Soc. Am. A / Vol. 24, No. 6 / June 2007
Hom et al.
was normalized, and Poisson and Gaussian noise was added as described above for a combined image SNR of 17 dB [Fig. 5(B)]. Classical deconvolution of this image using a fixed av¯ " results in significant denoising and conerage PSF !h trast enhancement !*SNR = 1.7 dB", although artifacts can be seen in the reconstructed object [Fig. 5(C), bottom]. Allowing the PSF to relax through myopic deconvolution [Fig. 5(D)] helps to remove these artifacts and further improves image contrast !*SNR = 2.9 dB". Object recovery is not perfect, however, as highlighted in the bottom panel of Fig. 5(D): (1) dotlike features are larger than in the true object, and two out of the three dots shown are not fully resolved; (2) some residual haze surrounds the two inter-
Fig. 6. PSFs associated with the myopic deconvolution of the test phantom. A: Sample PSFs used to myopically deconvolve the test phantom data of Fig. 5. PSFs were generated as the modulus of the Fourier transfer of pupil functions with random Zernike polynomial phase components of up to order 15 (OSA convention; Gaussian-distributed amplitudes with mean= 0 and standard deviation= 0.1). Resulting PSFs have an average FWHM between 3 and 4 pixels. To simulate typical PSF measurements, Poisson and Gaussian noise was added for a PSF image SNR of 17 dB. B (from left to right): The true PSF, htrue, used to generate Fig. 5(B); the average PSF, ¯h, used as the initial guess in myopic deconvo-
lution; the myopically recovered PSF, hˆ, using a harmonic frequency constraint (Subsection 2.C.3); and the myopically recov, using a band-limited frequency constraint. ered PSF, hˆ
secting line elements, and the square-on-square feature is slightly compressed in the lateral direction. The diameter of the dots can be reduced, and the remaining haze around the line elements can be removed by scaling the estimated "ˆ o hyperparameter down by a factor of 2 (Fig. 5(E); *SNR = 4.2 dB). With slightly lower regularization, however, the square-on-square feature becomes less smooth, highlighting the intrinsic balance between noise suppression and edge preservation. For comparison, classical deconvolution results using the true PSF and the scaled "o hyperparameter value are shown in Fig. 5(F) !*SNR = 3.8 dB". The two lower dot features (separated peak to peak by 83 pixels) remain unresolvable, although this is consistent with the resolution limitations of the simulated PSFs (FWHM of 3–4 pixels). Stricter a priori constraints that assume pointlike objects may lead to improved separation of these features.29,61 Owing to imperfect noise suppression, the edges of the square-to-square feature are more jagged in the classical result versus myopic deconvolution result, in which the PSF is allowed to relax. The relaxation of the PSF also results in better noise suppression and fewer noise speckles in the myopic deconvolution result versus the classical result; this leads to an improved *SNR for the myopic result over the classical result. Artifactual lateral compression of the square features is not seen in the classical result as it is in the myopic result, however. Photometric comparisons with the true phantom object are shown in Table 1 for each of the highlighted features in Fig. 5. With the exception of dotlike features, myopic deconvolution using automatic hyperparameter estimates can recover intensity values to within 810%; this is only slightly improved by "o scaling. However, using the true PSF or scaling down "o can dramatically improve the photometric recovery over the dotlike features by 15%–30%. Displayed in Fig. 6(B) are the true PSF !htrue", the average PSF used as the initial guess in myopic deconvolu¯ ", the myopically recovered PSF using AIDA !hˆ", tion !h and the myopically recovered PSF using a band-limited OTF constraint !hˆband-limited". Myopic deconvolution using a simple band-limited constraint results in an expected delta-function-like solution for the recovered PSF. Myopic deconvolution using a harmonic frequency constraint based on sampled PSFs prevents a delta-function-like solution and leads to the recovery of the Airy ring around the core of the true PSF that is only faintly visible in the
band-limited
Table 1. Photometric Accuracy of the Highlighted Object Features in Fig. 5 after Classical and Myopic Deconvolutiona % Intensity of True Object, o Object
/dots0
squareinner
squareouter
lineoblique
linehorizontal
Image, i ¯" Classical decon !h Myopic decon (auto) Myopic decon !"ˆ / 2"
27.9 52.1
71.6 87.2
92.9 99.6
60.1 78.9
59.0 79.9
68.9 85.3
94.8 97.8
101.5 101.1
98.7 104.7
92.9 95.0
Classical decon !htrue , "ˆ o / 2"
98.0
93.3
100.6
97.9
97.6
o
a Category /dots0 was computed using the average intensity over a circular area with a radius characterized by half the peak dot intensity and is the average of the three dots shown in Fig. 5. Values for the square and line features were calculated using the median intensity over an area minimally enclosing the same feature in the true object, o.
Hom et al.
average PSF. Artifactual line elements of the object are also present in the recovered PSF, however. This leads to a more laterally extended PSF and gives rise to the slight compression observed for the myopically reconstructed object [Figs. 5(D) and 5(E)]. Given the highly variable bounds of the sampled PSFs [Fig. 6(A)], complete separation of object and PSF features in myopic deconvolution is unlikely without further constraints. Below, we demonstrate the effectiveness of AIDA in myopically deconvolving real imaging data for two astronomical targets, Io and Titan. A. Io Io is the innermost Galilean satellite of Jupiter with a diameter similar to Earth’s moon !83600 km" and is known to be volcanically active. To understand the origin of Io’s volcanism, its time evolution, and relationship to tidal heating, its volcanic activity needs to be monitored over a large time baseline. With the demise of the Galileo spacecraft that was in orbit around the Jovian system until
Vol. 24, No. 6 / June 2007 / J. Opt. Soc. Am. A
1591
2003, the monitoring of Io volcanism now lies in the hands of ground-based observers. When Io is closest to earth, its angular size is 81.2 arcsec, which is very close to the natural angular resolution (seeing) provided by ground-based telescopes. Because of its brightness (apparent visual magnitude, mv 8 5), Io is ideally suited for observation by adaptive optics (AO) systems. Volcanism on Io has been monitored regularly in the near infrared (NIR) between 1 and 5 7m by one of us (F. Marchis) using the Keck 10 m telescope AO system.62–64 The angular resolution provided by AO varies with the wavelength range of observations from 55 milli-arcsec (mas) in the Kc band (centered at 2.2 7m) to 100 mas in the Ms band !4.7 7m", corresponding, respectively, to 8170 and 8305 km on the surface of the satellite. Such spatial resolution is comparable with that of the Galileo observations of Io in the same wavelength range.65 Marchis and co-workers62,64 used MISTRAL to process the first high-resolution AO images of Io volcanic activity.
Fig. 7. Myopic deconvolution results for AO-corrected images of Io, a volcanically active moon of Jupiter. The PSF of the system was estimated using images of a star located near the target with the same visible magnitude. PSF variability [characterized by v in Eq. (13)] depends mainly on the brightness of the target, the quality of the atmospheric turbulence, and the wavelength range of observations. We estimated that FWHM variability of the PSFs from ten nights of observation to be 86% in the K band.64
1592
J. Opt. Soc. Am. A / Vol. 24, No. 6 / June 2007
Fig. 8. Reconstructed appearance of Io on January 26, 2003, at 07:38 UT observed from Earth. This image is based on Galileo solid state imaging and Voyager composite maps at a resolution of 20 km (courtesy of P. Descamps, Institute de Mécanique Céleste et des Calculs d’Éphémérides). Note that albedo features (e.g., calderas/craters) can also be seen on the deconvolved image (cf. Fig. 7).
We compared the performance of AIDA (with automatic hyperparameter estimation) with that of MISTRAL with a set of Io images acquired in 2003. The deconvolution results for three different broadband filter observations are shown in Fig. 7. Each basic-processed filtered image was a shift-and-added synthesis of five observations (85 min each; background subtracted and flat fielded). The improvement in image contrast after deconvolution is obvious. In the Kc band, the surface reflectance or albedo markings including dark paterae and bright frost areas are visible on the surface of Io. The general features of Io are in excellent agreement with those of Galileo/Voyager maps shown in Fig. 8. AIDA and MISTRAL deconvolution results are extremely similar, with a correlation coefficient of 99.4% when calculated over the area of the satellite. For a single, 5121 512 image, our AIDA implementation was 15–20 times faster than the original MISTRAL implementation (e.g., 825 min versus 87 h on a 1.8 GHz iMac G5 computer running Mac OS X 10.3). In practice, multiple MISTRAL deconvolutions must typically be performed to hone in on hyperparameter values that yield the best results. This is often a time-consuming and laborious process: between 10 and 20 MISTRAL deconvolution runs are usually necessary to locate an optimal !%r , "o" pair. Thus, the practical gain in processing time of AIDA compared with MISTRAL is ,100-fold. The image of Io in the Ms band is radically different than for the Kc band, being dominated by the localized thermal emission of the volcanoes. In the Lp band (intermediate wavelength, 83.8 7m), large-scale albedo features on the surface are visible as are the thermal emissions of the active centers. After deconvolution, several additional hot spots were revealed on the hemisphere of Io. Most of them can be found in the basic-processed image upon more careful scrutiny. The Lp band result generated with AIDA using automatic hyperparameters is
Hom et al.
noticeably different (more diffuse bright spot and some slight ringing) compared with that of MISTRAL, although these differences can be reduced by manually adjusting the hyperparameters (data not shown). The accurate recovery of image intensities from which the temperature and emission areas of these hot spots can be determined (e.g., assuming a blackbody emission law) is also of interest. Hot-spot flux was measured using aperture photometry on the deconvolved image, assuming that most of the flux is gathered in an area slightly larger than the angular resolution on the image.66 This is a good approximation for hot spots with a peak contrast lower than 20%, since the intensity of the first Airy ring is negligible compared with the variation of brightness on the surface. For the extremely bright hot spot (outburst) on the Ms band image, a prominent Airy ring remains after deconvolution. This residual artifact may be explained by the fact that the Keck PSF is hexagonal in shape67 and that its orientation changes with the position of the telescope; optimizing the rotation of the sampled PSFs (and thus the mean PSF to which the PSF estimate is constrained) would likely minimize this artifact. Since this problem would not significantly affect the scientific analysis of the image, we have not pursued this matter further. The hot spot can be seen on the basic-processed image with a very good SNR, and therefore its integrated intensity can be easily measured after comparison with the PSF. Overall, the deconvolution of Io images with AIDA provides excellent reconstructions, which can be used to analyze surface changes on Io and to detect the faintest active centers and quantify their intensities. B. Titan Titan, Saturn’s largest moon, was largely a mystery until very recently. Observations collected by the Voyager spacecraft in 198168 showed that Titan is obscured by a dense and opaque atmosphere consisting mainly of nitrogen. The surface of this 0 . 9! angular-sized satellite, however, can be probed in the NIR through methane windows using such high-resolution techniques as speckle imaging69 and AO.70 Recent AO observations of its atmosphere revealed the presence of clouds and a complex structure with seasonal variability. The NASA-ESA Cassini–Huygens probe in orbit within the Saturnian system and an intensive campaign of observations using AO systems available on the Keck 10 m telescope (Mauna Kea, Hawaii) and the ESO-8 m Very Large Telescope (Cerro Paranal, Chile) are in place to help understand this complex satellite. In Fig. 9(A), we show a ground-based observation of Titan taken on January 15, 2005, one day after the Huygens probe landed on its surface. Titan was observed with the Keck AO using the NIRC-2 camera with a pixel scale of 9.94 mas through a narrowband He filter !2.06± 0.03 7m". At this wavelength, the atmosphere is nearly transparent, and most of the structures visible on the image are larger than 330 km (corresponding to 55 mas). A remarkable gain in image contrast is obtained after AIDA deconvolution, as shown in Fig. 9(B). This imaged hemisphere contains the landing site of the Huygens probe and was regularly observed by the Cassini spacecraft [Figs. 9(C) and 9(D)]. The similarity between the Imaging Science
Hom et al.
Vol. 24, No. 6 / June 2007 / J. Opt. Soc. Am. A
1593
volve the set of images in a global fashion, linking common variables while maintaining the distinctiveness of each observation. Extending the MISTRAL approach to simultaneously deconvolve multiple image frames is another feature of AIDA. Below, we present deconvolution results for two different multi-frame data sets. The first consists of AO images of Uranus’s atmosphere and is used to demonstrate AIDA’s multi-PSF deconvolution capabilities, in which there is a common object but a variable PSF. The second data set consists of time-lapsed fluorescence microscopy images of yeast microtubule dynamics and is used to demonstrate AIDA’s multi-object mode, in which there is a common PSF but different objects between frames.
Fig. 9. Myopic deconvolution results for AO-corrected images of Titan, the largest moon of Saturn. A: Basic-processed image of Titan taken on January 15, 2005 (one day after the Cassini– Huygens probe landing), using the ground-based Keck AO system and a narrowband filter centered at 2.06 7m to probe surface albedo features.71 B: Keck AO image of Titan after myopic deconvolution with AIDA. C: Mosaic image of Titan based on 1.3 km resolution data taken in the infrared with the lmage Science Subsystem (ISS) instrument aboard the Cassini spacecraft (http://photojournal.jpl.nasa.gov/catalog/PIA06185). D: Falsecolor visible and infrared mosaic image of Titan taken by the ISS (http://photojournal.jpl.nasa.gov/catalog/PIA07965). Atmospheric features are shown in red and surface features in green and blue. Although the orientation of the Keck and ISS observations are slightly different, similar structures are seen on the deconvolved image as in the ISS image, validating the effectiveness of AIDA. Two ISS images were chosen to illustrate the variability of the satellite appearance due to the presence of haze and clouds. Arrows serve as reference markers to a common feature. Images of the six sampled PSFs used in the myopic deconvolution process are shown in the bottom panel along with the reconstructed PSF in the green frame on the right.
Subsystem images (with a slight rotation of Titan) is striking. The smallest albedo structures detected after deconvolution have clear equivalents in the higherresolution image71 (see arrow markings). This comparison validates the efficiency of our algorithm and demonstrates the absence of significant artifacts on the deconvolved image. A full scientific analysis of this and numerous other Titan observations and deconvolution results is presented elsewhere.71
5. APPLICATION TO MULTI-FRAME DATA SETS When multiple AO images of a common object are acquired, they are often simply combined into a single shiftand-added image, which is then deconvolved. This practice has been demonstrated by others to be suboptimal; a more effective data reduction strategy would be to decon-
A. Atmosphere of Uranus (Multi-PSF) Since the Voyager spacecraft encounter of the planet Uranus in 1986, interest in this planet has been revitalized with the discovery that its atmosphere is considerably active.72 High-angular-resolution imaging, however, is necessary to detect cloud motions,73 faint rings, and small satellite systems.74,75 The extended disk (diameter 83.6 arcsec) of the planet (integrated apparent visual magnitude, mv 8 6) is bright enough to be used as a reference for wavefront sensor analysis on most AO systems. However, since the position of the centroid on the wavefront is not well determined in the case of a quad-cell aperture wavefront sensor for such an extended object, the atmospheric correction is degraded in the final image, and artifacts may appear in several frames.75 We tested AIDA on observations of Uranus taken on October 3, 2003, with the Keck AO system and its NIRC-2 camera, using a broadband filter centered at 1.6 7m (H band). Five 30 s frames recorded in less than 8 min were processed using standard near-infrared data reduction techniques (flatfield, sky subtraction, and bad pixel removal). To estimate the PSF for myopic deconvolution, we imaged Puck, a bright satellite of Uranus located 2.4! away from the center of the planet and whose motion was negligible during the exposure time. Given the large imaged size of Uranus and size of the image frames !10241 1024 pixels", using MISTRAL for deconvolution would not have been practical due to the long processing time needed (823 h / deconvolution on a Sun Ultra 10 computer), especially since we would have needed to run multiple deconvolutions to determine a good choice of regularization parameters. Deconvolution using AIDA with automatic hyperparameter estimation was significantly faster (45 min for mono-frame deconvolution and 1.5 h for multiPSF deconvolution on a 2.8 GHz Intel Xeon Linux machine) with the possibility of analyzing all AO data frames simultaneously. Deconvolution results in significant image sharpening (Fig. 10), with a gain in contrast of 82 – 3 on the cloud features. A layered structure of the northern haze and some faint clouds at 840° latitude are revealed, and the structure of the large clouds on the southern hemisphere is clearer after deconvolution. A ghost outer ring artifact present in previous observations using the same Keck AO system75 is visible in several of the individual AOcorrected image frames [Fig. 10(C)]. This artifact remains in the mono-frame deconvolution of the shift-and-added
1594
J. Opt. Soc. Am. A / Vol. 24, No. 6 / June 2007
Hom et al.
combined image but is half as intense in the multi-frame deconvolution result [cf. Figs. 10(D) and 10(E)]. The glare of Uranus (e.g., see area near the innermost ringlet) is also further reduced in the multi-frame deconvolution result than in the mono-frame deconvolution result. Overall, we find that simultaneous deconvolution of multipleframe data is better able to restore low SNR features and minimize artifacts than the deconvolution of a single shift-and-added representation of the multiple-frame data.
Fig. 10. Planet Uranus observed with the Keck AO system and NIRC-2 camera on October 3, 2003. Top: A: Multi-PSF deconvolution of five AO-corrected images of Uranus; B: combined shiftand-added image of five AO-corrected observations (30 s exposure for each). The gain in contrast after deconvolution is estimated to be 82, so that cloud features (arrows) can be more easily identified. Bottom: Close-up of the ringlets of Uranus. C: basic-processed AO image. D: Multi-PSF deconvolution using six image frames. E: Mono-frame deconvolution of a shift-and-added image. This ring system is extremely faint and close to the disk of the planet; intensities of the ringlets are comparable to the intensity of the glare of Uranus as shown in the basic processed image C. Deconvolution using AIDA significantly improves the contrast even on these faint features. The result is slightly better using multi-frame versus mono-frame deconvolution. Arrows indicate a ghost artifact present in the mono-frame deconvolution result, which is reduced in the multi-frame deconvolution result.
B. Yeast Microtubule Dynamics (Multi-Object) Microtubules are hollow cylindrical polymers that radiate from near the nucleus of a cell and serve as tracks upon which cellular components are transported. Roughly 25 nm in diameter, these microtubules are formed from the stochastic polymerization and depolymerization of )and (-tubulin proteins. The regulation of microtubule dynamics has been a topic of investigation for many years in cell biology, aided greatly by the direct observation of microtubules using time-lapsed video fluorescence microscopy.76 We used AIDA in multi-object deconvolution mode to process time-series images of microtubule dynamics in the fission yeast, Schizosaccharomyces pombe. Using the OMX wide-field fluorescence microscope system developed recently in our lab at the University of California, San Francisco (UCSF), a yeast cell whose microtubules were fluorescently labeled using the green fluorescence protein fused to )-tubulin was imaged every second. Each image was formed by physically sweeping the microscope focus (by linearly moving the sample stage) through the
Fig. 11. Multi-object deconvolution of time-series images of a S. pombe (fission yeast) cell whose microtubules were fluorescently labeled with )-tubulin green fluorescent protein and imaged with the OMX microscope system (data courtesy of Satoru Uzawa, Sedat Lab. UCSF). Each time-series slice was generated by axially sweeping the microscope focus over a 4 7m depth within 50 ms; an image slice was acquired every second for about 4 min. A: A single time-series slice of the original image data after basic processing (bad pixel removal and flat fielding), mono-frame deconvolution, and multi-object deconvolution !image pixel size= 80 nm". B: One-dimensional maximum intensity projections (generated along the y axis of the slice) plotted as a function of time (kymograph).
Hom et al.
entire z depth of the cell (84 7m in 50 ms) every second. Using estimates of the PSF based on a set of three images of a 0.1 7m fluorescent bead acquired under similar conditions, these time-series data were myopically deconvolved assuming a common (time-invariant) PSF for the whole data set and assuming each image was simply a snapshot of a distinct object. In Fig. 11(A), we show the results of standard myopic deconvolution and multi-object deconvolution with automatic hyperparameter estimates for a single representative time slice. In Fig. 11(B), the corresponding kymograph plots—1D maximum intensity projections of each image as a function of time—are shown for these data. These kymograph plots provide a better perspective on the time-dependent features of microtubule growth and shrinkage. The mono-frame deconvolution results are significantly denoised with improved microtubule contrast. The multi-object deconvolution results have even better contrast enhancement, exhibiting thinner microtubule fibers and a more textured background within the cell cytoplasm. It is unclear how much of this texturing may be artifactual. However, the fact that each image slice was deconvolved independently with respect to the time axis and that a number of cell background features are temporally persistent in the kymograph suggest that some of these grainy features are genuine.
Vol. 24, No. 6 / June 2007 / J. Opt. Soc. Am. A
1595
6. APPLICATION TO THREE-DIMENSIONAL DATA SETS One main advance of AIDA is the extension of the MISTRAL method to deconvolved 3D data commonly encountered in biological imaging. Unlike the 2D PSFs encountered in low-numerical-aperture astronomical imaging, the PSFs in optical microscopy are more diffuse, with significant axial (z-dimensional) blurring on the order of three times the lateral blur. Deconvolution is expected to dramatically sharpen image data subject to such out-offocus blur. Recently, Chenegros et al.77 demonstrated the effectiveness of MISTRAL’s edge-preserving regularization term in deconvolving synthetic 3D retinal images. Here, we show myopic deconvolution results for two 3D data sets, one synthesized from magnetic-resonance imaging (MRI) data of a frog and another of real, wide-field fluorescence microscopy data of chromosomes within cells undergoing cell division. A. Three-Dimensional Frog MRI We constructed synthetic 3D frog images !1281 256 1 256 pixels" by convolving a MRI volume data set from The Whole Frog Project (Lawrence Berkeley National Laboratory)78 with a PSF derived from microscopic imaging of a subresolution !0.1 7m" fluorescent bead; Poisson
Fig. 12. 2D volume projections for myopically deconvolved 3D frog image stacks with image SNRs of 0 and 20 dB. A: xy projection; B: yz projection. Each image is shown using a full intensity scale (from minimum value to maximum value). Automatic hyperparameter estimates were used along with an axial resolution gradient factor of 2 = 3 (see Subsection 3.C). Images are scaled from minimum to maximum values.
1596
J. Opt. Soc. Am. A / Vol. 24, No. 6 / June 2007
and Gaussian noise was added to the convolved image as described earlier. The PSF used had a FWHM in the lateral direction of 83 pixels and an effective resolution loss in the z direction !2" of 83 [see Eq. (21)]. Using an ensemble of similarly acquired experimental PSFs, these frog images were myopically deconvolved using automatic hyperparameter estimates (86 h on a 2.8 GHz Intel Xeon Linux machine). Additive 2D volume projections for the raw and deconvolved 3D image stacks for image SNRs of 0 and 20 dB are shown in Figs. 12(A) (en face) and 12(B) (side view). The denoising and object reconstructions for these data are striking. The quality of the deconvolution results conveyed by these 2D projections is comparable to that seen from a comparison of individual 2D slices. Representative slices through the 3D volume stack of the original object, 20 dB SNR image, and deconvolution result are shown in Fig. 13; also shown are intensity line profiles (denoted by an asterisk) through the eye region of the 2D frog slices. Deconvolution with AIDA leads to substantial photometric restoration of the original frog data, with a signal-tonoise improvement !*SNR" of 5.7 and 5.1 dB for image SNRs of 0 and 20 dB, respectively. B. Mitotic Chromosomes in Drosophila Embryos Nearly 50 years since the atomic structure of DNA was elucidated, the higher-order structural organization of DNA within chromosomes of cells remains poorly understood. With recent advances in high-resolution microscopic imaging and fluorescent labeling technology, however, discerning the mesoscopic arrangements of DNA within living cells is becoming more of a reality. A primary interest of ours is to better understand the detailed structural changes of chromosomes as a cell divides in a process called mitosis. During mitosis, a cell’s chromosomes are unraveled, condensed, and separated; defects in chromosome structure during any of these mechanical steps could have devastating consequences on the fidelity of genetic transmission to daughter cells.79 Drosophila melanogaster (fruit fly) embryos offer a unique opportunity to study chromosome structural changes during mitosis. Cells in early embryos (within 2 – 3 h) undergo multiple rounds of cell division in an ordered and highly reproducible manner. Using the OMX microscope system mentioned earlier (Subsection 5.B), a 3D image stack !321 5121 512 pixels" was acquired of a cell-cycle-10 D. melanogaster embryo fixed in 10% formaldehyde and mounted in glycerol. Cells in this embryo were stained with the DNA-specific dye, DAPI, and captured undergoing anaphase, the stage of mitosis in which chromosomes separate. This image stack was deconvolved myopically using a PSF derived from an image of a 170 nm fluorescent bead under similar imaging settings. Image pixel spacing was 80 nm in xy and 150 nm in z, for a total image stack thickness of 4.8 7m. + was set to 3.2 based on the extent of a measured OTF in the lateral versus axial directions. Shown in Fig. 14 are 2D maximum intensity projections of representative portions of the original 3D image stack and the result after myopic deconvolution. Although the original data shown are of especially good quality so that most chromosome arms can be distinguished in Fig.
Hom et al.
14(A), chromosome boundaries are significantly more demarcated in the deconvolution result. The benefits of deconvolution are even more pronounced in Fig. 14(B) in which there is greater blurring in the axial versus lateral directions: finer structures and corrugated banding patterns of the chromosome arms become noticeable; the arrows highlight a few representative areas showing improved contrast in fine image features. Some residual hour-glass PSF blur remains after deconvolution, however, and appears to become more prominent with increasing z depth (see, e.g., lower left of deconvolution result, Fig. 14(B)). This blur may be attributed to greater index-of-refraction aberrations between the microscope objective lens and the sample as one focuses deeper into the embryo. The true PSF in this case is thus likely to be depth dependent, although space-invariant PSFs are assumed in the current AIDA deconvolution framework. To achieve the nonblurry, visually balanced deconvolution result of Fig. 14, we found it necessary to scale the automatic hyperparameter estimate, "ˆ o, down by a factor of 10. Inaccurate hyperparameter estimation is likely due to at least one of four possible causes. First, since only a single PSF estimate was available for these data [in which case the OTF constraint is based simply on the photonic-noise variance (see Subsection 3.A)], the calculated OTF statistics may not be sufficient to guide the myopic deconvolution toward a more correct OTF. A lower "ˆ o likely compensates for imprecise OTF statistics. Second, as alluded to above, depth-dependent variations of the true PSF are not accounted for in our imaging model and may lead to compromised object reconstructions. Third, there may be noise sources (e.g., out-of-focus, scattered background light) that are not accounted for by the assumed noise model; the effectiveness of the hyperpa-
Fig. 13. Representative 2D slice and line profile through the original 3D frog object !o", 20 dB SNR image !i", and deconvolution result !oˆ".
Hom et al.
Vol. 24, No. 6 / June 2007 / J. Opt. Soc. Am. A
1597
Fig. 14. Chromosomes of mitotically dividing cells (cell cycle 10, anaphase) within a D. melanogaster (fruit fly) embryo. Chromosomes were stained with the fluorescent dye, DAPI, and embryos were fixed in 10% formaldehyde fixation buffer A, mounted in glycerol, and imaged using the OMX microscope system with a 1001 oil-immersion objective (data courtesy of Yuri Strukov, Sedat Lab, UCSF). A: Maximum intensity xy projections of two subregions of the acquired 3D image stack after basic processing (top) and of the myopic deconvolution result using + = 3.2 and " = "ˆ / 10 (bottom) (see text). Insets (see arrows) highlight corresponding areas of improved contrast o
after AIDA deconvolution. B: xz projections for the data in A. Areas of improved contrast are highlighted by arrows. More dramatic restoration is observed in the axial !z" direction, although some residual blurring remains, noticeably with increasing z. Image pixel size was 80 nm in the lateral !xy" direction and 150 nm in the axial direction. Bar= 4 7m.
rameter estimation scheme is predicated upon good estimates for the Gaussian and Poisson noise statistics (as discussed in Subsection 3.D). Fourth, out-of-focus contributions to the image stack from areas of the embryo outside the image stack are not accounted for in the current imaging framework. The effects of these factors on deconvolution outcome and strategies to compensate for them are currently being explored by our group.
7. SUMMARY AND FUTURE DIRECTIONS We have reimplemented and extended the MISTRAL approach12 to myopically deconvolve, as far as we know for the first time, multiple-image-frame data and 3D image stacks. Unlike MISTRAL, which is implemented using the commercial Interactive Data Language (Research Systems, Inc., Boulder, Colorado) and has proprietary source code, our adaptive image deconvolution algorithm, AIDA, was implemented using freely available Numerical Python and is intended for open-source development. AIDA runs at least 15 times faster than the original MISTRAL implementation. Importantly, AIDA incorporates a simple yet robust scheme to estimate regularization hyperparameters, which greatly simplifies the tedious and delicate though necessary task of balancing maximum-
likelihood estimation with object regularization and noise suppression. Object reconstructions can be generated using AIDA that are comparable with those of MISTRAL, with high photometric precision and good edge preservation and without the need to sample (typically 10–20) different hyperparameter settings in order optimize the degree of regularization. This results in a practical efficiency gain of AIDA over MISTRAL of greater than 100-fold. Multiple image observations are commonly acquired in adaptive optics imaging, although they are often combined into a single averaged image before deconvolution. Deconvolving these images simultaneously, however, is a more effective data reduction strategy.11,31–33 The multiframe deconvolution results for the Uranus AO observations show that leveraging invariable aspects of the data while retaining the unique variations between distinct observations leads to object reconstructions with crisper details than the corresponding mono-frame deconvolution result. AIDA’s multi-frame deconvolution capabilities are currently limited to data with a single object and multiple variable PSFs (Mo = 1; Mh , 1) or a single PSF and multiple variable objects (Mh = 1; Mo , 1). It would be straightforward to extend the algorithm to handle data sets in
1598
J. Opt. Soc. Am. A / Vol. 24, No. 6 / June 2007
which multiple objects are imaged using different though known transformations of a fundamental PSF describing the optical system. This is relevant, for example, to multiwavelength imaging in astronomy34 and microscopy in which the PSF characteristics as a function of wavelength are well established and can be predicted. Such an approach could also be applied to process tomographic imaging data in which the dependence of the transfer function is known and parametrizable as a function of tilt angle. Using such a multi-object–multi-linked-PSF approach, our group is currently exploring the application of AIDA to deconvolve electron microscopy (EM) images, with the goal of improving 3D object reconstructions from EM tomographic data. AIDA is equally effective in deconvolving 3D image data and 2D data, and deconvolution times scale linearly with the size of the image data. In the current AIDA framework, each image pixel element is treated as a variable to be optimized, leading to substantial computational demands as image size increases. Work in our group is in progress to recast the optimization of the PSF in terms of the more computationally compact pupil function that characterizes the optical wavefront at the exit pupil of an imaging system arising from a point source.80,81 In addition to greater computational efficiency for larger image data sets, myopic deconvolution using the pupil function could provide explicit insight into the inherent or dynamic aberration modes of an optical system (e.g., by Zernike mode decomposition). The ease with which the pupil function can be modified to account for aberrations also makes it particularly amenable to use in cases where the PSF is space variant80,81 (e.g., with depth-dependent index-of-refraction variations in microscopy or anisoplanatic imaging in astronomy). Moreover, use of the pupil function could help bridge the synthesis of wavefront-sensing data from AO and imaging data in the deconvolution process.52 At least four issues merit further development and exploration. First, the reasons for the success of our automatic hyperparameter estimation scheme. While this semiempirical scheme is effective in deconvolving a broad range of image data, the theoretical foundations for its robustness deserve future study. The assumption of quasiindependent pixel/voxel prior distributions and the assumption that the balance of maximum-likelihood estimation and object regularization is best achieved by normalizing these prior distributions with respect to one another should be explored in relation to the partition functions of Eq. (6) and other more rigorous marginal likelihood approaches. Second, the development of a multi-object deconvolution mode more specifically tailored for time-series data. In deconvolving the microtubule dynamics data in subsection 5.B, the temporal independence of each object in the time series was assumed. While this was helpful in highlighting common, persistent features between time frames, incorporating a cost function term or procedure within the deconvolution algorithm to maximize the temporal correlation between adjacent time slices may help reinforce object features that are self-similar and suppress temporally uncorrelated noise artifacts. Third, as image data sets become larger and/or deviations from the assumed noise model become
Hom et al.
more pronounced, the time-to-optimization convergence may become seriously compromised. Convergence might be improved by toggling between a weighted leastsquares (L2-norm) form for the data fidelity term [Eq. (8)] and a robust L1-norm form that is computationally simpler and less sensitive to noise model mismatch and data outliers.82–84 Deconvolution efficiency might also be improved by a reparametrization of the object, for example, using wavelets,17 and by incorporating aspects of multiresolution/hierarchical scaling into the deconvolution algorithm.17,85–87 Finally, it would be interesting to see how the myopic capabilities and edge-preserving noise suppression advantages of AIDA deconvolution could improve the processing of data from such superresolution imaging modalities as multi-frame mosaicing84,88 and structured illumination microscopy.89,90
ACKNOWLEDGMENTS We thank members of the Sedat Laboratory Z. Kam, and M. Gustafsson for discussions and comments on the manuscript. We thank Eugene Ingerman [University of California, Davis, and Lawrence Livermore National Laboratory (LLNL)] and Stephen Lane (LLNL) for making the conjugate gradient code available to us. We thank the authors of MISTRAL for allowing F. Marchis privileged use of their program and a reviewer for bringing to our attention the work of Chenegros et al.77 The astronomical data presented herein were obtained at the W. M. Keck Observatory, which is operated as a scientific partnership among the California Institute of Technology, the University of California, and NASA. The Observatory was made possible by the generous financial support of the W. M. Keck Foundation. Work by E. F. Y. Hom, S. Haase, and J. W. Sedat was supported by NIH grant GM25101-26. F. Marchis was supported in part by NASA grant PAST040000-0025 and by the National Science Foundation Science and Technology Center for Adaptive Optics, managed by the University of California at Santa Cruz under cooperative agreement AST-9876783. T. K. Lee was supported by Howard Hughes Medical Institute summer fellowships. D. A. Agard was supported by NIH grant GM31627 and is a Howard Hughes Medical Institute investigator. AIDA source code, news, and updates will be available at http://msg.ucsf.edu/AIDA.
*Current address: MCB, Harvard University, 16 Divinity Avenue, BL 3000, Cambridge, Massachusetts 02138, USA. E-mail,
[email protected]. † Corresponding author J. W. Sedat can be reached by e-mail at
[email protected].
REFERENCES 1. 2. 3.
F. Roddier, Adaptive Optics in Astronomy (Cambridge U. Press, 2004). J. C. Christou, D. Bonnacini, N. Ageorges, and F. Marchis, “Myopic deconvolution of adaptive optics images,” ESO Messenger 97, 14–22 (1999). J.-P. Véran, F. Rigaut, M. Henri, and D. Rouan, “Estimation of the adaptive optics long-exposure point-
Hom et al.
4.
5.
6. 7. 8. 9. 10. 11. 12.
13. 14. 15.
16. 17. 18. 19. 20.
21. 22.
23.
24.
25.
spread function using control loop data,” J. Opt. Soc. Am. A 14, 3057–3069 (1997). S. F. Gibson and F. Lanni, “Experimental test of an analytical model of aberration in an oil-immersion objective lens used in three-dimensional light microscopy,” J. Opt. Soc. Am. A 8, 1601–1613 (1991). D. Le Mignant, F. Marchis, D. Bonaccini, P. Prado, E. Barrios, R. Tighe, V. Merino, and A. Sanchez, The 3.60m Telescope Team, and ESO Adaptive Optics Team, “The ESO ADONIS system: a 3 years experience in observing methods,” in Vol. 56 of ESO Conference and Workshop Proceedings, D. Bonaccini, ed. (European Southern Observatory, 1999), p. 287. Y. Hiraoka, J. W. Sedat, and D. A. Agard, “The use of a charge-coupled device for quantitative optical microscopy of biological structures,” Science 238, 36–41 (1987). T. J. Holmes, “Blind deconvolution of quantum-limited incoherent imagery: maximum-likelihood approach,” J. Opt. Soc. Am. A 9, 1052–1061 (1992). M. Bertero and P. Boccacci, Introduction to Inverse Problems in Imaging (Institute of Physics, 1998). G. R. Ayers and J. C. Dainty, “Iterative blind deconvolution method and its applications,” Opt. Lett. 13, 547–549 (1988). T. G. Stockham, T. M. Cannon, and R. B. Ingebretsen, “Blind deconvolution through digital signal processing,” Proc. IEEE 63, 678–692 (1975). T. J. Schulz, “Multiframe blind deconvolution of astronomical images,” J. Opt. Soc. Am. A 10, 1064–1073 (1993). L. M. Mugnier, T. Fusco, and J.-M. Conan, “MISTRAL: a myopic edge-preserving image restoration method, with application to astronomical adaptive-optics-corrected longexposure images,” J. Opt. Soc. Am. A 21, 1841–1854 (2004). S. B. Howell, Handbook of CCD Astronomy (Cambridge U. Press, 2000). W.-Y. V. Leung and R. G. Lane, “Blind deconvolution of images blurred by atmospheric speckle,” Proc. SPIE 4123, 73–83 (2000). G. Demoment, “Image reconstruction and restoration: overview of common estimation structures and problems,” IEEE Trans. Acoust., Speech, Signal Process. 37, 2024–2036 (1989). R. Molina, J. Nunez, F. J. Cortijo, and J. Mateos, “Image restoration in astronomy: a Bayesian perspective,” IEEE Signal Process. Mag. 18, 11–29 (2001). J.-L. Starck and F. Murtagh, Astronomical Image and Data Analysis (Springer, 2002). J. Besag, “On the statistical analysis of dirty pictures,” J. R. Stat. Soc. Ser. B (Methodol.) 48, 259–302 (1986). S. Geman and D. Geman, “Stochastic relaxation, Gibbs distributions, and Bayesian restoration of images,” IEEE Trans. Pattern Anal. Mach. Intell. 6, 721–741 (1984). P. Charbonnier, L. Blanc-Feraud, G. Aubert, and M. Barlaud, “Deterministic edge-preserving regularization in computed imaging,” IEEE Trans. Image Process. 6, 298–311 (1997). C. Bouman and K. Sauer, “A generalized Gaussian image model for edge-preserving MAP estimation,” IEEE Trans. Image Process. 2, 296–310 (1993). S. Teboul, L. Blanc-Feraud, G. Aubert, and M. Barlaud, “Variational approach for edge-preserving regularization using coupled PDEs,” IEEE Trans. Image Process. 7, 387–397 (1998). S. Brette and J. Idier, “Optimized single site update algorithms for image deblurring,” in Proceedings of IEEE International Conference on Image Processing (IEEE, 1996), Vol. 3, pp. 65–68. S. S. Saquib, C. A. Bouman, and K. Sauer, “ML parameter estimation for Markov random fields with applications to Bayesian tomography,” IEEE Trans. Image Process. 7, 1029–1044 (1998). A. Jalobeanu, L. Blanc-Féraud, and J. Zerubia, “Adaptive parameter estimation for satellite image deconvolution,” Rapport de Recherche de l’INRIA–Sophia Antipolis, Equipe ARIANA RR-3956 (INRIA, 2000).
Vol. 24, No. 6 / June 2007 / J. Opt. Soc. Am. A 26.
27. 28.
29.
30. 31. 32. 33. 34. 35.
36. 37.
38. 39. 40. 41. 42.
43.
44. 45. 46. 47. 48. 49.
1599
A. Jalobeanu, L. Blanc-Féraud, and J. Zerubia, “Hyperparameter estimation for satellite image restoration using a MCMC maximum-likelihood method,” Pattern Recogn. 35, 341–352 (2002). A. Jalobeanu, L. Blanc-Féraud, and J. Zerubia, “An adaptive Gaussian model for satellite image deblurring,” IEEE Trans. Image Process. 13, 613–621 (2004). J.-M. Conan, L. M. Mugnier, T. Fusco, V. Michau, and G. Rousset, “Myopic deconvolution of adaptive optics images by use of object and point-spread function power spectra,” Appl. Opt. 37, 4614–4622 (1998). T. Fusco, J.-P. Véran, J.-M. Conan, and L. M. Mugnier, “Myopic deconvolution method for adaptive optics images of stellar fields,” Astron. Astrophys., Suppl. Ser. 134, 193–200 (1999). S. M. Jefferies and J. C. Christou, “Restoration of astronomical images by iterative blind deconvolution,” Astrophys. J. 415, 862–874 (1993). J. C. Christou, A. Roorda, and D. R. Williams, “Deconvolution of adaptive optics retinal images,” J. Opt. Soc. Am. A 21, 1393–1401 (2004). M. Straume, “Sequential versus simultaneous analysis of data: differences in reliability of derived quantitative conclusions,” Methods Enzymol. 240, 89–121 (1994). J. C. Christou, E. K. Hege, and S. M. Jefferies, “Speckle deconvolution imaging using an iterative algorithm,” Proc. SPIE 2566, 134–143 (1995). H. R. Ingleby and D. R. McGaughey, “Experimental results of parallel multiframe blind deconvolution using wavelength diversity,” Proc. SPIE 5578, 8–14 (2004). J. C. Christou, E. K. Hege, S. M. Jefferies, and C. U. Keller, “Application of multiframe iterative blind deconvolution for diverse astronomical imaging,” Proc. SPIE 2200, 433–444 (1994). T. J. Schulz, B. E. Stribling, and J. J. Miller, “Multiframe blind deconvolution with real data: imagery of the Hubble Space Telescope,” Opt. Express 1, 355–362 (1997). P. Greenfield, T. Miller, W. Rick, J. C. Hsu. P. Barrett, J. Kupper, and P. J. Verveer, “Numarray: an open source project,” http://www.stsci.edu/resources/ software_hardware/numarray. D. M. Beazley, “Automated scientific software scripting with SWIG,” FGCS, Future Gener. Comput. Syst. 19, 599–609 (2003). D. M. Beazley and the SWIG Team, “A simplified wrapper and interface generator,” http://www.swig.org. M. Frigo and S. G. Johnson, “The design and implementation of FFTW3,” Proc. IEEE 93, 216–231 (2005). M. S. Bazaraa, H. D. Sherali, and C. M. Shetty, Nonlinear Programming: Theory and Algorithms, 2nd ed. (Wiley, 1993). D. M. Goodman, E. M. Johansson, and T. W. Lawrence, “On applying the conjugate gradient algorithm to image processing problems,” in Multivariate Analysis: Future Directions, C. R. Rao, ed., Vol. 5 of North-Holland Series in Statistics and Probability (North-Holland, 1993), Chap. 11. J. R. Somoza, H. Szoke, D. M. Goodman, P. Beran, D. Truckses, S. H. Kim, and A. Szoke, “Holographic methods in X-ray crystallography. 4. A fast algorithm and its application to macromolecular crystallography,” Acta Crystallogr., Sect. A: Found. Crystallogr. 51, 691–708 (1995). H. Szoke, A. Szoke, J. Somoza, and F. Maia, “The EDEN Holographic Method,” http://www.edencrystallography.org/. W. H. Press, B. P. Flannery, S. A. Teukolsky, and W. T. Vetterling, Numerical Recipes in C: The Art of Scientific Computing (Cambridge U. Press, 1992). R. A. Johnston, T. J. Connolly, and R. G. Lane, “An improved method for deconvolving a positive image,” Opt. Commun. 181, 267–278 (2000). W. K. Pratt, Digital Image Processing: PIKS Inside 3rd ed. (Wiley-Interscience, 2001). W. Frei and C.-C. Chen, “Fast boundary detection: a generalization and a new algorithm,” IEEE Trans. Comput. C26, 988–998 (1977). J. E. N. Jonkman and E. H. K. Stelzer, “Resolution and
1600
50. 51. 52. 53. 54.
55. 56.
57.
58.
59. 60. 61. 62.
63.
64.
65.
66.
67. 68.
J. Opt. Soc. Am. A / Vol. 24, No. 6 / June 2007 contrast in confocal and two-photon microscopy,” in Confocal and Two-Photon Microscopy: Foundations, Applications, and Advances, A. Diaspro, ed. (Wiley-Liss, 2001), Chap. 5. L. H. Ryder, Quantum Field Theory (Cambridge U. Press, 1985). R. N. Bracewell, The Fourier Transform and Its Applications (McGraw-Hill, 1999). L. M. Mugnier, C. Robert, J.-M. Conan, V. Michau, and S. Salem, “Myopic deconvolution from wave-front sensing,” J. Opt. Soc. Am. A 18, 862–872 (2001). C. K. Chu, I. K. Glad, F. Godtliebsen, and J. S. Marron, “Edge-preserving smoothers for image processing,” J. Am. Stat. Assoc. 93, 526–541 (1998). N. P. Galatsanos and A. K. Katsaggelos, “Methods for choosing the regularization parameter and estimating the noise variance in image restoration and their relation,” IEEE Trans. Image Process. 1, 332–336 (1992). G. H. Golub, M. Heath, and G. Wahba, “Generalized crossvalidation as a method for choosing a good ridge parameter,” Technometrics 21, 215–223 (1979). M. V. Ibáñez and A. Simó, “Parameter estimation in Markov random field image modeling with imperfect observations. A comparative study,” Pattern Recogn. Lett. 24, 2377–2389 (2003). A. Jalobeanu, L. Blanc-Féraud, and J. Zerubia, “Estimation of adaptive parameters for satellite image deconvolution,” in Proceedings of the IEEE International Conference on Pattern Recognition, A. Sanfeliu, J. J. Villanueva, M. Vanrell, R. Alquezar, J. O. Eklundh, and Y. Aloimonos, eds., (IEEE, 2000), Vol. 3, pp. 318–321. G. G. Potamianos and J. K. Goutsias, “Partition function estimation of Gibbs random-field images using Monte Carlo simulations,” IEEE Trans. Inf. Theory 39, 1322–1332 (1993). Z. Y. Zhou, R. M. Leahy, and J. Y. Qi, “Approximate maximum likelihood hyperparameter estimation for Gibbs priors,” IEEE Trans. Image Process. 6, 844–861 (1997). University of Granada Computer Vision Group, “Brain magnetic resonance dataset (mr030.pgm),” http:// decsai.ugr.es/cvg/dbimages/gbio256.php. E. Thiébaut and J.-M. Conan, “Strict a priori constraints for maximum-likelihood blind deconvolution,” J. Opt. Soc. Am. A 12, 485–492 (1995). F. Marchis, I. de Pater, A. G. Davies, H. G. Roe, T. Fusco, D. Le Mignant, P. Descamps, B. A. Macintosh, and R. Prangé, “High-resolution Keck adaptive optics imaging of violent volcanic activity on Io,” Icarus 160, 124–131 (2002). F. Marchis, A. G. Davies, S. G. Gibbard, D. Le Mignant, R. M. Lopes, B. Macintosh, and I. de Pater, “Volcanic activity of Io monitored with Keck-10m AO in 2003-2004,” in American Geophysical Union, Fall Meeting 2004 Abstracts, (American Geophysical union, 2004), p. C1483. F. Marchis, D. Le Mignant, F. H. Chaffee, A. G. Davies, S. H. Kwok, R. Prangé, I. de Pater, P. Amico, R. Campbell, T. Fusco, R. W. Goodrich, and A. Conrad, “Keck AO survey of Io global volcanic activity between 2 and 5 7m,” Icarus 176, 96–122 (2005). S. Douté, B. Schmitt. R. Lopes-Gautier, R. Carlson, L. Soderblom, J. Shirley, and The Galileo NIMS Team, “Mapping SO2 frost on Io by the modeling of NIMS hyperspectral images,” Icarus 149, 107–132 (2001). F. Marchis, “High resolution imaging of the solar system bodies by means of adaptive optics. A study of the volcanic activity of Io,” Ph.D. thesis (European Southern Observatory, Chile, and Institut d’Astrophysique Spatiale, France, 2000). F. Marchis, “Theoretical PSFs for the KECK telescope and AO instruments,” http://astron.berkeley.edu/~fmarchis/ Science/Keck/Perfect.PSF/. B. A. Smith, L. Soderblom, R. F. Beebe, J. M. Boyce, G. Briggs, A. Bunker, S. A. Collins, C. Hansen, T. V. Johnson, J. L. Mitchell, R. J. Terrile, M. H. Carr, A. F. Cook, J. N. Cuzzi, J. B. Pollack, G. E. Danielson, A. P. Ingersoll, M. E. Davies, G. E. Hunt, H. Masursky, E. M. Shoemaker, D.
Hom et al.
69.
70.
71.
72. 73.
74. 75. 76.
77. 78. 79. 80. 81. 82. 83. 84. 85. 86.
87. 88. 89. 90.
Morrison, T. Owen, C. Sagan, J. Veverka, R. Strom, and V. E. Suomi, “Encounter with Saturn—Voyager 1 imaging science results,” Science 212, 163–191 (1981). S. G. Gibbard, I. de Pater, B. A. Macintosh, H. G. Roe, C. E. Max, E. F. Young, and C. P. McKay, “Titan’s 2 7m surface albedo and haze optical depth in 1996–2004: Titan: PreCassini view,” Geophys. Res. Lett. 31, L17S02 (2004). A. Coustenis, E. Gendron, O. Lai, J.-P. Véran, J. Woillez, M. Combes, L. Vapillon, T. Fusco, L. Mugnier, and P. Rannou, “Images of Titan at 1.3 and 1.6 7m with adaptive optics at the CFHT,” Icarus 154, 501–515 (2001). I. de Pater, M. Ádámkovics, A. H. Bouchez, M. E. Brown, S. G. Gibbard, F. Marchis, H. G. Roe, E. Schaller, and E. Young, “Titan imagery with Keck adaptive optics during and after probe entry,” Geophys. Res. Lett. 111, E07S05. L. A. Sromovsky, J. R. Spencer, K. H. Baines, and P. M. Fry, “Ground-based observations of cloud features on Uranus,” Icarus 146, 307–311 (2000). H. B. Hammel, I. de Pater, S. G. Gibbard, G. W. Lockwood, and K. Rages, “New cloud activity on Uranus in 2004: first detection of a southern feature at 2.2 7m,” Icarus 175, 284–288 (2005). P. Descamps, F. Marchis, J. Berthier, R. Prangé, T. Fusco, and C. Le Guyader, “First ground-based astrometric observations of Puck,” C. R. Phys. 3, 121–128 (2002). I. de Pater, S. G. Gibbard, B. A. Macintosh, H. Roe, D. T. Gavel, and C. E. Max, “Keck adaptive optics images of Uranus and its rings,” Icarus 160, 359–374 (2002). C. M. Waterman-Storer, “Microtubules and microscopes: how the development of light microscopic imaging technologies has contributed to discoveries about microtubule dynamics in living cells,” Mol. Biol. Cell 9, 3263–3271 (1998). G. Chenegros, L. M. Mugnier, F. Lacombe, and M. Glanc, “3D deconvolution of adaptive-optics corrected retinal images,” Proc. SPIE 6090, 60900P (2006). “The Whole Frog Project,” http://froggy.lbl.gov. K. Nasmyth, “Disseminating the genome: joining, resolving, and separating sister chromatids during mitosis and meiosis,” Annu. Rev. Genet. 35, 673–745 (2001). B. M. Hanser, M. G. L. Gustafsson, D. A. Agard, and J. W. Sedat, “Phase retrieval for high-numerical-aperture optical systems,” Opt. Lett. 28, 801–803 (2003). B. M. Hanser, M. G. L. Gustafsson, D. A. Agard, and J. W. Sedat, “Phase-retrieved pupil functions in wide-field fluorescence microscopy,” J. Microsc. 216, 32–48 (2004). P. J. Huber, Robust Statistics (Wiley-Interscience, 2003). Q. Ke and T. Kanade, “Robust subspace computation using L1 norm,” http://reports-arcliive.adin.cs.crnu.edu/anon/ 2003/CMU-CS-03-172.pdf. S. Farsiu, D. Robinson, M. Elad, and P. Milanfar, “Advances and challenges in super-resolution,” Int. J. Imaging Syst. Technol. 14, 47–57 (2004). M. A. T. Figueiredo and R. D. Nowak, “An EM algorithm for wavelet-based image restoration,” IEEE Trans. Image Process. 12, 906–916 (2003). R. C. Puetter, “Pixon-based multiresolution image reconstruction and the quantification of picture information content,” Int. J. Imaging Syst. Technol. 6, 314–331 (1995). B. P. Wakker and U. J. Schwarz, “The Multi-Resolution CLEAN and its application to the short-spacing problem in interferometry,” Astron. Astrophys. 200, 312–322 (1988). D. S. Biggs, C.-L. Wang, T. J. Holmes, and A. Khodjakov, “Subpixel deconvolution of 3D optical microscope imagery,” Proc. SPIE 5559, 369–380 (2004). M. G. Gustafsson, “Surpassing the lateral resolution limit by a factor of two using structured illumination microscopy.” J. Microsc. 198, 82–87 (2000). M. G. Gustafsson, “Nonlinear structured-illumination microscopy: wide-field fluorescence imaging with theoretically unlimited resolution,” Proc. Natl. Acad. Sci. U.S.A. 102, 13081–13086 (2005).


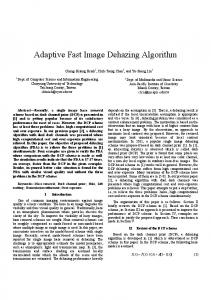
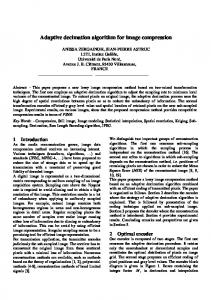


![2mm Blind Image Deconvolution [PDF]](https://m.moam.info/img/260x300/2mm-blind-image-deconvolution-pdf_6479ba83098a9e024f8b45f4.jpg)


