Airborne measurements in a stable boundary layer over the Larsen Ice Shelf, Antarctica
J.C. King, T.A. Lachlan-Cope, R.S. Ladkin and A. Weiss British Antarctic Survey Cambridge, UK
Corresponding author J.C. King British Antarctic Survey High Cross Madingley Rd., Cambridge CB3 0ET UK Tel: +44 1223 221487 Fax: +44 1223 221279 Email:
[email protected]
Submitted to Boundary-Layer Meteorology July 2007 Revised, February 2008
Airborne measurements in a stable boundary layer over the Larsen Ice Shelf, Antarctica
1
Abstract
We present aircraft measurements of boundary layer structure and surface fluxes from a flight over the Larsen Ice Shelf, Antarctica. Warm advection, associated with föhn flow, led to the formation of a stable boundary layer over the ice shelf, with a very sharp low-level jet at the top of the surface inversion. The strong shear associated with the jet kept the gradient Richardson number small and maintained a turbulent boundary layer over a depth of at least 600 m. The net energy balance at the surface was 52 W m-2, equivalent to a melt rate of 13 mm water per day. Net radiation (48 W m-2) made the largest contribution to melt. The contribution from the sensible heat flux (13 W m-2) was largely balanced by an upwards flux of latent heat (–9 W m-2). These measurements provide insight into the processes that control surface melt rates in an area that has experienced recent rapid warming and deglaciation.
Keywords: Airborne measurements, Antarctic, Orographic flows, Stable boundary layer,
2
1. Introduction
Stable boundary layers (SBLs) are a common feature of the atmosphere in the polar regions. During the winter season, when the solar elevation at high latitudes is small or even negative, strongly-stable boundary layers can persist for periods of many days. This lack of diurnal variability, together with the availability of flat and uniform snow and ice surfaces, has encouraged researchers to use polar sites as “natural laboratories” for studying the SBL under idealised conditions (e.g. King, 1990; Heinemann, 2004). During the summer months insolation increases at high latitudes and polar boundary layers are generally only weakly stably-stratified or even weakly unstable (Mastrantonio et al., 1999). However, SBLs can develop during summer as a result of relatively warm (T > 0oC) air being advected over a snow or ice surface. In the absence of meltwater ponding, the surface temperature cannot rise above 0oC so a SBL develops, with the downward sensible heat flux contributing to melting and sublimation at the snow surface. Advective SBLs of this type are relatively uncommon in Antarctica as the surface temperatures of the seas that surround the continent are generally only slightly above freezing point even during the summer. The northernmost parts of the Antarctic Peninsula do, however, experience warm air advection events during the summer. This part of Antarctica has experienced rapid warming over the past 50 years (King et al, 2004) which has led, in turn, to significant deglaciation (Vaughan et al., 1996; Cook et al., 2005). Marshall et al. (2006) suggest that warm air advection events have become more common in the northeast part of the Antarctic Peninsula in response to a strengthening of the circumpolar westerly winds, which has increased the frequency
3
with which warm air masses are able to cross the mountain barrier of the Antarctic Peninsula. In this paper we report aircraft-based observations of a SBL that formed in response to a warm air advection event over the Larsen Ice Shelf on the eastern side of the Antarctic Peninsula in January 2006. As well as providing information on regional climate processes, these observations provide more general insight into the structure and behaviour of a SBL capped by a strong low-level jet. Such jets appear to be a fairly ubiquitous feature of SBLs but aircraft observations under such conditions are relatively rare. Our measurements, therefore, complement observations of jetcapped SBLs made at lower latitudes (e.g. Banta et al., 2006).
4
2. Description of the study area
The Larsen Ice shelf (Figure1) is an extensive area of floating glacial ice that fringes the eastern side of the Antarctic Peninsula. As the ice is floating the surface slope is small and the ice surface is very uniform in character, although localised surface melting in summer can generate some inhomogeneity. At its widest, the ice shelf extends some 200 km to the east of the mountains of the Antarctic Peninsula. These mountains take the form of a steep, north-south trending barrier, less than 100 km in width but rising to between 1500 and 2000 masl, which forms an important climatic divide (King and Turner, 1997). A topographic section across the mountain barrier in the vicinity of our study area is shown in Figure 2. The west coast of the Antarctic Peninsula frequently experiences relatively warm westerly or northwesterly flows which originate over the Pacific sector of the Southern Ocean. These air masses are generally stably-stratified so the Antarctic Peninsula mountains provide an effective barrier to their eastward flow. As a result of this orographic blocking, the region to the east of the barrier, including the Larsen Ice Shelf, is usually under the influence of cold air masses originating over the Antarctic continent. These frequently take the form of a barrier jet blowing from south to north along the east side of the mountain barrier (Parish, 1983). Consequently, annual mean temperatures on the east coast are 5 - 10 oC lower than those at a comparable latitude on the west coast (Morris and Vaughan, 2003). On occasions when the westerlies are sufficiently strong, warm air masses are able to cross the mountain barrier (Orr et al., 2004; Marshall et al., 2006). Under such conditions, the surface temperature gradient across the Peninsula is much smaller and temperatures over the Larsen Ice Shelf are higher than average. During the summer
5
season, such conditions can lead to high surface melt rates (van den Broeke, 2005). The highest temperatures occur when the upstream flow is partially blocked and the eastern side of the Peninsula barrier comes under the influence of adiabaticallywarmed air descending in a föhn flow. The observations described in this paper were made under such conditions.
6
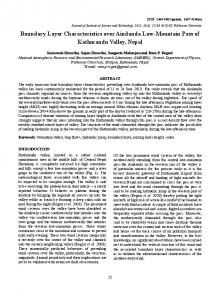
Figure 1. A map of the study area, showing part of the Antarctic Peninsula and the Larsen Ice Shelf to the east. The L-shaped line A-B-C marks the track over which aircraft measurements were made and the heavy broken line marks the line of the topographic section shown in Figure 2. “R” is Rothera Research Station. The small inset map shows the location of the study area within the Antarctic Peninsula.
Figure 2. A topographic section along the line shown on Figure 1 .
7
3. Aircraft instrumentation and data processing
Measurements were made using an instrumented DHC6 Twin Otter aircraft operated by the British Antarctic Survey. Static pressure, dynamic pressure and total temperature were measured using standard aircraft sensors. Humidity measurements were made using a cooled-mirror hygrometer and a Vaisala Humicap sensor. The former sensor was not working correctly on the flight described in this paper and all humidity values have been derived from the Humicap. Upwelling and downwelling long- and shortwave radiation were measured using Eppley pyranometers and pyrgeometers mounted on the cabin roof and under the belly of the aircraft. The temperature of the surface over which the aircraft was flying was measured using a downward-looking Heitronics KT19.82 infrared thermometer. A downward-pointing video camera provided a record of surface conditions. High frequency (50 Hz) timeseries of all three components of air motion relative to the aircraft were computed from measurements made using a Best Aircraft Turbulence (BAT) probe (Garman et al., 2006) mounted on the end of a boom which extended from the cabin roof to just forward of the aircraft nose. This probe incorporates sensors for dynamic and static pressure, together with differential pressure sensors for computing attack and sideslip angles, and a thermocouple sensor for fast-response temperature measurements. All BAT probe sensors were low-pass filtered at 30 Hz and then oversampled at 1600 Hz to avoid aliasing before block averaging to provide data at 50 Hz. Measurements of all three components of aircraft position, attitude and velocity were provided at a rate of 20 Hz by a JAVAD AT4 four-antenna GPS system. At the aircraft’s level-flight airspeed of 63 m s-1, the 50 Hz sampling of the BAT probe corresponds to a sampling interval of 1.26 m.
8
Data from all instruments were recorded on an onboard computer system. Data from the BAT probe were recorded at 50 Hz, all other instruments were sampled at rates between 0.7 and 5 Hz. GPS time signals from the JAVAD system were used to provide a common timebase for all sensors. Calculation of corrected temperatures and of wind components in an Earthreferenced frame was carried out according to standard procedures (e.g. Lenschow, 1986). Briefly, measurements of true air speed, angle of attack and sideslip angle from the BAT probe were used to compute wind components relative to the aircraft. Attitude data from the GPS system were then used to rotate these components onto earth-referenced axes. Finally, the components of aircraft motion output by the GPS system were subtracted to give earth-referenced wind components. The vertical component of the wind was corrected for the effects of flow distortion around the aircraft using the procedure of Crawford et al. (1996). Optimal calibration coefficients for the BAT probe were determined by flying a series of calibration manoeuvres (Lenschow, 1986). Manufacturer-supplied calibrations were used for all other instruments. Downwelling shortwave radiation was corrected for aircraft attitude variations using the procedure of Bannehr and Glover (1991), assuming clear sky conditions (as was appropriate for this flight). A small correction was applied to the measured upwelling shortwave radiation to account for the fraction of the instrument’s field of view that was obscured by the aircraft undercarriage. On the flight described in this paper, the dynamic pressure sensor on the BAT probe malfunctioned, probably as a result of water or ice blocking the port. Winds were, therefore, computed using the dynamic pressure measured at a standard pitot tube mounted on the aircraft nose. As this sensor was only sampled at 1 Hz, there may be some loss of high-frequency variance in the computed wind components.
9
However, comparison of turbulence statistics on other flights when both sensors were working indicates that using pitot pressure rather than BAT pressure has negligible impact on the calculated vertical velocity variance and heat fluxes and results in a reduction of approximately 10% in the variance of the horizontal components of velocity. We therefore conclude that turbulence statistics computed using pitot dynamic pressure are sufficiently accurate for our purposes.
10
4. Observations 4.1 FLIGHT PATTERNS
The aircraft took off from Rothera Research Station (67.6S, 68.1W, marked “R” on Figure 1) at 1920 UTC on 6 January 2006 and climbed to an altitude of 3000 m before flying eastwards across the mountains of the Antarctic Peninsula. At 2015 UTC (approximately 1600 local solar time) the aircraft began a slant descent from this level to an elevation of 15 m above the ice shelf surface. A series of “L”-shaped level legs, shown on Figure 1, were then flown to characterise the properties of the boundary layer. The first leg, flown at an elevation of 15 m, commenced at point “A” (67.14S, 61.66W) which is about 50 km west of the ice shelf edge and 130 km east of the eastern foot of the Antarctic Peninsula mountains. From point “A”, the aircraft flew approximately northwards for 40 km to point “B” (66.79S, 61.35W), then turned 90o to the left and continued approximately westward for a further 40 km to point “C” (66.69S, 62.22W). Point “C” is approximately 80 km east of the foot of the main Peninsula mountain chain but is less than 10 km from Cape Alexander at the tip of the Churchill Peninsula, a low promontory that extends southeastwards into the Larsen Ice Shelf from the main mountain chain. At point “C”, the aircraft ascended to 152 m and flew the leg in reverse (i.e. C-B-A). The aircraft then flew A-B-C at 305 m, followed by C-B-A at 610 m. On reaching point “A” at 2156 UTC, a slant descent was made to 15 m before the aircraft commenced its climb back to 3000 m for the return flight to Rothera.
11
4.2 SYNOPTIC CONDITIONS
Synoptic charts for 6 January 2006 show a weak ridge of mean sea level pressure (mslp) to the west of the Antarctic Peninsula and rather small gradients of mslp around the study area. Surface observations at the time of the measurements are consistent with this analysis. An automatic weather station on the Larsen Ice Shelf (at 67.0S, 61.6W) indicated surface winds of 2 – 5 ms-1 from a westerly to northwesterly direction at the time of the aircraft observations while, at Rothera Research Station to the west of the Peninsula, surface winds were light and variable. The 500 hPa level analysis indicated a westerly flow of around 15 ms-1 above the mountains of the Antarctic Peninsula, which is consistent with the winds measured at 3000 m during the aircraft transit to the study area. Radiosonde observations from Rothera for 20022008 indicate that this 500 hPa westerly wind speed is equalled or exceeded for about 10% of the time during the months of December and January. Figure 3 compares the vertical profile of potential temperature obtained during the aircraft's ascent from Rothera (i.e. to the west of the Peninsula mountains) with that obtained during the initial descent to the Larsen Ice Shelf (i.e. to the east of the mountains). The atmosphere is stably stratified on both sides of the mountain barrier. However, at a given level, potential temperatures are higher on the east (downwind) side than the west (upwind) side, with the strongest warming on the downwind side occurring below the level of the crest of the Peninsula mountains (about 2000 m at this point). The corresponding relative humidity profiles (not shown) indicate that, below the height of the mountain barrier, air on the downwind side is significantly drier than air at the same level on the upwind side.
12
The presence of warmer, drier air on the downwind side of the mountains suggests that a föhn event was in progress at the time of the observations. The Froude number of the upwind flow, Fr, can be calculated as
Fr = u h /( ghΔθ / θ ) 0.5
(1)
where h is the height of the mountain barrier, uh is the component of windspeed perpendicular to the barrier at height h, Δθ is the potential temperature difference between the surface and height h and θ is the mean potential temperature. Our measurements show that Fr was about 0.24. However, the effective value of Fr may be even lower than this since the upstream flow was highly baroclinic, with the westerly component of the wind decreasing towards the surface. At such a low value of Fr, classical non-rotating hydraulic theory predicts that flow over the Peninsula mountains should be completely blocked. However, Orr et al. (2007) have shown that the influence of the Earth’s rotation can lead to some flow over the Peninsula mountains at low values of Fr. At the time of our observations there was clearly some airflow across the Peninsula. Adiabatic warming of this air as it subsided to the east of the Peninsula mountains then gave rise to the relatively warm and dry “föhn” conditions observed over the Larsen Ice Shelf.
13
Figure 3. Vertical profiles of potential temperature measured during the ascent of the aircraft from Rothera (thick line) and during the initial descent over the Larsen Ice Shelf (thin line).
14
4.3 VERTICAL PROFILES OF THE MEAN FLOW
Figure 4 shows the temperature profile recorded during the lowest 1500 m of the initial descent to point “A”. The most notable feature of this profile is a surface-based inversion, extending up to an altitude of around 270 m above the surface of the ice shelf. This inversion results from the advection of relatively warm (T > 0 oC) air over the cold surface (T≤ 0 oC) of the ice shelf. The temperature difference measured between 270 m and the lowest level reached on the profile (approximately 15 m) is 2.6 oC. However, given that we would expect the surface of the ice shelf to be close to freezing point, the total inversion strength is probably nearer 4.6 oC. Above the surface inversion, the atmosphere remains stably stratified. Corresponding profiles of wind speed and direction are shown in Figure 5. A very sharp low-level jet is present in the lower part of the profile, with a maximum recorded wind speed of about 15 m s-1 at approximately 250m, which corresponds closely to the top of the surface inversion. There is strong directional shear associated with this jet. At the lowest point on the profile, the wind is westerly but becomes nearly southerly around the jet maximum. Above the jet, wind speeds are in the range 8-10 m s-1, blowing from a westerly to southwesterly direction. Also shown on figure 5 are profiles of wind speed and direction at 1800 UTC as simulated by the Antarctic Mesoscale Prediction System (AMPS, Bromwich et al., 2005) run at 7 km resolution and initialised at 0000 UTC. AMPS captures the structure of the jet quite well, although it is weaker and shallower than in the observations. We discuss possible origins for this jet in section 5 below. Some changes are apparent between profiles recorded during the initial descent to point “A” and those recorded during the final descent to point “A” at the end of the
15
final flight leg. While the sharp jet was still present in the final profile, the jet maximum (reduced to 12 m s-1) rose to 350 m. Potential temperatures in the stable layer increased by about 1oC between the two profiles. A profile of gradient Richardson number, Ri, calculated from the observed wind and temperature profiles is shown in Figure 6. As there is significant variation in wind direction through the profile, we calculate Ri using the magnitude of vector wind shear: g ∂θ ⎛⎜ ∂u 2 ∂v 2 ⎞⎟ Ri = + ∂z ⎟⎠ θ ∂z ⎜⎝ ∂z
−1
(2)
where u and v are respectively the westerly and southerly components of the wind speed and θ is the potential temperature. Vertical gradients of wind components and potential temperature were evaluated by fitting piecewise linear functions of height to the measurements over layers of 50 – 100 m thickness. Ri remains small from the lowest point on the profile upwards through the jet, the strong directional shear and extreme sharpness of the jet preventing a singularity at the wind speed maximum. Above the jet, Ri starts to increase, reaching a maximum of around 0.7 at 850 m.
16
Figure 4. Temperature profile recorded in the lowest 1500 m of the initial descent to point “A” on the Larsen Ice Shelf. Altitudes in this (and subsequent) figures are relative to the surface of the ice shelf. The thin line indicates the dry adiabiatic lapse rate and the dashed lines show the heights at which the level flight legs were flown.
Figure 5. Profiles of wind speed (bold) and wind direction (light) from the initial descent to point “A” on the Larsen Ice Shelf. The dotted lines with symbols show
17
profiles of wind speed (plus signs) and direction (asterisks) at this point as simulated in Antarctic Mesoscale Prediction System operational forecasts.
Figure 6. Gradient Richardson number profile (calculated for layers of 50 – 100 m thickness) over the lowest 1500 m of the initial descent to point “A”.
18
4.4 SPATIAL VARIABILITY IN SURFACE CHARACTERISTICS
Examination of the record from the downward-pointing video camera shows that the surface of the ice shelf beneath the flight legs was very uniform apart from occasional crevasses. No meltwater ponds were apparent on the camera record, suggesting that melt rates were relatively low at the time of the observations. Consistent with these observations, the albedo (Figure 7) shows little variation along the flight track. The surface temperature record from the infrared thermometer (Figure 7) does, however, reveal some spatial variability. Surface temperatures were close to 0 oC along most of leg A-B but started to fall as point “B” was approached. Along leg B-C, surface temperatures were generally lower (minimum about –1 oC) and more variable than along leg A-B, reaching 0 oC only over very short sections of this leg. Flight level data show considerable temperature variability at 15 m and somewhat more uniform conditions above this level. Air temperatures at 15m (Figure 7) were generally around +2 oC and very variable. However, there are two notable sections where the air temperature was lower and somewhat less variable. The first of these sections, between 39 and 51 km along the flight track, corresponds approximately to a region of reduced surface temperature, while the second, from 66 to 74 km, is less clearly associated with surface temperature variations. Both sections correspond to regions of reduced wind speed at flight level. Air temperatures measured along the higher legs show much less variability than is seen at 15 m and what variability there is does not correlate strongly with that at 15 m.
19
Figure 7. Variation along the 15 m flight leg of (a) surface temperature, (b) air temperature at flight level and (c) albedo, all plotted against distance along the flight track from point “A”.
4.5 TURBULENCE STRUCTURE
Turbulence statistics were calculated over flight segments of approximately 4 km after removing trends over the segment with a second-order polynomial fit. Trials with different segment lengths showed that for segments of less than 1 km, momentum fluxes were significantly reduced while, for segments greater than 4 km, turbulence kinetic energy increased as a result of the inclusion of mesoscale motions. Mean turbulence statistics for each flight leg were then calculated by averaging the statistics from each 4 km segment within a leg. Figure 8 shows the profile of turbulence kinetic energy (TKE)
e = 0.5(u ' u '+v' v' + w' w')
(3)
20
where u’, v’, and w’ are the fluctuating components of eastwards, northwards and upwards velocity, respectively. e is largest along the lowest flight leg and decreases rather slowly with height. The flow is still clearly turbulent at 605 m. This is consistent with the profile of gradient Richardson number (Figure 6), which shows low values of Ri persisting up to this level. The temperature variance,
σ 2 = T 'T '
(4)
T
where T’ is the fluctuating component of temperature, follows a rather different profile (Figure 8). σT2 is very large along the lowest flight leg, with smaller, nearconstant values measured along the three higher legs. The very high value of σT2 at 15 m may reflect the fact that the vertical temperature gradient at that level is an order of magnitude greater than that at the altitude of the higher legs. Hunt et al. (1985) proposed that, under strongly-stable conditions, a robust scaling for temperature fluctuations is given by
σ T /(∂T / ∂z ) ≈ ζ T σ w / N
(5)
where N is the Brunt-Väisälä frequency and ζT is a parameter of order unity. Hunt et al. (1985) found that equation (5) with ζT ≈ 0.8 provided a good fit to data collected under stable conditions from the tower at the Boulder Atmospheric Observatory. Values of ζT calculated for the upper three of our flight levels (Figure 9) are significantly smaller than the value found by Hunt et al. (1985) and show some 21
tendency to increase with height. The value for the 15 m flight level is closer to Hunt et al.’s value but is significantly larger than the values we calculate at the three higher levels. As the temperature gradient is so strong close to the ground, it is possible that small variations in the height of the aircraft above the ground are generating additional variability in the measured temperature that is artificially increasing our estimate of σT at this level. The standard deviation of the absolute altitude of the aircraft, σz, as measured by the GPS system, was about 3 m along the 15 m flight level and we estimate that the vertical temperature gradient at this level, ∂T/∂z, is 0.13 K m1
. The measured correlation coefficient between temperature and absolute altitude
along this leg, rzT , is 0.25 ± 0.08. An estimate of the contribution of aircraft height variations to σT is given by rzT. σz.∂T/∂z ≈ 0.1 K, which is about one third of the measured value. We conclude that vertical aircraft motions may be significantly enhancing observed temperature variability at 15 m. Figure 10 shows the vertical profile of the local friction velocity u*, i.e. the square root of the magnitude of the kinematic stress, defined through
2
2
u* = (u ' w' + v' w' ) 0.25
(6)
The profile of u* is similar to that of e, although the measurements appear to show a maximum of u* at the 152 m level. Measurements of u* at 15 m may be erroneously low due to a loss of high-frequency covariance resulting from the use of a slow-response dynamical pressure sensor on this flight. Calculation of u* for the 15 m flight leg from bulk formulae (discussed in section 4.6 below) yields a value of 0.17 m s-1, which is more consistent with a value obtained by downward extrapolation of measurements from the higher flight legs.
22
Mean kinematic heat fluxes, w'T ' (Figure 11), are small at all levels and show a great deal of variability along the flight legs, particularly at the 15 m level. Estimates of the sensible heat flux, Hs, along this leg using bulk formulae (see section 4.6) give Hs=13 ± 5 W m-2, equivalent to a kinematic heat flux of –0.001 K m s-1, which is significantly larger in magnitude than the eddy correlation measurement. It is possible that the temperature fluctuations associated with variations in aircraft height (discussed above) may be biasing the eddy correlation estimates of heat flux. Accurate measurement of such small heat fluxes by eddy correlation from an airborne platform is quite challenging and it is likely that the discrepancy between the bulk formula and eddy correlation estimates of heat flux simply reflect limitations in overall system accuracy.
23
Figure 8 TKE (triangles) and temperature variance (squares) for the four level flight legs. The points are mean values for all 4 km segments within a leg and error bars indicate ± one standard error of these means. The lowest temperature variance point has been plotted at an altitude of 30 m to improve the clarity of the figure.
Figure 9 The temperature fluctuation parameter, ζT of Hunt et al.(1985), as defined in equation (5), for the four level flight legs. The points are mean values for all 4 km segments of the leg, error bars indicate ± one standard error of these means.
24
Figure 10. Local friction velocity (equation 6) for the four level flight legs. The points are mean values for all 4 km segments of the leg, error bars indicate ± one standard error of these means.
Figure 11. Kinematic heat flux for the four level flight legs. The points are mean values for all 4 km segments of the leg, error bars indicate ± one standard error of these means.
25
4.6 SURFACE ENERGY BALANCE
The energy balance at the surface of the ice shelf is given by:
M = SW ↓ + SW ↑ + LW ↓ + LW ↑ + H s + H L
(7)
Where M is the energy flux available for warming and melting the ice shelf, SW↓ and SW↑ are the downwelling and reflected shortwave radiation, LW↓ and LW↑ are the downwelling and upwelling longwave radiation, Hs is the sensible heat flux, HL is the latent heat flux. Our sign convention is that energy fluxes directed towards the surface are positive. Measurements made along the 15 m flight leg allow us to estimate all of the terms on the right hand side of equation (7) and we show mean values for these fluxes in table 1. Because of concerns over the reliability of eddycorrelation heat flux measurements for this flight and the lack of fast-response humidity measurements, both Hs and HL were estimated from measurements of wind speed, air temperature and humidity at flight level along with surface temperature measured by the infrared thermometer using the bulk formulae of King et al. (1996). We assumed that the air at the surface was saturated with respect to ice at the measured surface temperature and, in accordance with measurements over other Antarctic ice shelves (e.g., King, 1990) we set the roughness lengths for both momentum and scalars to 0.0001 m . Along the 15 m leg, the net shortwave flux was positive but relatively small due to the high albedo of the ice shelf surface. The albedo (0.78) is typical of that measured over snow surfaces in the warmer regions of the Antarctic (e.g. van den Broeke et al., 2004). Gain of energy by shortwave radiation exceeded longwave loss
26
by 48 W m-2. Sensible heat flux contributed a further 13 W m-2 to the energy available for melting but this was largely balanced by an upwards latent heat flux of 9 W m-2. Hs and HL both varied considerably along the flight leg, largely as a result of variations in the air-to-surface temperature difference (see Figure 7). The relatively large negative latent heat fluxes resulted from the low humidity of the near-surface air which originated at upper levels and descended in the föhn flow. Summing these fluxes gives M = 52 W m-2. If the upper part of the ice shelf is isothermal at the melting point, all of this energy will be used to drive melting, giving an equivalent melt rate of 13 mm of water per day. The peak melt rate during this day was probably somewhat higher since the flight took place approximately 4 hours after local apparent noon, when SW↓ would have reached its peak.
27
Flux SW↓ SW↑ SWnet= SW↓+ SW↑ α = SW↑/ SW↓ LW↓ LW↑ LWnet= LW↓+ LW↑ Rnet= SWnet+LWnet Hs HL M=Rnet+Hs+HL
Mean (W m-2) 568 –441 127 0.78 237 –316 –79 48 13 –9 52
Standard deviation (W m-2) 7 7 3 0.01 5 4 4 6 5 5 4
Table 1. Components of the surface energy balance along the 15 m flight leg.
28
5. Discussion
Our measurements reveal that, on 6 January 2006, warm air advection associated with a föhn event generated a stable boundary layer (SBL) over the Larsen Ice Shelf. While the depth of the surface inversion ( ~ 250 m) was comparable with that seen in nocturnal boundary layers with moderate wind speeds, the depth of the SBL, as defined by the TKE profile, exceeded 600 m. The persistence of turbulence up to such high levels was explained by the presence of strong vertical shear in the horizontal wind vector, associated with a strong low-level jet (15 m s-1 maximum wind speed at 250 m elevation). This wind shear maintained a gradient Richardson number of less than 0.3 throughout the lowest 600 m despite the presence of a strong stable potential temperature gradient. The mechanisms responsible for the formation and maintenance of the jet are not immediately apparent from our measurements. Low-level jets are a common feature of nocturnal SBLs (e.g. Banta et al., 2006), where they develop as a result of inertial adjustment of the wind profile to changing turbulent transport (Thorpe and Guymer, 1977), sometimes with additional forcing from baroclinicity and cold-air drainage effects (Caughey et al., 1979; King, 1989). While our measurements show considerable mesoscale variability in the structure of the jet, there is no clear indication of rotation of the wind vector along a flow line that would be suggestive of inertial adjustment as the flow leaves the Peninsula mountains and moves eastward across the Larsen Ice Shelf. Another possibility is that the jet is driven by the interaction of the large-scale flow with the mountain barrier. The westerly flow prevailing at the time of our observations would not support the barrier jet described by Parish (1983). However, Orr et al. (2007) note the formation of a strong, southerly
29
“lee jet” in laboratory and numerical modelling studies of stratified, rotating westerly flow across the Antarctic Peninsula. We have already noted that the structure of the jet is reproduced well by the AMPS forecast model. On the day of our observations, AMPS fields show a low-level westerly jet over the eastern slopes of the Antarctic Peninsula mountains associated with strong downslope föhn flow. Over much of the region the jet does not extend beyond the foot of the mountains. However, in the area of our aircraft measurements, the pressure gradient associated with a mesoscale low pressure system centred around 68oS, 55oW supports propagation of the jet away from the mountains and across the Larsen Ice Shelf. We therefore conclude that the jet results from a combination of orographic forcing and synoptic support. The jet appears to play an important role in determining the turbulent structure of the boundary layer by maintaining strong wind shear throughout a relatively deep layer. Mahrt and Vickers (2002) identified two contrasting forms of SBL: “traditional”, where shear production of TKE is greatest close to the ground and TKE decreases with height, and “upside-down”, where there is shear production associated with an elevated jet and TKE increases with height below the jet maximum. Despite the presence of a strong elevated jet, turbulence structure in our SBL most closely resembles that of the “traditional” SBL, with a TKE maximum close to the ground. Unlike the “upside-down” cases studied by Mahrt and Vickers (2002) and Banta et al. (2006), we observe strong shear throughout the layer between the ground and the jet maximum. The Richardson number remains low throughout this layer and there does not appear to be any decoupling of the ground-based shear layer and the shear layer just below the jet maximum. Our measurements reveal significant spatial and temporal variability in boundary layer structure, particularly at the lowest flight level. Although the surface
30
temperature measurements indicate a small degree of inhomogeneity, temperature variations at the lowest flight level are much larger than those at the surface and probably reflect mesoscale variability of the flow rather than surface variability. Such mesoscale complexity is a well-known feature of SBLs over somewhat inhomgeneous terrain, such as the SBLs observed during the CASES-99 study (Poulos et al., 2002). Our measurements, made over a very level and uniform surface, suggest that some of the observed mesoscale variability is an intrinsic feature of the SBL and is not linked to surface inhomogeneity. This view is supported by observations of SBLs at Halley Research Station on the Brunt Ice Shelf, that also show considerable mesoscale complexity despite the uniformity of the underlying surface (Anderson, 2003). At the time of our measurements, a net energy flux of 52 W m-2 was available for melting the ice shelf . The greatest contribution (92%) to the melt rate comes from the net radiative flux. Sensible heat flux contributes about 25% of the total melt rate but this is largely balanced by the latent heat flux, which removes heat equivalent to 17% of the melt rate from the surface. The measured net energy flux is equivalent to a melt rate of approximately 13 mm water equivalent per day. However, as there will be a strong diurnal cycle in the radiative fluxes, the daily averaged melt rate is likely to be considerably lower than this. van den Broeke (2005) made climatological estimates of melt rate over the Larsen Ice Shelf using measurements from an automatic weather station (AWS) together with simple parametrisations for the radiative and turbulent energy fluxes. He found that melt rate was a strong function of surface wind direction, with the largest average melt rates (3 – 4 mm day-1) occurring for winds from the northwesterly sector. Melt energy calculated from the AWS shows a strong diurnal cycle, with M typically around 50 W m-2 at the time of day (1600 local solar time) of our measurements (M. van den Broeke, personal communication, 2007). Our
31
measurements of melt energy thus appear to be broadly consistent with climatological estimates from AWS data. As no humidity measurements were available from the AWS, van den Broeke (2005) was unable to calculate the contribution of the latent heat flux to the melt rate. Our results suggest that, under föhn conditions, the near-surface air is very dry and there is near balance between the (downwards) sensible heat flux and (upwards) latent heat flux. The melt rates calculated by van den Broeke (2005) are thus likely to overestimate M by around 20% under such circumstances. Improved AWS measurements, including humidity measurements, are needed to provide better climatological estimates of melt rates in this region. Further aircraft measurements will help to clarify how the melt rates are controlled by the large-scale atmospheric flow.
Acknowledgements
Procurement and installation of the Twin Otter instrumentation was managed by M. Massucci. We thank D. Blake, J. French, G. Nicholson and S. Parker for their advice and assistance with this project. A. Orr provided us with useful insight into the interaction of the large-scale flow with the Peninsula orography. D. Bromwich and D. Steinhoff provided data from the AMPS model. We thank M. van den Broeke and an anonymous referee for helpful comments on the original manuscript. The measurements described in this paper would not have been possible without the enthusiastic and dedicated support of the BAS Air Unit, the Field Operations team and others at Rothera Research Station. We thank pilot M. Beasley for skilfully carrying out our flight plan.
32
References
Anderson, P. S. (2003) Fine-scale structure observed in a stable atmospheric boundary layer by Sodar and kite-borne tethersonde. Boundary-Layer Meteorol., 107, 323351. Bannehr, L. and V. Glover (1991) Preprocessingof airborne pyranometer data. NCAR Technical Note NCAR/TN-364+STR. National Center for Atmospheric Research, Boulder, CO. 35pp Banta, R. M., Y. L. Pichugina, and W. A. Brewer (2006) Turbulent velocity-variance profiles in the stable boundary layer generated by a nocturnal low-level jet. J. Atmos. Sci., 63, 2700-2718. Bromwich, D. H., A. J. Monaghan, K. W. Manning, and J. G. Powers (2005) Realtime forecasting for the Antarctic: An evaluation of the Antarctic Mesoscale Prediction System (AMPS). Mon. Wea. Rev., 133, 579-603 Caughey, S. J., J. C. Wyngaard, and J. C. Kaimal (1979) Turbulence in the evolving stable boundary layer. J. Atmos. Sci., 36, 1041-1052. Cook, A. J., A. J. Fox, D. G. Vaughan, and J. G. Ferrigno (2005) Retreating glacier fronts on the Antarctic Peninsula over the past half-century. Science, 308, 541544. Crawford, T. L., R. J. Dobosy, and E. J. Dumas (1996) Aircraft Wind Measurement Considering Lift-Induced Upwash. Boundary-Layer Meteorol., 80, 79-94. Garman, K. E., K. A. Hill, P. Wyss, M. Carlsen, J. R. Zimmerman, B. H. Stirm, T. Q. Carney, R. Santini, and P. B. Shepson (2006) An airborne and wind tunnel evaluation of a wind turbulence measurement system for aircraft-based flux measurements. J. Atmos. Ocean. Tech., 23, 1696-1708.
33
Heinemann, G. (2004) Local similarity properties of the continuously turbulent stable boundary layer over Greenland. Boundary-Layer Meteorol., 112, 283-305. Hunt, J. C. R., J. C. Kaimal, and J. E. Gaynor (1985) Some observations of turbulence structure in stable layers. Quart. J. Roy. Meteorol. Soc., 111, 793-815. King, J. C. (1989) Low-level wind profiles at an antarctic coastal station. Antarctic Science, 1, 169-178. King, J. C. (1990) Some measurements of turbulence over an antarctic ice shelf. Quart. J. Roy. Meteorol. Soc., 116, 379-400. King, J. C. and J. Turner (1997) Antarctic Meteorology and Climatology. Cambridge University Press, Cambridge, 409 pp. King, J. C., P. S. Anderson, M. C. Smith, and S. D. Mobbs (1996) The surface energy and mass balance at Halley, Antarctica during winter. J. Geophys. Res., 101, 19119-19128. King, J. C., J. Turner, G. J. Marshall, W. M. Connolley, and T. A. Lachlan-Cope (2004) Antarctic Peninsula Climate Variability And Its Causes As Revealed By Analysis Of Instrumental Records. Antarctic Peninsula Climate Variability: A historical and Paleoenvironmental Perspective, E. Domack, A. Burnett, P. Convey, M. Kirby, and R. Bindschadler, Eds., American Geophysical Union, Washington, DC, 17-30. Lenschow, D. H. (1986) Aircraft measurements in the boundary layer. Probing the atmospheric boundary layer, D. H. Lenschow, Ed., American Meteorological Society, Boston, MA, 39-55. Mahrt, L. and D. Vickers (2002) Contrasting vertical structures of nocturnal boundary layers. Boundary-Layer Meteorol., 105, 351-363.
34
Marshall, G. J., A. Orr, N. van Lipzig, and J. C. King (2006) The impact of a changing Southern Hemisphere Annular Mode on Antarctic Peninsula summer temperatures. J. Climate, 19, 5388--5404. Mastrantonio, G., V. Malvestuto, S. Argentini, T. Georgiadis, and A. Viola (1999) Evidence of a convective boundary layer developing on the Antarctic Plateau during the summer. Meteorol. Atmos. Phys., 71, 127-132. Morris, E. M. and D. G. Vaughan (2003) Spatial and temporal variation of surface temperature on the Antarctic Peninsula and the limit of viability of ice shelves. Antarctic Peninsula Climate Variability: A historical and Paleoenvironmental Perspective, E. Domack, A. Burnett, P. Convey, M. Kirby, and R. Bindschadler, Eds., American Geophysical Union, Washington, DC, 61-68. Orr, A., D. Cresswell, G. J. Marshall, J. C. R. Hunt, J. Sommeria, C. G. Wang, and M. Light (2004) A 'low-level' explanation for the recent large warming trend over the western Antarctic Peninsula involving blocked winds and changes in zonal circulation. Geophys. Res. Lett., 31, art. no.-L06204. Orr, A., G. J. Marshall, J. C. R. Hunt, J. Sommeria, C. G. Wang, N. P. M. van Lipzig, D. Cresswell, and J. C. King (2007) Characteristics of summer airflow over the Antarctic Peninsula in response to recent strengthening of westerly circumpolar winds. J. Atmos. Sci., (in press). Parish, T. R. (1983) The influence of the Antarctic Peninsula on the wind field over the western Weddell Sea. J. Geophys. Res., 88, 2684-2692. Poulos, G. S., W. Blumen, D. C. Fritts, J. K. Lundquist, J. Sun, S. P. Burns, C. Nappo, R. Banta, R. Newsom, J. Cuxart, E. Terradellas, B. Balsley, and M. Jensen (2002) CASES-99: A comprehensive investigation of the stable nocturnal boundary layer. Bull. Amer. Meteorol. Soc., 83, 555-581.
35
Thorpe, A. J. and T. H. Guymer (1977) The nocturnal jet. Quart. J. Roy. Meteorol. Soc., 103, 633-653. Van den Broeke, M. (2005) Strong surface melting preceeded collapse of Antarctic Peninsula ice shelf. Geophys. Res. Lett., 32, L12815, doi:10.1029/2005GL023247. Van den Broeke, M., C. Reijmer, and R. Van De Wal (2004) Surface radiation balance in Antarctica as measured with automatic weather stations. J. Geophys. Res., 109, D09103, doi:10.1029/2003JD004394. Vaughan, D. G. and C. S. M. Doake (1996) Recent atmospheric warming and retreat of ice shelves on the Antarctic Peninsula. Nature, 379, 328-330.
36
Figure Captions
Figure 1. A map of the study area, showing part of the Antarctic Peninsula and the
Larsen Ice Shelf to the east. The L-shaped line A-B-C marks the track over which aircraft measurements were made and the heavy broken line marks the line of the topographic section shown in Figure 2. “R” is Rothera Research Station. The small inset map shows the location of the study area within the Antarctic Peninsula.
Figure 2. A topographic section along the line shown on Figure 1 .
Figure 3. Vertical profiles of potential temperature measured during the ascent of the
aircraft from Rothera (thick line) and during the initial descent over the Larsen Ice Shelf (thin line).
Figure 4. Temperature profile recorded in the lowest 1500 m of the initial descent to
point “A” on the Larsen Ice Shelf. Altitudes in this (and subsequent) figures are relative to the surface of the ice shelf. The thin line indicates the dry adiabiatic lapse rate and the dashed lines show the heights at which the level flight legs were flown.
Figure 5. Profiles of wind speed (bold) and wind direction (light) from the initial
descent to point “A” on the Larsen Ice Shelf. The dotted lines with symbols show profiles of wind speed (plus signs) and direction (asterisks) at this point as simulated in Antarctic Mesoscale Prediction System operational forecasts.
37
Figure 6. Gradient Richardson number profile (calculated for layers of 50 – 100 m
thickness) over the lowest 1500 m of the initial descent to point “A”.
Figure 7. Variation along the 15 m flight leg of (a) surface temperature, (b) air
temperature at flight level and (c) albedo, all plotted against distance along the flight track from point “A”.
Figure 8 TKE (triangles) and temperature variance (squares) for the four level flight
legs. The points are mean values for all 4 km segments within a leg and error bars indicate ± one standard error of these means. The lowest temperature variance point has been plotted at an altitude of 30 m to improve the clarity of the figure.
Figure 9 The temperature fluctuation parameter, ζT of Hunt et al.(1985), as defined
in equation (5), for the four level flight legs. The points are mean values for all 4 km segments of the leg, error bars indicate ± one standard error of these means.
Figure 10. Local friction velocity (equation 6) for the four level flight legs. The
points are mean values for all 4 km segments of the leg, error bars indicate ± one standard error of these means.
Figure 11. Kinematic heat flux for the four level flight legs. The points are mean
values for all 4 km segments of the leg, error bars indicate ± one standard error of these means.
38