Alerts Visualization and Clustering in Network-based Intrusion Detection Swetha Dasireddy Wade Gasior Dept.of Comp. Sci. and Eng., University of TN at Chattanooga 735 Vine Street, Chattanooga,TN 37403,USA
[email protected] [email protected]
Xiaohui Cui
Li Yang
Applied Software Engineering Group
Dept.of Comp. Sci. and Eng.,
Computational Science and Engineering Division Oak Ridge National Laboratory Oak Ridge, TN, USA
University of TN at Chattanooga 735 Vine Street, Chattanooga,TN 37403,USA
[email protected]
ABSTRACT Today's Intrusion detection systems when deployed on a busy network overload the network with huge number of alerts. This behavior of producing too much raw information makes it less effective. We propose a system which takes both raw data and Snort alerts to visualize and analyze possible intrusions in a network. Then we present with two models for the visualization of clustered alerts. Our first model gives the network administrator with the logical topology of the network and detailed information of each node that involves its associated alerts and connections. In the second model, flocking model, presents the network administrator with the visual representation of IDS data in which each alert is represented in different color and the alerts with maximum similarity move together. This gives network administrator with the idea of detecting various of intrusions through visualizing the alert patterns.
Categories and Subject Descriptors C.2.0 [computer-communication networks]: Security and protection.
General Terms Security.
Keywords
[email protected]
1. INTRODUCTION Network based intrusion detection systems have proven to be useful for a wide variety of purposes ranging from identifying the anomalous users in a system to analyzing alerts in order to assist network administrators in determining the proper response procedure. The data produced by this network-based intrusion detection systems can be difficult for network administrators to efficiently review and respond to due to the enormous number of alerts generated on high-traffic networks. By processing alerts using clustering techniques and then visually presenting them to the end-user, intrusion detection systems can be improved such that useful, easily understandable output is produced resulting in quicker response decisions. This paper describes how the visualization of raw IDS alert data assists network administrators in understanding the current state of a network and quickens the process of reviewing and responding to intrusion attempts. The project presented in this paper consists of two primary visualization components. The first component provides a visual mapping of the network topology that allows the end-user to easily browse clustered alerts. The second component is based on the flocking behavior of birds such that birds tend to follow other birds with similar behaviors. This component allows the end-user to see the clustering process and provides an efficient means for reviewing alert data and identifying alerts that have been incorrectly classified by the intrusion detection system (false alarms).
Visualization, Flocking model, Intrusion detection
2. VISUALIZATION FRAMEWORK . Permission to make digital or hard copies of all or part of this work for personal or classroom use is granted without fee provided that copies are not made or distributed for profit or commercial advantage and that copies bear this notice and the full citation on the first page. To copy otherwise, or republish, to post on servers or to redistribute to lists, requires prior specific permission and/or a fee. CSIIRW’10, April 21–23, 2010, Oak Ridge, TN, USA. Copyright 2010 ACM 1-58113-000-0/00/0010…$10.00.
The IDS utilized in this project is Snort, a well-known and widely-used rule based intrusion detection system. Snort generates alerts by matching incoming packets against built-in rules. The alerts generated by Snort are placed in an output file for further analysis. Each entry in the output file lists several details associated with an alert, including the type of alert, the rule that generated the alert, the source and destination IP addresses and ports, and the time at which the alert was generated to millisecond precision. One shortcoming of Snort is the tremendous number of alerts that are generated when the tool is deployed on a busy network. The large number of alerts makes it difficult for network administrators to quickly decipher and respond to intrusion attempts. There is a need to reduce the number of alerts that the network administrator is presented with
by reducing false alarms and grouping similar alerts together. In our project, the log processing and alert clustering process is accomplished using server-side Java code, and the alerts are presented to the end-user using two separate front-end applications developed in Adobe Flex. The front-end applications communicate with the server-side application using the opensource Blaze DS framework. One front-end application presents a mapping of each node on the network that has generated an alert. The administrator can quickly get an overview of the traffic flow on the network and is able to see how many alerts each of these nodes has produced, when they were produced, and a detailed listing of each alert. The second front-end application presents a visual flocking model where each alert is represented by a colorcoded circle. Our project uses network traffic captured over a five day period involving over 300 different network nodes.
topology map is generated which allows the end user to efficiently access the details of network nodes and their associated alerts.
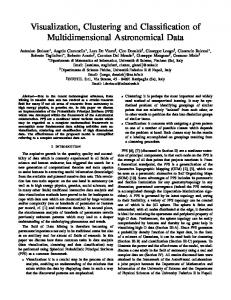
2.1 Network Topology Visualization The network traffic visualization component processed raw data into ASCII network packet information, which in turn was converted into connection-level information. These connection level records contained connection feature like service, duration, etc. Our model as shown in Figure 1 (a) is able to visualize logical topology and connection of whole network or a given host, therefore help to generate logical topology of a given network efficiently.
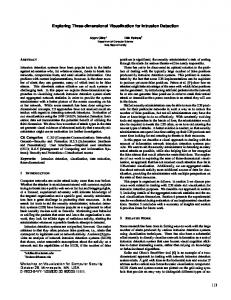
Figure 1(b). Topology Visualization based on alerts
2.2 Alert Clustering The major problem with today's intrusion detection systems is the sheer number of alerts generated, most of which are false alarms. It is a difficult task for network administrators to even attempt to review every alert that is produced by IDS on a busy network. As a result, many important alerts may be missed which can cause severe damage to network systems. By clustering alerts that are of the same root cause, share the same source and destination addresses, and vary in time by less than one second, the number of alerts can be substantially reduced. The root-cause analysis is performed using a similarity-based model of alert types. By applying this process to our network data, the raw log file of over 150,000 alerts was reduced to only 8,000. This process takes only a matter of a few seconds.
2.2.1 Flocking Model
Figure1(a).Topology visualization based on raw data The network traffic visualization component can also processes raw Snort alert data into a visual format that displays each node on the network and its associated alerts and connections. Full details are able to be presented to the end-user, including full network addresses, service, port numbers, durations, etc. Our model as shown in Figure 1(b) is able to visualize a network topology and its traffic based on the Snort alert data. A network
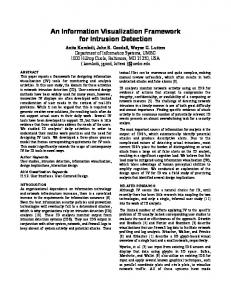
The alerts that are clustered in the previous step are visualized in the flocking model [Figure 2]. Each flocking node represents a single alert, and is color-coded by alert type. The alerts move based on their attraction to one another, which is determined using a comparison model. Those with maximum similarity will tend to group together as they move. This is a useful tool which presents network administrators with a visual grouping of IDS alerts. Incorrectly classified alerts (false alarms) can be quickly distinguished due to their lack of similarity with correctly classified alerts. The behavior of each node within the flocking model is based on three simple rules: 1.
Separation is to avoid crowding neighbors (short range repulsion)
2.
Alignment is to steer towards average heading of neighbors 3. Cohesion is to steer towards average position of neighbors (long range attraction) With these three simple rules, the flock moves in an extremely realistic way, creating complex motion and interaction that would be extremely hard to create otherwise.
2.2.2 String Matching Algorithm The similarity between alerts is measured using a similarity metric called hamming distance [16].It gives the score which is the cost incurred in turning one string to another. In clustering the alerts, two alerts are compared to measure the similarity score between them and if the score is near to zero it means the alerts can be considered similar and can be grouped together. On the other hand if the score is near to 1 then the two alerts are not similar and the alerts do not move together. The alerts that are not grouped with any of the alerts are considered as false alarms.
negatives. Mathew et al. have developed a tool which was aimed for detection of multistage attacks in which attack paths was concentrated. If the sequence of attacks between the source and destination is more, than it might not be possible to detect the attack as it would not be possible to visualize all this sequence of events at a time. IDS Rain storm [7] presents a visualization tool in which more IP addresses for alerts can be seen at a time by filtering them out based on severity level of attacks .TNV[12] was designed to keep track of network activity in which it was made possible to decide if it was a login session or some clientserver request. And also, the network link that is the communication between the attacker and the victim.
4. CONCLUSION AND FUTURE WORK In this paper we presented how we can simplify network administrator's job from being overwhelmed with the alarms generated by intrusion detection tools like Snort. Here we have taken dataset generated by the Snort and grouped the alarms to reduce the size of the dataset and then we have done the visualization of the attacks to give idea of malicious data in the network. In the future we plan to enhance it by developing a tool in which each IP address is represented as node which is victim surrounded by attackers using data mining techniques.
5. ACKNOWLEDGEMENTS This work is partially supported by grants from Tennessee Higher Education Commission's Center of Excellence in Applied Computational Science and Engineering and Oak Ridge National Laboratory.
REFERENCES [1]. Soleimani M., Khosrowshahi E., Doroud M., Damanafshan M., Behzadi A., Abbaspour M., A Reliable Analyzer and Archiver for Snort Intrusion Detection System, Proceedings of the 2007 ACM symposium on Applied computing, Korea, 2007. [2]. Hideki Koike, Kazuhiro Ohno, SnortView: Visualization System of Snort Logs, Proceedings of the 2004 ACM workshop on Visualization and data mining for computer security, Washington DC, USA, 2004. [3]. Wenke Lee, Applying data mining to intrusion detection: the quest for automation, efficiency, and credibility, ACM SIGKDD Explorations Newsletter, December, 2002. Figure 2. Alert Clustering
3. RELATED WORK: RAAS [1] which was designed for data abstraction uses hashing techniques, is an automated way of archiving huge amounts of data generated by snort in which it maintains several tables. Even it was an automated way of archiving data it has possible overhead of moving data between different tables. Snort view [2] is based on 2-D time diagram and alerts are shown as icons in different colors which were designed to reduce false detections. Here sys log and NIDS log are integrated together to be more accurate about recognizing real attacks and avoiding false
[4]. Patrick Hertzog, Visualizations to improve reactivity towards security incidents inside corporate networks, Proceedings of the 3rd international workshop on Visualization for computer security, Alexandria, Virginia, USA, 2006. [5]. Mansmann, Fisher, Keim, North, Visual support for analyzing network traffic and intrusion detection events using TreeMap and graph representations, Proceedings of the Symposium on Computer Human Interaction for the Management of Information Technology, Maryland, USA, 2009. [6]. Mathew, Giomundo, Uoadhyaya, Sudit,Slotz, Understanding multistage attacks by attack-track based visualization of heterogeneous event streams, Proceedings of the 3rd international
workshop on Visualization for computer security, Virginia, USA, 2006. [7]. Abdullah, Copeland, Tool update: high alarm count issues in IDS rainstorm, Proceedings of the 3rd international workshop on Visualization for computer security, Alexandria, Virginia, USA, 2006. [8]The snort. http://www.snort.org. [9]. Shabtai, Klimov, Shahar, Elovici, An intelligent, interactive tool for exploration and visualization of time-oriented security data, Proceedings of the 3rd international workshop on Visualization for computer security, Alexandria, Virginia, USA, 2006 [10].Klaus Juslich.Clustering Intrusion Detection alarms to support root cause analysis . Proceedings of Acm Transactions On Information And System Security ,NY,USA,2003
[11]. Dokas, Kumar, Lazarevic, Srivastava, Tan, Data Mining for Network Intrusion Detection, USA, 2004. [12].John R.Goodall ,et al. A User - Centered Approach to visualizing Network Traffic for Intrusion Detection.Proceedings of 2005 ACM symposium on applied computing,USA ,2005. [13]. Anup K.Ghosh, Aaron Schwartzbard and Michael Schatz. Learning Program Behavior Profiles for Intrusion Detection. Proceedings of the 1st conference on Workshop on Intrusion Detection and Network Monitoring, Santa Clara, California, 2002. [14]T Lane.Temporal sequence learning and data reduction for anamoly detection.Proceedings of ACM Transactions on Information and System Security,NY,USA,1999. [15]. Pang-Ning Tan, Michael Stenbach, Vipin Kumar. Introduction to data mining. Pearson Addison Wesley. 2006. [16]Simetrics.http://www.dcs.shef.ac.uk/~sam/stringmetrics.html