COMPDYN 2013 4th ECCOMAS Thematic Conference on Computational Methods in Structural Dynamics and Earthquake Engineering M. Papadrakakis, V. Papadopoulos, V. Plevris (eds.) Kos Island, Greece, 12–14 June 2013
ALTERNATIVE INTEGRATORS AND PARALLEL COMPUTING FOR EFFICIENT NONLINEAR RESPONSE HISTORY ANALYSES Khalid M. Mosalam1, Xiao Liang2, Selim Günay3, Andreas Schellenberg4 1
University of California, Berkeley, USA
[email protected],
[email protected],
[email protected] 4
[email protected]
Keywords: Convergence, Nonlinear Response History Analysis, Numerical Integration, Parallel Computing. Abstract. This paper is an attempt to address solutions to two common problems associated with nonlinear response history analysis (NRHA). The first is the convergence problems that occur at high levels of nonlinearity, while the second is the computational time which can be prohibitively excessive in certain cases. To overcome the first problem, suitability of the use of alternative integration methods in NRHA instead of the commonly used implicit Newmark integration is investigated. These alternative methods are Explicit Newmark and OperatorSplitting methods, which do not require iterations and convergence checks. NRHA conducted on highway overpass bridges with multiple-column bents showed that the Operator-Splitting method provides very close results to those from the Implicit Newmark method for some of the considered models even for high levels of nonlinearity. The Explicit Newmark method was not successful for the investigated bridge system because of the stability limits which were not feasible to satisfy. However, explicit methods, when applicable, can be useful since they eliminate the convergence problems and reduce the simulation time. Means to improve convergence are also investigated for the implicit Newmark integration method, especially when the use of alternative integration methods is not possible. To address the second problem, parallel and cloud computing resources are utilized together with the alternative time integration methods. Particularly, the parallel version of OpenSees (OpenSees MP) running on NEEShub, currently providing access to up to 4232 processors, is used where significant computing time savings are achieved.
3116
Khalid M. Mosalam, Xiao Liang, Selim Günay and Andreas Schellenberg
1
INTRODUCTION
In order to gain a better understanding of the behavior of structural components and systems, one of the most suitable methods is experimental testing. The experiments designed to investigate the structural behavior in question can provide remarkable insight. The response of a structure to earthquake excitation and the consequences of this response involve various uncertainties at different stages including the definition of hazard, structural response, damage, and the corresponding loss determination. Performance-based earthquake engineering (PBEE) approach aims to consider all these uncertainties in order to determine the most efficient decision about the seismic risk mitigation actions. In order to achieve this goal of the PBEE approach, considerable amount of structural simulations are required. Due to physical, economical, and time constraints, experimental testing is not feasible as the sole structural simulator in PBEE. Alternatively, analytical simulations, where the analytical models are calibrated using the results of the experimental tests, fit reasonably well within the PBEE framework. The most accurate analytical simulation method is nonlinear response history analyses (NRHA) where two problems usually exist and are of concern to the structural engineering community. First, convergence problems occur at high levels of nonlinearity. Second, the computational time of the simulations can be prohibitively excessive. This paper is an attempt to address solutions to the previously mentioned two problems associated with NRHA. For this purpose, suitability of the use of alternative integration methods in NRHA instead of the commonly used implicit Newmark integration method is investigated. These alternative integrators are the Explicit Newmark and Operator-Splitting methods, which do not require iterations and convergence checks. Methods of convergence improvement are also investigated for the Implicit Newmark integrator. To reduce the simulation time, parallel and cloud computing resources are utilized in addition to the alternative time integration methods. Particularly, the parallel version of OpenSees (OpenSees MP) running on NEEShub is used, where significant computing time savings can be achieved. Applications of the above solutions to several bridge systems typically found in California under the effect of earthquake loading are also explored. 2
ALTERNATIVE INTEGRATION METHODS
The equations of motion of a multi-degree of freedom (MDOF) system under an external dynamic force excitation can be defined as follows: + cu + f = p mu
(1)
, u , f , and p are the accelwhere m is the mass matrix and c is the damping matrix, and u eration, velocity, restoring force and external force vectors, respectively. The restoring force can generally be defined as a function of displacement. Due to several factors, such as the random variation of the external force with time, e.g. due to earthquake shaking, and the nonlinear variation of the restoring force vector with displacement, closed form solution of Equation 1 is not possible [1]. Therefore, numerical integration methods are used for the sought solution. Differences between direct integration methods are mainly introduced by the way they handle Equations 2-4, arranged as the Newmark difference equations for displacement and velocity and the discretized dynamic equilibrium equation, respectively.
u i +1 = u i + ∆t u i
2 ( ∆t ) [(1 − 2β )u +
2
3117
i
i +1 ] + 2β u
(2)
Khalid M. Mosalam, Xiao Liang, Selim Günay and Andreas Schellenberg
i + γ u i +1 ] u i +1 = u i + ∆t [(1 − γ )u
(3)
i +1 + cu i +1 + f i +1 = p i +1 mu
(4)
In the above equations, γ and β parameters define the variation of accelerations over a time step, ∆t . For example, γ =1/2 and β =1/4 represent constant average acceleration over a time step, while γ =1/2 and β =1/6 define linear variation of acceleration during the time step. The following sub-sections describe the alternative integration methods, namely the Explicit Newmark and Operator-Splitting integrators and the commonly utilized Implicit Newmark integration method, and their algorithms. This description starts from the basic three equations defined above and emphasizes departure points and differences between these methods. 2.1
Explicit Newmark Method
Explicit Newmark (EN) integration [2] is defined by setting β = 0.0 . Accordingly, Equation 2 becomes
u i +1 = u i + ∆t u i +
(∆t )2 u 2
i
(5)
Substituting Equations 3 and 5 in Equation 4, the linear system of equations defined by Equations 6 is obtained, which can be solved to determine the acceleration. Subsequently, Equation 3 is used to determine the velocity. i +1 = p eff m eff u m eff = m + ∆t γ c
(6)
i ] p eff = p i +1 − f i +1 − c [u i + ∆t (1 − γ )u It is noted that setting β = 0.0 makes the method explicit. In this way, the implicit nature i +1 term. The algorithm for an integration time of Equation 2 is eliminated by removal of the u step of the EN method is summarized as follows: 1. Compute the displacement using Equation 5. 2. Obtain the restoring force, f , corresponding to the computed displacement from the constitutive relationships of the defined materials and elements using a state determination method [3]. 3. Calculate the acceleration by solving the linear system of equations defined by Equations 6. 4. Determine the velocity using Equation 3. 5. Increment i and proceed with the next integration step. 2.2
Operator-Splitting (OS) Method
Similar to the EN method, the OS method [4] eliminates the implicit nature of the equations of motion. However, instead of doing this elimination directly as in EN, OS uses a pre~ , is obtained by neglecting diction and correction technique. The predicted displacement, u i +1 i +1 term in the bracketed term of Equation 2, i.e. the u
3118
Khalid M. Mosalam, Xiao Liang, Selim Günay and Andreas Schellenberg
~ = u + ∆t u + (∆t ) u i i i +1 2
2
[(1 − 2β ) u i ]
(7)
After the prediction of the displacement, the method is defined by setting the restoring force of the integration time step as the sum of the restoring force corresponding to the pre~ dicted displacement, fi +1 , and the difference between the corrected and predicted displacements multiplied by the initial stiffness matrix, k I , i.e. ~ ~ ] f i +1 = fi +1 + k I [u i +1 - u i +1
(8)
Subtracting Equation 7 from Equation 2 and substituting the result in Equation 8 gives ~ 2 i +1 (9) f i +1 = fi +1 + (∆t ) β k I u Substitution of Equations 3, 7 and 9 in Equation 4 leads to the linear system of equations defined by Equations 10, which can be solved to determine the acceleration. i +1 = p eff m eff u m eff = m + ∆t γ c + (∆t ) β k I ~ i ] p eff = p i +1 − fi +1 − c [u i + ∆t (1 − γ )u 2
(10)
The method continues by the computation of the corrected displacement (Equation 11) and velocity (Equation 3). 2 ~ i +1 + u u i +1 = (∆t ) β u i +1
(11)
The algorithm for an integration time step of the OS method can be summarized as follows: 1. Compute the predicted displacement using Equation 7. ~ 2. Obtain the restoring force, f , corresponding to the predicted displacement from the constitutive relationships of the defined materials and elements using a state determination method [3]. 3. Determine the acceleration by solving the linear system of equations defined by Equations 10. 4. Calculate the corrected displacement using Equation 11. 5. Obtain the restoring force corresponding to the corrected displacement following similar procedure to that outlined in step 2 above. 6. Determine the velocity using Equation 3. 7. Increment i and proceed with the next integration step. 2.3
Implicit Newmark Method
The implicit nature of the equations of motion is eliminated in the EN and OS methods. In contrast to these methods, the Implicit Newmark (IN) integrator treats the equations of motion directly without altering its implicit nature. Rearranging the time-discrete equilibrium equations (Equation 4), one obtains, i +1 − cu i +1 − fi +1 = 0 p i +1 − mu
3119
(12)
Khalid M. Mosalam, Xiao Liang, Selim Günay and Andreas Schellenberg
i +1 through Equations 2 and 3 and f i +1 is a function of where u i +1 and u i +1 are functions of u i +1 u i +1 . Therefore, Equation 12 represents a nonlinear system of equations in terms of u which can be solved using a nonlinear equation solver. The most common of these nonlinear equation solvers is the Newton-Raphson method, which seeks the root of a function by using Equation 13.
g ′(x k ) ∆x k = − g (x k )
(13)
where g and g ′ represent the function and its derivative, respectively, x is the root of the function, k is the iteration number and ∆x k is the difference between the value of x in the current and previous iterations. If the left-hand side of Equation 12 is considered as the function g in Equation 13, one can write the following in terms of the acceleration, ik+1 ) ∆u ik+1 = − g (u ik+1 ) g ′(u
(14)
ik+1 ) = mu ik+1 + cu ik+1 + fik+1 − p i +1 g (u
(15)
ik+1 ) = m + ∆t γ c + (∆t ) β k t g ′(u
(16)
2
where, k t is the tangential stiffness matrix corresponding to the displacement vector u i+k 1 , which can be obtained as a result of a state determination method [3]. It is noted that derivation of Equation 16 from Equation 15 requires various steps as discussed in [5]. Substitution of Equations 15 and 16 in Equation 14 leads to the linear system of equations defined by Equations 17 in the same format as the alternative methods explained earlier.
ik+1 = p eff m eff ∆u m eff = m + ∆t γ c + ∆t 2 β k t ik+1 − cu ik+1 − fik+1 p eff = p i +1 − mu
(17)
At this point, it is beneficial to state that all three methods discussed above reduce the nonlinear differential equation (equation of motion) to a system of linear algebraic equations. However, depending on the way each method treats the three basic equations (Equations 2-4), the resulting coefficient matrix (or the Jacobian matrix, referring to the derivative on the lefthand side of Equation 14), m eff , and the effective load vector, p eff differ from one method to the other. Accordingly, these differences determine the adequacy and ease of application of each method as explained later. After the determination of the acceleration increment for iteration k from Equations 17, the method continues by the calculation of the acceleration, velocity and displacement for iteration k + 1 from Equations 18-20. ik++11 = u ik+1 + ∆u ik+1 u
(18)
[
i + γ u ik++11 u ik++11 = u i + ∆t (1 − γ ) u
u ik++11
= u i + ∆t u i
2 ( ∆t ) [(1 − 2β )u +
2
i
]
ik++11 + 2β u
(19)
]
(20)
ik+=11 . For the An iterative method requires an initial guess for the sought value, i.e. for u Newton-Raphson method, acceleration of the previous iteration can be used as the initial
3120
Khalid M. Mosalam, Xiao Liang, Selim Günay and Andreas Schellenberg
guess as defined in Equation 21. Subsequent substitution of this equation in Equations 2 and 3 leads to the corresponding velocity and displacement, i.e. u ik+=11 and u ik+=11 vectors as follows, ik+=11 = u i u
(21)
i u ik+=11 = u i + ∆t u
(22)
u ik+=11 = u i + ∆t u i +
(∆t )2 u 2
i
(23)
The algorithm for an integration time step of the IN method can be summarized as follows: 1. Determine the initial guess, k = 1 , for acceleration from Equation 21 and the corresponding velocity and displacement from Equations 22 and 23, respectively. For each iteration k=1: N where N is the total number of iterations: 2. Obtain the restoring force, f , corresponding to the computed displacement from the constitutive relationships of the defined materials and elements using a state determination method [3]. 3. Determine the acceleration increment by solving the linear system of equations defined by Equations 17. 4. Compute the acceleration, velocity and displacement using Equations 18-20. 5. Check convergence by comparing a calculated norm with a defined tolerance value. If the norm is smaller than the tolerance, set N = k , increment i and proceed to the next integration step; otherwise, increment k and go to step 2. Regarding the above algorithm, three remarks can be stated as follows: • This algorithm summarizes the IN method for the implicit formulation in terms of acceleration. It is also possible to have an implicit formulation in terms of displacement and the corresponding algorithm, which leads to fewer convergence issues than the acceleration based formulation [6]. However, the acceleration solution is presented herein to provide a similar format to the other two alternative methods to be able to indicate the differences of the methods using this same format. • As can be observed from the algorithm above, presence of the convergence check requires at least two iterations. Therefore, unless a solution is separately coded for a linear case, a general nonlinear analysis software requires at least two iterations for the IN integration, even for the case of a linear problem. • Different norms can be used for the mentioned convergence check in step 5 of the above algorithm. Examples of these norms are the acceleration increment and unbalanced force norms. Among the three integration methods discussed above, the IN can be considered as the most accurate solution method for nonlinear problems since it seeks a solution to the implicit problem directly using commonly established nonlinear equation solving methods. In this sense, it can be considered as an accurate reference for other methods, whereas the described alternative methods can be considered as approximations. However, the reference IN method is subject to convergence problems (refer to step 5 of the above algorithm) due to the iterative nature of the method, while the approximate alternative methods are free from such convergence problems since they do not require any convergence checks. Therefore, the advantage
3121
Khalid M. Mosalam, Xiao Liang, Selim Günay and Andreas Schellenberg
of such alternative methods can be considered in NRHA by employing these alternative methods whenever they are applicable with acceptable accuracy. 3 3.1
APPLICABILITY OF THE ALTERNATIVE INTEGRATION METHODS General
The EN integration, providing a straightforward application and accordingly being computationally efficient, is unfortunately conditionally stable with the following stability limit, ∆t Tn < π
(24)
where ∆t is the integration time step and Tn is the period of the highest mode of vibration of the considered structure. The stability limit defined in Equation 24 prevents the use of the EN method for structures with massless degrees of freedom (DOF), since the presence of such DOF results in a singular mass matrix that yields zero-period modes. Accordingly, the EN method is not applicable to building and bridge structures which typically are modeled with massless rotational DOF, unless these DOF are condensed out. General purpose nonlinear analysis software such as OpenSees [7] or SAP2000 [8] do not perform such condensation since the architecture of the software is not designed to operate on specific structure types. However, it is within the future objectives of this study to implement a condensation algorithm in OpenSees to facilitate the use of the EN method for a wide range of typical structures. The OS method is unconditionally stable as long as the tangential stiffness is smaller than the initial stiffness, i.e. for the case of softening (non-stiffening) nonlinearity. However, this condition does not restrict the use of the OS method for models with stiffening constitutive relationships. As demonstrated in the next section, the OS method can still provide accurate results for some stiffening models. Accordingly, the applicability of the OS method covers a broad range of nonlinear problems. It is to be noted that, the unconditional stability is a result of the choice of γ and β parameters as 1/2 and 1/4, respectively, following the recommendations in [9, 10]. The IN integration method is unconditionally stable for the parameter values γ = 1 2 and β ≥ 1 4 . Accordingly, the common use of the IN integration method assuming average acceleration, i.e. γ = 1 2 and β = 1 4 , is unconditionally stable. 3.2
Investigation on Specific Bridge Structures
Applicability of the previously discussed integrators is investigated on two bridge structures in California, namely the La Veta Avenue Overcrossing, a bridge with two spans and a two-column bent and the Jack Tone Road Overcrossing, a bridge with two spans supported on a single-column bent. Peyman et al. [11] conducted extensive analytical simulations of these two bridges using OpenSees [7], on which the modeling assumptions adopted herein are based. For a detailed explanation of the employed modeling assumptions, please refer to the descriptions in [11, 12]. For completeness and convenience to the reader, the utilized modeling aspects are briefly summarized in the following two paragraphs. Caltrans SDC [13] requires the superstructure of a bridge to be capacity protected and accordingly to remain elastic. Considering that the bridge is designed according to the code regulations, the bridge deck and the cap-beam that form the bridge superstructure are modeled as elastic beam-column elements with uncracked section properties as typical for prestressed concrete. The cap-beam was given arbitrarily high torsional and out-of-plane stiffness since the cap-beam and the deck were integrally constructed. The mass of the superstructure, in-
3122
Khalid M. Mosalam, Xiao Liang, Selim Günay and Andreas Schellenberg
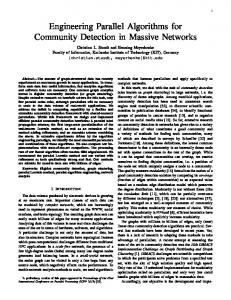
cluding the rotational mass, is distributed to the superstructure elements to accurately capture the dynamic response. To model the columns, nonlinear force-based beam-column elements are utilized with fiber-discretized sections considering 10 integration points. The boundary condition at each column base is considered as pin connection. Regarding the abutment modeling, two approaches are considered: detailed modeling and simplified modeling. In both approaches, the longitudinal responses of the backfill and the expansion joint, the transverse responses of the shear keys, and the vertical responses of the bearing pads and the stemwall are considered explicitly. In the detailed modeling approach (Figure 1a), five nonlinear springs connected to gap elements in series are used to model the passive backfill response and the expansion joint. The strength and initial stiffness of the soil springs are determined according to Caltrans SDC [13]. The shear key response is modeled using a nonlinear spring with a tri-linear backbone curve. Vertical response of the bearing pads and the stemwall is modeled by two parallel springs that represent the stiffness of the bearing pads and the stemwall. In the simplified modeling approach, the number of nonlinear springs connected in series to the gap elements is reduced to two as shown in Figure 1b, and the shear key response is modeled using an elastic perfectly plastic backbone curve. Bearing pad and stemwall Expansion joint Expansion joint Backfill Backfill
Backfill
Shear key
Shear key
Bearing pad and stemwall
a)
b)
Figure 1: Springs and gap elements used to model various components of the abutment, a) detailed modeling, b) simplified modeling [11].
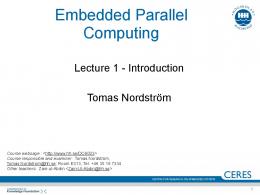
NRHA are conducted for both modeling approaches using the OS and IN methods for forty pulse-like three-component ground motions described in [11]. Considering the IN method as a reference, the accuracy of the OS method is investigated by comparing the obtained response quantities. Although analyses are conducted for all 40 ground motions, detailed results are presented herein for selected ground motions which result in the highest level of nonlinearity. The longitudinal direction displacement of a superstructure node (node105 in Figure 2) from the IN and OS methods applied to the La Veta Avenue Overcrossing model with simplified abutment modeling is plotted in Figures 3-6 together with moment-curvature plots (My-φy, plots) to reflect the corresponding level of nonlinearity. It is noted that My-φy plots are those obtained from the IN method. In order to quantitatively compare the results of the OS and IN methods, two error measures are introduced as follows, 1. The error of maximum response defined as
Max error =
Max IN − MaxOS Max IN
3123
(25)
Khalid M. Mosalam, Xiao Liang, Selim Günay and Andreas Schellenberg
where Max IN and MaxOS are the maximum absolute response provided by the IN and OS methods, respectively. 2. Root Mean Square Error, RMSE , defined as
∑ (x n
RMSE =
i =1
OS i
− xiIN )
2
n
(26)
xmIN
where n is the total number of time integration points, xiOS and xiIN are the response quantities at the i th integration time step from the OS and IN methods, respectively, and xmIN is the median of the absolute of the response at all integration time steps from the IN method. Max error and RMSE for the longitudinal direction displacements of one node of the abutment (abut1000, not shown in Figure 2), one node of the column (node12), and one node of the superstructure (node105) are presented in Tables 1-4. 120 119 118 117 116 115 114 113 112
23 22
111 110
109
13 12
108 107 106 21
105 104 103
11
102 101 100
Figure 2: Superstructure and the column bent of the La Veta Avenue Overcrossing bridge model used in the NRHA with marked nodes for which the results are presented 1.5
OS IN
20
x 10
5
1
15 0.5
10
My
Longitudinal Displacement (in)
25
5
0
0 -0.5 -5 -10 0
5
10
15
-1 -0.5
20
Time (s) a)
0
0.5
1
Φy
1.5
2
2.5 x 10
-3
b)
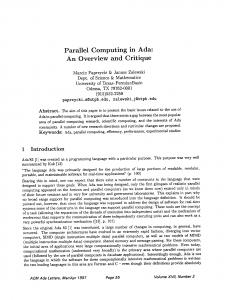
Figure 3: Comparison of the IN and OS methods for the longitudinal displacement of node105 (a) and momentcurvature response (b) for GM18.
3124
Khalid M. Mosalam, Xiao Liang, Selim Günay and Andreas Schellenberg
1.5
OS IN
15
x 10
5
1 0.5
10
My
Longitudinal Displacement (in)
20
5
0
0
-0.5
-5
-1
-10 0
10
-1.5 -1
40
30
20
-0.5
0
Time (s) a)
0.5
Φ
1
1.5
2 x 10
y
-3
b)
Figure 4: Comparison of the IN and OS methods for the longitudinal displacement of node105 (a) and momentcurvature response (b) for GM19. 1.5
OS IN
10
x 10
5
1 0.5
5
My
Longitudinal Displacement (in)
15
0
0
-5
-0.5
-10 0
20
40
60
80
-1 -1
100
-0.5
0
Time (s) a)
0.5
Φ
1
2
1.5 x 10
y
-3
b)
Figure 5: Comparison of the IN and OS methods for the longitudinal displacement of node105 (a) and momentcurvature response (b) for GM28. 1.5
OS IN
10
5
0.5
5 0
0
-5
-0.5
-10
-1
-15 0
x 10
1
My
Longitudinal Displacement (in)
15
20
40
60
80
-1.5 -1.5
100
Time (s) a)
-1
-0.5
0
Φy
0.5
1
1.5 x 10
-3
b)
Figure 6: Comparison of the IN and OS methods for the longitudinal displacement of node105 (a) and momentcurvature response (b) for GM31.
3125
Khalid M. Mosalam, Xiao Liang, Selim Günay and Andreas Schellenberg Table 1. Max error for all DOF deformations of the node abut1000
DIR 1
2
3
4
5
6
GM 18 19 28 31
4.49×10⁻⁶ 6.53×10⁻⁵ 6.80×10⁻⁶ 8.19×10⁻⁶
2.02×10⁻⁴ 6.20×10⁻⁶ 4.48×10⁻⁵ 9.44×10⁻⁶ 1.34×10⁻⁵ 0.0 1.06×10⁻⁵ 0.0 9.93×10⁻⁶ 0.0 1.99×10⁻⁵ 3.75×10⁻⁶ 3.69×10⁻⁶ 6.16×10⁻⁶ 0.0 3.88×10⁻⁶
6.87×10⁻⁴ 9.07×10⁻⁵ 2.17×10⁻⁶ 3.16×10⁻⁵
Table 2. RMSE for all DOF deformations of the node abut1000
DIR 1
2
3
4
5
6
1.71×10⁻⁴ 2.61×10⁻⁴ 7.28×10⁻⁵ 5.59×10⁻⁵
4.06×10⁻⁴ 4.16×10⁻⁴ 8.41×10⁻⁶ 3.60×10⁻⁵
2.34×10⁻⁵ 5.11×10⁻⁶ 2.96×10⁻⁶ 3.82×10⁻⁶
3.42×10⁻⁴ 1.36×10⁻⁴ 6.92×10⁻⁶ 2.04×10⁻⁵
9.89×10⁻⁶ 3.93×10⁻⁶ 1.07×10⁻⁶ 1.42×10⁻⁶
2.53×10⁻³ 1.36×10⁻³ 4.48×10⁻⁴ 2.97×10⁻³
GM 18 19 28 31
Table 3. Max error and RMSE for longitudinal and transverse direction displacements of node12
DIR GM 18 19 28 31
1 Max error
2 Max error
RMSE
-6
-4
5.87×10 6.06×10⁻⁵ 1.12×10⁻⁵ 8.57×10⁻⁶
1.77×10 2.59×10⁻⁴ 7.12×10⁻⁵ 5.37×10⁻⁵
RMSE
-5
2.47×10⁻⁴ 4.66×10⁻⁵ 7.00×10⁻⁶ 1.38×10⁻⁵
6.18×10 2.26×10⁻⁶ 1.02×10⁻⁵ 7.37×10⁻⁶
Table 4. Max error and RMSE for longitudinal and transverse direction displacements of node105
DIR GM 18 19 28 31
1 Max error -6
7.15×10 6.03×10⁻⁵ 1.12×10⁻⁵ 7.53×10⁻⁶
2 Max error
RMSE -4
1.84×10 2.47×10⁻⁴ 7.25×10⁻⁵ 5.01×10⁻⁵
-4
1.16×10 8.18×10⁻⁶ 9.85×10⁻⁶ 5.53×10⁻⁶
RMSE 1.96×10⁻⁴ 2.00×10⁻⁴ 7.80×10⁻⁶ 1.24×10⁻⁵
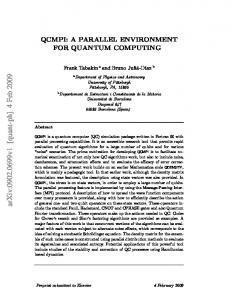
From the very good match of the responses for highly nonlinear cases in Figures 3-6 and very small values of the error measures in Tables 1-4, it can be concluded that the OS method is a good candidate to replace the IN method for NRHA of a structure such as the considered bridge with simplified abutment modeling. On the contrary, the OS method does not provide accurate results for the model with detailed abutment as shown in Figure 7, which compares the Max error values from the simplified and detailed abutment modeling cases for all analyzed ground motions. The inaccuracy of the OS method for the detailed abutment modeling is attributed to the increased number of gap elements, which results in a considerable stiffening response and restricts the use of the OS method. Not shown here due to space limitations,
3126
Khalid M. Mosalam, Xiao Liang, Selim Günay and Andreas Schellenberg
similar behavior is witnessed, i.e. very good match of results for simplified modeling and inaccurate results for the detailed modeling, for the Jack Tone Road Overcrossing model. 0.4 0.35
Simplified Abutment Modeling Detailed Abutment Modeling
Max error
0.3 0.25 0.2 0.15 0.1 0.05 0 0
10
20 GM #
30
40
Figure 7: Max error for the longitudinal direction displacement of node105 for the models with simplified and detailed abutment modeling.
Although rotational mass is utilized in some of the DOF, the EN method was not practically applicable for this bridge due to the existence of other DOF with zero mass and the corresponding zero-period modes. Therefore, the EN method was not pursued in these bridge analyses. 4
IMPROVING CONVERGENCE OF IMPLICIT NEWMARK INTEGRATION
As demonstrated in the previous section, the OS method is a suitable alternative to the IN method to avoid convergence problems. However, there exist some conditions where the OS method is not applicable, e.g. the case of significant stiffening response due to closing of the gap elements in the above mentioned bridge model. Moreover, aside from the chosen integration method, formulation of some of the elements, e.g. the force-based beam-column elements or the materials, e.g. Bouc-Wen type, in OpenSees [7] are iterative. Accordingly, the IN method may be the only option for NRHA of models containing such elements and materials if the convergence problems at the element and material levels cannot be eliminated while using the alternative integrators. The following sub-sections investigate the effect of different parameters in improving the convergence properties of the IN method while preserving its accuracy for the OpenSees bridge models mentioned above. It is noted that this investigation is based on the displacement formulation of the method, which is observed to result in an improved convergence performance compared to the acceleration formulation. The considered parameters are categorized in four groups as follows: 1. Type and sequence of nonlinear equation solvers 2. Convergence test type 3. Convergence tolerance 4. Integration time step
3127
Khalid M. Mosalam, Xiao Liang, Selim Günay and Andreas Schellenberg
4.1
Type and sequence of nonlinear equation solvers
In order to achieve convergence, OpenSees [7] allows trying various nonlinear solvers consecutively for an integration time step. Therefore, one of the potential items that can be considered to improve convergence is the type and sequence of the nonlinear equation solvers. This investigation is further divided into two sub-groups, namely, (a) determination of the most suitable initial solver and (b) sequence of other solvers after the initial one. In order to identify the most suitable initial solver, the following nonlinear solvers: Newton, KrylovNewton, Broyden–Fletcher–Goldfarb–Shanno (BFGS), Broyden, and Newton with Line Search (NLS) available in OpenSees [7] are tested for the Jack Tone Road Overcrossing with detailed abutment modeling. Based on the convergence situations from the simulations with several relatively strong ground motions (GM1, GM11, GM18, GM19, GM28, and GM31) with scale factors ranging from 1.0 to 2.0, NLS proves to be the most suitable initial solver. Table 5 shows the convergence condition for different scales of GM31, where it can be observed that all the simulations that used the NLS solver as the initial solver are completed, whereas the simulations with other initial solvers fail to converge for some of the scales. Table 5. The convergence failure time [sec] of simulations for different initial nonlinear solvers under GM31
Scale Factor 1.0 1.1 1.2 1.3 1.4 1.5 1.6 1.7 1.8 1.9 2.0
Newton
KrylovNewton
Broyden
NLS
BFGS
Completed 35.645 35.650 35.655 Completed Completed Completed Completed 35.710 Completed 35.730
21.820 21.820 21.820 6.115 6.115 6.115 6.115 6.115 6.115 6.115 6.115
Completed 35.660 Completed 35.655 35.260 78.505 Completed Completed Completed 35.265 52.540
Completed Completed Completed Completed Completed Completed Completed Completed Completed Completed Completed
Completed 35.820 41.010 Completed 28.985 Completed 42.600 36.155 37.270 35.915 24.675
Using the NLS as the initial solver, no difference was found when different subsequent orders of other solvers (Newton, Broyden, BFGS, and KrylovNewton) were investigated. It may be concluded that as long as a suitable initial solver is determined, the order of subsequent other solvers do not have significant impact on the convergence. It is beneficial to note that this finding may be specific to the investigated structure since this investigation is not repeated for other structures. However, it is still a useful conclusion because of two reasons. First, this finding sets the NLS to be a suitable initial solver as the first simulation trial of future nonlinear models. Second, it shows to the analyst the importance of proper selection of the initial solver compared to trying a variety of solver combinations afterwards. 4.2
Convergence test type
Similar to the previous sub-section, the Jack Tone Road Overcrossing with detailed abutment modeling is used in this sub-section. The following five convergence tests: Energy Increment, Norm Displacement Increment, Relative Norm Displacement Increment, Total Relative Displacement Increment, and Relative Energy Increment, are compared for the 4 ground motions (GM18, GM19, GM28, and GM31) with scale factors ranging from 1.0 to 2.0. The comparisons are based on counting the total number of iterations for each simulation, see
3128
Khalid M. Mosalam, Xiao Liang, Selim Günay and Andreas Schellenberg
Table 6. It can be observed that the Energy Increment test leads to significantly less number of iterations compared to the other test types. It is to be noted that very small differences are obtained from the simulations with different convergence tests, as indicated by Maxerror and RMSE for the longitudinal direction displacements of one of the nodes of the abutment, i.e. abut100 (not shown in Figure 2) in Tables 7 and 8. Here, Maxerror and RMSE are calculated for the simulations with different convergence tests considering the simulations with the Energy Increment test as the reference. It is beneficial to note that the same tolerance value of 1×10⁻⁸ is used for all the convergence tests, making the Energy Increment test to have the least amount of iterations. Multiplication of the displacement increment with the unbalanced force, both less than 1.0, results in a norm value smaller than the other norms. However, observing that the simulations with the less stringent Energy Increment leads to the same value of results with significantly less number of iterations compared to the other tests, it is concluded that the Energy Increment test is the most suitable convergence test for the analyzed model. Similar to the investigation in previous sub-section, this finding may be specific to the investigated model. However, for similar reasons as those mentioned above, it is still a useful conclusion by providing an initial trial suggestion for other models and simulations. Table 6. Total number of iterations for simulations with different convergence tests under GM31
Scale RelativeNorm RelativeTotal Relative EnergyIncr NormDisIncr Factor DisIncr NormDisIncr EnergyIncr 1.0 1.1 1.2 1.3 1.4 1.5 1.6 1.7 1.8 1.9 2.0
31227 31510 31671 32021 31979 32272 32580 32573 33077 33397 33780
48225 48514 48983 49340 49567 49844 50035 50074 50683 51537 Failed
55821 56481 56656 56734 57093 57187 57023 57015 57291 57381 61986
55817 56472 56664 56733 57075 57187 57023 57011 57219 57372 57876
40949 41726 42324 42505 42605 42715 42522 42162 42077 42439 42664
Table 7. Max error due to different convergence tests for the longitudinal deformation of node abut100 for GM31
Scale NormDisIncr Factor 1.82×10⁻⁶ 1.0 0.0 1.1 1.30×10⁻⁴ 1.2 8.67×10⁻⁶ 1.3 0.0 1.4 0.0 1.5 0.0 1.6 0.0 1.7 0.0 1.8 0.0 1.9 Failed 2.0
RelativeNorm DisIncr
RelativeTotal NormDisIncr
Relative EnergyIncr
1.82×10⁻⁶ 0.0 0.0 8.67×10⁻⁶ 0.0 0.0 0.0 0.0 0.0 0.0 1.91×10⁻⁴
1.82×10⁻⁶ 0.0 0.0 8.67×10⁻⁶ 0.0 0.0 0.0 0.0 0.0 0.0 2.38×10⁻³
1.82×10⁻⁶ 0.0 0.0 0.0 0.0 0.0 0.0 0.0 2.21×10⁻⁶ 0.0 2.70×10⁻⁶
3129
Khalid M. Mosalam, Xiao Liang, Selim Günay and Andreas Schellenberg Table 8. RMSE due to different convergence tests for the longitudinal deformation of node abut100 for GM31
Scale NormDisIncr Factor 3.77×10⁻⁵ 1.0 4.45×10⁻³ 1.1 1.68×10⁻¹ 1.2 2.49×10⁻² 1.3 3.35×10⁻² 1.4 1.69×10⁻² 1.5 3.07×10⁻² 1.6 3.37×10⁻² 1.7 8.49×10⁻³ 1.8 1.37×10⁻⁵ 1.9 Failed 2.0 4.3
RelativeNorm DisIncr
RelativeTotal NormDisIncr
Relative EnergyIncr
3.77×10⁻⁵ 4.83×10⁻³ 1.55×10⁻² 2.29×10⁻² 3.07×10⁻² 1.69×10⁻² 3.07×10⁻² 3.30×10⁻² 8.49×10⁻³ 1.37×10⁻⁵ 6.83×10⁻²
3.77×10⁻⁵ 4.89×10⁻³ 1.68×10⁻² 2.29×10⁻² 3.31×10⁻² 1.69×10⁻² 3.07×10⁻² 3.37×10⁻² 2.50×10⁻² 1.37×10⁻⁵ 9.54×10⁻²
3.80×10⁻⁵ 4.78×10⁻³ 1.53×10⁻² 1.90×10⁻² 3.26×10⁻² 2.20×10⁻² 5.50×10⁻³ 6.14×10⁻² 4.01×10⁻⁴ 1.53×10⁻⁵ 1.04×10⁻⁴
Convergence tolerance
For the La Veta Avenue Overcrossing model with detailed abutment modeling, the effect of different tolerances of 1.0, 0.1, 10-3, and 10-5 on the convergence and accuracy of the obtained results is investigated using Energy Increment test. Although analyses are conducted for all of the 40 ground motions, detailed results are presented herein for four selected ground motions (GM18, GM19, GM28, and GM31) and for the longitudinal direction deformation of one node of the abutment, abut100, and the longitudinal displacement of one node of the column, node12, for the simulations with different tolerances are presented in Tables 9-12. In the calculation of these error quantities, simulations with the tolerance of 10-8 are considered as the reference. Table 9. Max error due to convergence tolerance for the longitudinal deformation of node abut100
TOL 1.0
0.1
10-3
10-5
GM 18 19 28 31
6.78×10⁻² 6.00×10⁻⁴ 4.00×10⁻⁴ 1.00×10⁻³
2.14×10⁻² 6.0×10⁻⁴ 8.16×10⁻⁵ 0.0 -5 1.79×10 2.55×10⁻⁶ 2.14×10⁻⁵ 1.22×10⁻⁵
2.89×10⁻⁵ 3.14×10⁻⁶ 2.55×10⁻⁶ 3.05×10⁻⁶
Table 10. RMSE due to convergence tolerance for the longitudinal deformation of node abut100
TOL 1.0
0.1
10-3
10-5
1.13×10⁻¹ 2.90×10⁻³ 8.00×10⁻⁴ 1.00×10⁻³
3.16×10⁻² 3.30×10⁻³ 1.00×10⁻⁵ 2.79×10⁻⁵
1.00×10⁻³ 7.70×10⁻⁵ 5.61×10⁻⁶ 1.01×10⁻⁵
5.65×10⁻⁵ 2.76×10⁻⁵ 7.32×10⁻⁷ 9.00×10⁻⁷
GM 18 19 28 31
3130
Khalid M. Mosalam, Xiao Liang, Selim Günay and Andreas Schellenberg Table 11. Max error due to convergence tolerance for the longitudinal displacement of node12
TOL 1.0
0.1
10-3
10-5
1.13×10⁻¹ 2.90×10⁻³ 8.00×10⁻⁴ 1.00×10⁻³
3.16×10⁻² 3.30×10⁻³ 1.00×10⁻⁵ 2.79×10⁻⁵
1.00×10⁻³ 7.70×10⁻⁵ 5.61×10⁻⁶ 1.01×10⁻⁵
5.65×10⁻⁵ 2.76×10⁻⁵ 7.32×10⁻⁷ 9.00×10⁻⁷
GM 18 19 28 31
Table 12. RMSE due to convergence tolerance for the longitudinal displacement of node12
TOL 1.0
0.1
10-3
10-5
3.40×10⁻² 2.35×10⁻¹ 1.46×10⁻² 1.90×10⁻²
7.00×10⁻³ 1.07×10⁻¹ 7.70×10⁻³ 1.83×10⁻²
2.00×10⁻⁴ 3.90×10⁻³ 1.40×10⁻³ 1.17×10⁻²
1.74×10⁻⁵ 1.40×10⁻³ 1.32×10⁻⁵ 2.93×10⁻⁵
GM 18 19 28 31
Selected tolerances may have considerable effect on the nonlinear response. A large tolerance may result in a premature convergence and corresponding deviation from the true result. The small errors between the simulations with tolerances of 10-5 and 10-8 under the effect of the ground motions resulting in highly nonlinear response indicate that the increase of the tolerance can be used as a reasonable option to overcome convergence issues, while preserving accuracy. It is to be noted that the above tolerance values are used for all the integration time steps of a particular simulation. Considering that a common application is the increase of the convergence tolerance only at the integration time steps with convergence problems, the errors in the obtained results in such cases of selective adoption of tolerance values will be even less than the errors listed in Tables 9-12. 4.4
Integration time step
Use of a smaller integration time step during the simulation does not necessarily increase the convergence behavior as seen from Table 13, which compares the convergence condition for the simulations with different scales of GM31 using Newton-Raphson as the initial solver. However, based on the simulations conducted with the two bridges in this study, it is observed that reduction of the integration time step, only when needed, is useful to overcome the convergence problems. However, this requires attention to be paid to preventing the simulation from being completed before the duration of the external excitation, where the integration time step should be reset to its original value after completion of all of the reduced time steps that represent the original step size, e.g. using automatic adaptive time increments [14]. 5
PARALLEL COMPUTING
Parallel computing is a form of computation in which many calculations are carried out simultaneously operating on the principle that large problems can often be divided into smaller ones, which are then solved concurrently [15]. The current state of structural and earthquake engineering profession is in need of high performance parallel computing for two reasons: (1) The considerable amount of structural simulations needed in PBEE as discussed
3131
Khalid M. Mosalam, Xiao Liang, Selim Günay and Andreas Schellenberg
in the “Introduction” section; (2) To facilitate the use of computationally demanding detailed nonlinear three-dimensional finite element models, which is nowadays somewhat commonly used as an accurate NRHA approach in many important practical projects. This paper is mainly focused on the first reason mentioned above, i.e. the execution of excessive amount of analytical simulations faster. OpenSees [7], which is utilized for the simulations of the studied bridge models, has two parallel versions: (1) OpenSees SP uses parallel processing for the state determination and equation solving stages, e.g. steps 2 and 3 in the algorithm of the EN method, of the numerical integration. It is very useful to shorten the simulation time of computationally expensive large models where minor changes are required in an input file to execute it in OpenSees SP [7]; (2) OpenSees MP is particularly useful for parametric analyses since different versions of a model can be executed simultaneously. The Tcl based interpreters of sequential OpenSees [7] allow conducting many simulations, e.g. consisting of different ground motions and diverse values of selected parameters, by using only a single input script. Minimal amount of changes are required to convert a sequential input script to the parallel version in OpenSees MP (Appendix A). Furthermore, OpenSees MP can handle the state determination and equation solving in a parallel manner. However, this requires more advanced commands. OpenSees MP running on NEEShub [16], where a large number of processors is accessible, is utilized for the simulations discussed in this paper. The simulation duration was 536 seconds to run 40 ground motions using 8 processors of the NEES cluster in NEEShub, while the simulation took 1648 seconds (more than threefold increase) with a single processor on a local computer. The duration of the simulation is expected to be much shorter if all the 4232 processors available on NEEShub are allocated for the simulation. Table 13. The convergence failure time [sec] of simulations for different integration time steps under GM31
Scale Factor 1.0 1.1 1.2 1.3 1.4 1.5 1.6 1.7 1.8 1.9 2.0 6
∆t = 0.01
∆t = 0.005
∆t = 0.0025
∆t = 0.001
Completed 35.6500 35.6600 35.6700 Completed Completed Completed Completed 35.7200 Completed 35.7400
Completed 35.6450 35.6500 35.6550 Completed Completed Completed Completed 35.7100 Completed 35.7300
Completed 35.6375 35.6450 35.6525 Completed Completed Completed Completed 35.7050 41.7225 36.3475
Completed
35.6360 35.6430 35.6510 Completed Completed Completed Completed
35.7040 62.6450 36.3460
CONCLUSIONS AND RECOMMENDATIONS
This paper addressed solutions to two problems associated with the nonlinear response history analyses (NRHA), namely convergence and execution time. For this purpose, suitability of the use of alternative integration methods in NRHA instead of the commonly used Implicit Newmark (IN) was investigated. In addition, methods were investigated to improve convergence of the IN method for the situations where alternative integrators are not applicable. In
3132
Khalid M. Mosalam, Xiao Liang, Selim Günay and Andreas Schellenberg
order to avoid the excessive simulation durations, parallel processing tools are employed. Achieved conclusions are represented below in the form of recommendations to the analysts: • The simulations conducted with the simplified abutment modeling of the investigated two bridges shows that the non-iterative Operator splitting (OS) method provides very close results to the IN method. However, OS method was not successful in producing the results of the IN method for the detailed abutment modeling cases. Accordingly, it can be concluded that OS method can serve as a suitable candidate for an alternative to the IN method in nonlinear models without significant stiffening nonlinearity. • An analyst should be aware of the presence of the alternative methods such as Explicit Newmark (EN) and OS methods and should use these methods whenever they are applicable in order to avoid the convergence problems associated with the IN method. It is beneficial to verify the accuracy of these alternative methods by comparison with the IN method as demonstrated in this paper for highly nonlinear cases. • Newton with Line Search is observed to be the most suitable initial nonlinear solver in terms of convergence. Accordingly, an analyst can start with this method as the initial solver in the first simulation trial of an analytical model. • The sequence of the nonlinear solvers after the initial solver is observed to be insignificant. Accordingly, an analyst can pay more attention to the determination of the initial solver than the determination of the sequence of the subsequent solvers in NRHA. • Simulations with Energy Increment lead to the same solution with significantly less number of iterations compared to other convergence tests. Accordingly, an analyst can consider the Energy Increment test in the first simulation trial of an analytical model. • Simulations conducted with tolerances of 10-5 and 10-8 for all the integration time steps are observed to result in very similar response calculations. Accordingly, the increase of the convergence tolerance for the integration time steps with convergence problems is a valid option to achieve convergence improvement. • Use of a smaller integration time step during the simulation does not necessarily increase the convergence behavior. However, reduction of the integration time step, only when needed, is useful to overcome the convergence problems, as long as the integration time step is reset to its original value after completion of the reduced time steps representing the original size of a time step, which is essential to prevent the simulation from being completed before the duration of the external excitation. • The structural and earthquake engineering community is in need of the computation power offered by parallel computing. Analysts should be aware of the available parallel computing resources such as the parallel OpenSees, i.e. the SP and MP versions, in the NEEShub in order to make use of these resources whenever applicable. ACKNOWLEDGEMENTS This research was supported by Caltrans under Contract Number 65A0454 for the Project “Guidelines for Nonlinear Seismic Analysis of Ordinary Bridges: Version 2.0”. Prof. Farzin Zareian, UC Irvine, is acknowledged for providing the OpenSees models of the analyzed bridges. The procedural guidance in Appendix A is generated from a combination of various documentation resources in the OpenSees website. OpenSees developer, Dr. Frank McKenna, is credited for the original documentation in the website. REFERENCES [1] A.K. Chopra, Dynamics of Structures, Theory and Applications to Earthquake Engineering. Pearson Prentice Hall, 3rd Edition, Upper Saddle River, NJ, 2006.
3133
Khalid M. Mosalam, Xiao Liang, Selim Günay and Andreas Schellenberg
[2] N.M. Newmark, A method of computation for structural dynamics. ASCE Journal of the Engineering Mechanics Division, 85(EM3), 67-94, 1959. [3] E. Spacone, F.C. Filippou, and F.F. Taucer, Fibre beam-column model for non-linear analysis of R/C frame: Part I. Formulation, Earthquake Engineering and Structural Dynamics, 25, 711-725, 1996. [4] T.J.R. Hughes, K.S. Pister, R.L. Taylor, Implicit-explicit finite elements in nonlinear transient analysis. Computer Methods in Applied Mechanics and Engineering 17/18, 159-182, 1979. [5] S. Günay, A. Bakhaty. Hybrid Simulation: Integration Methods. nees@berkeley 2012 Annual Hybrid Simulation Workshop. Presentation available at http://nees.berkeley.edu/Events/201206a--workshop-hybridsim/Handouts/Integrationmethods_Gunay_Bakhaty.pdf
[6] A.H. Schellenberg, S.A. Mahin and G.L. Fenves, Advanced implementation of hybrid simulation. PEER Technical Report 2009/104, 2009. [7] F. McKenna, G.L. Fenves, and F.C. Filippou, OpenSees, 2010 http://opensees.berkeley.edu. [8] E. L. Wilson, and A. Habibullah, SAP2000-Structural analysis user’s manual, Computers and Structures, Inc., 1998. [9] D. Combescure, P. Pegon, α-Operator splitting time integration technique for pseudodynamic testing error propagation analysis. Soil Dynamics Earthquake Engineering. 16, 427–443, 1997. [10] H.M. Hilbert, T.J.R. Hughes, and R.L. Taylor, Improved numerical dissipation for time integration algorithms in structural dynamics. Earthquake Engineering Structural Dynamics, 5, 283-292, 1977. [11] P Kaviani, F Zareian, E Taciroglu, Seismic behavior of reinforced concrete bridges with skew-angled seat-type abutments, Engineering Structures, 45, 137–150, 2012. [12] P. Kaviani, Performance-based seismic assessment of skewed bridges. Ph.D Dissertation. Irvine, California: University of California - Irvine; 2011. [13] Caltrans SDC (ver. 1.6). Caltrans seismic design criteria version 1.6. California Department of Transportation, Sacramento; 2010. [14] DIANA, User’s Manual: Analysis Procedures Edited by: Frits C. de Witte and Wijtze Pieter Kikstra, TNO DIANA, 2005. [15] A. Gottlieb, G.S. Almasi, Highly parallel computing. Benjamin/Cummings. Redwood City, California: ISBN 0-8053-0177-1, 1989. [16] The George E. Brown Network for Earthquake Engineering Simulation (NEES), NEEShub: Cyberinfrastructure of the Network for Earthquake Engineering Simulation, 2013, http://nees.org. [17] F. McKenna, M. H. Scott and G. L. Fenves, Nonlinear finite-element analysis software architecture using object composition, ASCE Journal of Computing in Civil Engineering, 24, 95-107, 2010.
3134
Khalid M. Mosalam, Xiao Liang, Selim Günay and Andreas Schellenberg
Appendix A: Procedural guidance on the use of OpenSees MP locally and on NEEShub The application of parallel versions of structural analysis software is relatively new in structural and earthquake engineering [17]. Therefore, there is a need to provide procedural information on the use of such applications. This sub-section provides useful guidance on the use of OpenSees MP on a local computer and on NEEShub. In order to execute the parallel version OpenSees MP on a local computer, the following three items are required: 1) A multi-core computer, 2) Installed MPICH2 binary (available for download from the following URL http://www.mcs.anl.gov/research/projects/mpich2) and 3) Installed OpenSees MP and TCL software. The installation of MPICH2 requires the following steps: 1. Check if the installation requires that windows SDK need to be installed on the computer. 2. Open an admin command prompt by right-clicking on the command prompt icon and selecting “run as administrator”. 3. Run “msiexec /i mpich2-1.3.2p1-win-ia32.msi” from the admin command prompt to install MPICH2. 4. During the installation, select the option that installs MPICH2 for all users. 5. Run “wmpiconfig” and store username/password where the User account must also be an administrative one. 6. Add “C:\Program Files\MPICH2\bin” to the system path and reboot. 7. Check smpd using “smpd –status”. It should return “smpd running on $hostname$”. 8. To test the execution environment, go to the directory “$MPICHROOT\examples” and run “cpi.exe” using “mpiexec -n 4 cpi”. 9. Make sure that the 32-bit version is installed, even on a 64-bit system, as OpenSees is released as a 32 bit version. It is easy and straightforward to modify a tcl file for parallel computation. The example tcl file below loops over different ground motions, and it is modified from the sequential version by only adding six lines of code, as underlined in Figure A.1. Two of the commands in the tcl file for parallel runs are “getNP”, which returns the number of processes in the computation and “getPID”, which returns the unique process id, 0 ≤ id ≤ NP − 1 . To run an application with NP processes, the following command is used on the command prompt “mpiexec -np numProcs? applicationName? inputFile?”. Here, mpiexec is an MPICH2 or OpenMPI application, numProcs is the number of processors, NP, to be allocated on the local computer, applicationName is OpenSees MP, and inputFile is the name of the tcl script. An example of such a command is “mpiexec –np 4 OpenSeesMP main.tcl.” In order to be able to run OpenSees in NEEShub, the following steps are required: 1. Register in NEEShub using this URL http://nees.org/. 2. Launch the OpenSees Lab in Tools. 3. Download SynchroNEES, through which one can upload and download files and results. It is recommended to use SynchroNEES to upload files to “My NEEShub Files” and download results from “My Scratch Files”, which allows uploading and downloading multiple files together. 4. Submit the job application. In order to submit the job application in this window, one has to perform the following sub-steps: a) Write the path of the previously uploaded file in the blank space of the “Main Script”, e.g. “/home/neeshub/benliangxiao/data/sessions/41000L/main.tcl”. b) Select the cluster from “Resource”, where the available options are NEES (16 processors), Ranger (4096 processors), Steele (4232 processors), and Hansen (96 pro-
3135
Khalid M. Mosalam, Xiao Liang, Selim Günay and Andreas Schellenberg
5.
cessors). It should be noted that a support ticket needs to be submitted under “Support” at the top right portion of the screen under “Support” to get access to Ranger and Steele. c) Choose the application, where the available options are OpenSeesSP and OpenSeesMP. d) Select the number of processors. e) Click on “Simulate” to start the analyses. It is beneficial to note that: • An email is sent to the user when the job is completed. • A user can have 5 sessions running at once. • The sessions stay alive until they are terminated by the user. • Each user gets a new data directory with each session. • Each user has default 1 GB storage, which is expandable to 10 GB. After Simulation, all the results and related information can be obtained from a specific location in a user’s scratch folder.
set pid [getPID] set np [getNP] set recordsFileID [open "peerRecords.txt" r] set count 0; foreach gMotion [split [read $recordsFileID] \n] { if {[expr $count % $np] == $pid} { source model.tcl source analysis.tcl set ok [doGravity] loadConst -time 0.0 set gMotionList [split $gMotion "/"] set gMotionDir [lindex $gMotionList end-1] set gMotionNameInclAT2 [lindex $gMotionList end] set gMotionName [string range $gMotionNameInclAT2 0 end-4 ] set Gaccel "PeerDatabase $gMotionDir $gMotionName -accel 384.4 -dT dT -nPts nPts" pattern UniformExcitation 2 1 -accel $Gaccel recorder EnvelopeNode -file $gMotionDir$gMotionName.out -node 3 4 -dof 1 2 3 disp doDynamic [expr $dT*$nPts] $dT if {$ok == 0} { puts "$gMotionDir $gMotionName OK" } else { puts "$gMotionDir $gMotionName FAILED"} wipe} incr count 1;} Figure A.1. Example tcl file for looping over different ground motions as modified from the sequential version by adding the underlined lines
3136