kl--", 1993
45300-4540 Nucleic Acids Research, 1993, Vol. 21, No. 19
Oxford University Press
An adaptive, object oriented strategy for base calling in DNA sequence analysis Michael C.Giddings, Robert L.Brumley Jr, Michael Haker and Lloyd M.Smith* Chemistry Department, University of Wisconsin, 1101 University Avenue, Madison, WI 53706, USA Received June 18, 1993; Revised and Accepted August 18, 1993
ABSTRACT An algorithm has been developed for the determination of nucleotide sequence from data produced in fluorescence-based automated DNA sequencing instruments employing the four-color strategy. This algorithm takes advantage of object oriented programming techniques for modularity and extensibility. The algorithm is adaptive in that data sets from a wide variety of Instruments and sequencing conditions can be used with good results. Confidence values are provided on the base calls as an estimate of accuracy. The algorithm iteratively employs confidence determinations from several different modules, each of which examines a different feature of the data for accurate peak identification. Modules within this system can be added or removed for increased performance or for application to a different task. In comparisons with commercial software, the algorithm performed well.
INTRODUCTION One of the important goals of the Human Genome Initiative is the development of technologies for automated, high-speed DNA sequencing. Such technologies are essential for sequencing the entire genome. A significant part of this development is in the area of data handling and analysis. Currently, most DNA sequencing is performed by polyacrylamide gel electrophoresis in manual or semi-automated systems (1). In semi-automated systems, data is collected through a detection apparatus that yields an analog signal. The signal represents the time varying concentration of fluorescently-labelled DNA fragments travelling through a detection region. The base calling process consists of determining the base sequence from this analog signal. In conventional radioisotopic DNA sequencing, base calling is generally performed by a human reading autoradiograms of the sequencing data. A human gel-reader is exceptionally good at performing the complex pattern-recognition needed to correctly analyze base sequence from such data. This may be aided with a. scanning device, but nonetheless, the process is tedious and time-consuming. The automation of this process is an important aspect of sequencing technology, particularly.-for high speed fluorescence based sequencing instruments. Signal variability and noise present in the analog data can make it difficult to produce *
To whom correspondence should be addressed
a computer algorithm that provides accurate base calls (2). The algorithm must be able to recognize real fragment peaks of varying height and shape in the presence of false peaks due to noise and other spurious signal variations. Most of the previous work in this area consists of gel-scanning software for reading autoradiographic films (3,4) and software that has been implemented for use in fluorescence-based commercial instruments, such as the Applied Biosystems Incorporated (ABI) 373A [Applied Biosystems, Foster City, CA] or the Pharmacia Alf [Pharmacia, -Uppsala, Sweden]. Although the latter commercial software is quite effective, the lack of any published description of its operation has impeded progress in the development of improved software or new algorithms for this and related tasks. It is necessary for these algorithms to be in the public domain for work to proceed on their integration into higher level aspects of sequence data handling such as fragment assembly, cross-checking, and the assignment of confidence values of fmiished data. In this paper, a data analysis program is described which has an object-oriented, modular algorithm as the foundation of the base calling process. The program can analyze data from a variety of DNA sequencing instruments, rapidly and accurately base label the fragments, and provide confidence levels on each of these base calls. The base calling algorithm works independently of any pre-defmed calibrations to specific instruments or data collection methods. Object-oriented programming has been used here due to the modularity and extensibility provided by this technique. Object oriented programming is a paradigm that promotes the modularization of code through the use of 'objects' (5). An object consists of code and data related to one task within a program or algorithm. Objects are arranged in a hierarchy of inheritance so that objects lower in the hierarchy 'inherit' all the functionality and features of ancestors. This makes it simple to develop sets of objects that have common features due to a shared ancestor, yet add their own specific functionality to the inherited features for a particular application. Additionally, objects can be re-used for other purposes, or new objects developed to replace old ones. This object-oriented modularity was utilized to create 'feature detectors', each of which is an independent object that analyzes a particular feature of the analog data to aid in base identification. For example, we have created detectors that examine the features of peak height, peak spacing, and peak width. Other feature detectors can easily be added, or the current ones replaced. This
Nucleic Acids Research, 1993, Vol. 21, No. 19 4531 framework is highly flexible and can potentially be used for tasks besides base calling with the correct modules in place. The algorithm presented here is based on some of the concepts used in Blackboard systems (6). These systems aye an artificial intelligence technique which use independent 'knowledge sources', each with their own expertise, to collaborate on solving a problem. Blackboard methods were originally conceived for pattern analysis tasks such as voice recognition, and therefore seem well suited to pattern recognition tasks like base calling. An important aspect of this work is the assignment of confidences to each base label. This is one step toward improving the speed and accuracy of the fragment alignment process (7). Low confidence labels indicate regions that may warrant further examination by a human due to some problem with the analog data quality, and if the confidences are carried through the fragment assembly process, they can be used to indicate the quality of sequences that are stored in public databases such as GenBank. I In this paper, we give an overview of the data collection and handling, the pre-processing that occurs before base calling, and a description of the algorithm developed for base calling. In addition, data quality and the value of providing confidence values with base labels is discussed. Data collection and preparation In the four-color strategy, DNA fragments are labelled with one of four fluorophores depending upon the nucleotide at which they terminate (A, C, G, or T). This allows all four reaction mixtures to be electrophoresed concurrently in one lane on a gel. Data is collected with a detection system at four distinct wavelengths to allow determination of the concentration of each dye present in the detection region at any time during electrophoresis (8). Four color fluorescence based sequence data from three systems was analyzed in this study: a) horizontal ultrathin gel electrophoresis (HUGE) (9,10), b) a capillary gel apparatus (11), and c) a commercial sequencer (ABI 373A). Different optical and electronic configurations of these instruments result in differences in the acquired data. However, in each case, preprocessing software reduces the 'raw data' to a 'trace file' for input to the base calling algorithm. Each trace file consists of four channels of data, each channel representing the time-varying concentration of one of the dyes labelling the four different end terminated fragments. One trace file is generated for each sample lane (or single capillary). The next section outlines the steps we use for producing a trace file from the raw data collected on the HUGE sequencing instrument (10).
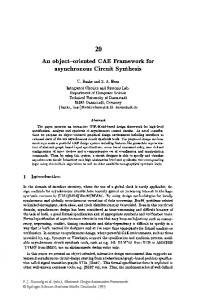
Pre-processing the data In each of the instrument configurations mentioned, data is collected at four wavelengths in the detection region at specific intervals. This produces an 'image' file which is four n x m of intensities collected at the four different frequencies, where n is the total number of sample intervals during the run, and m is the number of data points collected across the gel in each sample interval. Figure 1 shows a section of an image file where several sample lanes can be seen. From this type of image file, there are several steps involved to produce each trace file. These steps are: lane finding, data editing, multi-component analysis, noise filtering, dye-mobility correction, and normalization of the data. Figures 2 a -c show representative data at different stages of this pre-processing.
Base 110 25 min. -
3t
I =",
"
Base 250 - 44 min. Figure 1. A section of a four-color, fluorescence based gel image file. The vertical axis represents time during the run, and the horizontal axis represents the detection region across the gel.
Lane finding. The lane finding process consists of determining the regions, or 'lanes', in the image file corresponding to samples undergoing electrophoresis. Each lane is seen in the image file as a sequence of colored bands along the time axis as shown in Figure 1. Lanes are demarcated manually on the gel image file displayed on the computer. Although manual, this process is straightforward. A four channel raw data file is produced for each lane marked. This raw data file represents the signal intensity at all four wavelengths for each sampling interval. Each of the subsequent steps of pre-processing and base calling are applied in turn to each of the raw data files produced through this process. Data editing. The data produced from the lane finding process begins at the start of electrophoretic separation, well before the primer peak, and often continues to a point at which most or all of the fragments have passed the detection region. It is generally desirable to eliminate those portions of the data that are irrelevant to analysis, which includes the data before the primer peak and data near the end of the run where resolution or sensitivity is low. This is currently a manual process where the user selects these undesirable regions of the raw data file with the mouse and deletes them.
Multi-component analysis. The fluorophores employed in the four-dye sequencing strategy have distinct emission spectra. These spectra exhibit significant overlap (8, 12). This necessitates a transformation by multi-component analysis to determine the relative concentrations of the four dyes from the fluorescence
intensity measured at four different wavelengths (13). Every time point in the raw data file consists of intensity values at the four wavelengths being detected. These four intensities at
:R~ ~
4532 Nucleic Acids Research, 1993, Vol. 21, No. 19
a
\
A
A
P0
A
-
v' -PvJ4Jk\ WxPeced(x), one is returned.
Producing the finished sequence. After the iterative portion of the algorithm is completed, a final step must be performed to insert bases in appropriate locations where no base was called because of low signal strength or other problems. Peaks often need to be inserted late in the run where the decreased resolution
produces large peaks that actually consist of several fragments in a row. To determine how many individual fragments a given peak represents, the calibration curve from the width object is used, and appropriate bases are inserted above a user settable threshold for maximum width tolerance. In the case of gaps due to GC compressions or areas where base calling could not initially be determined with reasonable confidence, the calibration from the spacing object is used to determine where bases or 'no-calls' must be inserted to avoid gaps in the sequence. Once again, there is a user settable parameter that gives a tolerance threshold above which bases are inserted. For example, if this threshold is set at 1.8, then the algorithm will insert a base at a particular location if the gap between successive bases is more than 1.8 times the expected spacing at that location. After this step, a final base labelling is produced, along with a confidence value for each base and an average confidence level for the entire sequence. This sequence can then be used in fragment assembly or for other purposes.
Setting parameters. The base calling algorithm requires that the
several parameters for operation(Table 1). There is a standard set of parameters that works well for most data presented to the program so far. These parameters can be further optimized to increase performance on data from any particular instrument. For the experiments performed and reported here, a set of parameters was determined that worked well for data from the ABI instrument. This set of parameters was used for all ABI experiments reported. Sets of parameters were also determined which work well for the ultrathin slab gel system and the capillary
user set
system. Though these are relatively simple parameters conceptually, it is important that they are chosen well for the best performance of the algorithm. In practice, it is easy to find a set that works for data collected under given experimental
4538 Nucleic Acids Research, 1993, Vol. 21, No. 19 conditions. These parameters then do not need to be adjusted unless the experimental conditions change.
1
RESULTS Data from three sources has been utilized to test the base calling algorithm. Figure 7 a-c shows base called data from three different systems respectively: our current ultrathin slab gel instrument (10), our capillary electrophoresis system (11), and an ABI 373A commercial DNA sequencing instrument, respectively. In each of the panels, the same section of sequence data obtained from the sequencing sequencing vector in M13mpl9. Though this is the same fragment section, there are a number of things that vary such as: the number of points sampled, the time-scale, the resolution, and the sensitivity. This illustrates the similar performance of the algorithm on data that varies in source and quality. To quantitatively measure the performance of this system, we analyzed nine sequencing reactions that were separated on an ABI 373A, and compared the performance of the commercial basecalling algorithm to ours. For this comparison, the single stranded phage vector M13mpl9 was utilized in each reaction. The separations were performed and data collected utilizing the commercial instrument. All pre-processing was performed by the ABI software so that the same trace files were produced for basecalling by both our program and the ABI program. Base calling was performed with a single set of parameters for our program, and with the standard settings for the ABI software. The resulting base sequences were compared to the published M13mpl9 sequence in GenBank using the 'bestfit' routine in the Genetics Computer Group Sequence Analysis Software Package [Genetics Computer Group, Madison, WI]. This routine uses the Smith and Waterman local homology algorithm (21) to find the regions of best homology between two sequences. One metric given by this routine to judge how well two sequences match is called the quality ratio. This is given by, Qual Ratio
Matches - (0. 9 x Mismatches + Gap count + Sum of gap lengths)
- ~ ~ ~Base
Finder
0.85
0.8
100
200
300 400 Base Number Aligned To
500
Figure 8. Sequence alignment accuracy comparison between base calls from our algorithm and the commnercial ABI software, averaged for eight samples. Alignment accuracy is shown for comparisons fromlOO up to 500 base calls from the primer. The experimental conditions were: 6% polyacrylamide, 7.8M Urea, 30 Watts constant power.
1.0
HUGE base-called data
r
*** *
0.9X 0 -W
?
0.8-
0 0.7
-
0.6 40.60
0.65
0.70
0.75
0.80
Mean confidence
Sequence length
(9) Each corresponding fragment sequence produced by the ABI software and our own algorithm were compared for fit to the published sequence. Figure 8 shows the average of these comparisons over the nine samples for alignments from 100 to 500 bases in length. Due to decreased resolution and other factors, data quality had deteriorated significantly in all runs by the 500 base mark. Though on average our algorithm performed better for all lengths of fragment aligned, it is interesting to note where the difference is more pronounced. In the alignment to 100 bases, both algorithms had a lowered quality ratio due to anomalies such as GC compressions and mobility shifts that occurred in this region. However, because the overall data quality was high excepting these anomalies, the modules in our algorithm were able to make very good calibrations in this region, providing for more accurate base calling. As the graph shows, alignment quality climbs for both programs to a maximum somewhere between 200 and 300 bases, and then decreases rapidly. This is where our algorithm drops in performance to a level similar to the ABI software. This is
Figure 9. A graph of the correlation between alignment accuracy (quality ratio) of sequences produced by the program and mean confidence values. The data is from eighteen samples run on the HUGE system under the same conditions as in figure 7.
due to the degradation in the quality and consistency of the data in this region, making it more difficult to perform effective calibrations for features such as peak spacing and width. Though the algorithm continues to perform reasonably in comparison to the commercial package, it illustrates that the greatest strength of this algorithm is in regions where the data quality allows for accurate calibrations of the modules. Another experiment was performed to evaluate our preprocessing software and examine the correlation between average confidence values and quality ratio. For this purpose, 18 samples were analyzed that were separated by HUGE on four different gels. Data was collected from each gel for a maximum of 70 minutes of electrophoresis. From the image file, lanes were chosen, and each sample lane was pre-processed identically. First, the raw data from the beginning of the electrophoresis run to
Nucleic Acids Research, 1993, Vol. 21, No. 19 4539
the primer peak was deleted. Next, the data was noise filtered by applying the Fast Fourier Transform filter, multi-component analysis was performed, mobility shift correction applied and the data was normalized. All of the parameters for the pre-processing steps were the same for all samples. For comparing base calling accuracies each trace file was edited further, such that each file contained the identical section of the M13mpl9 DNA sequence (from base 81 to base 458). The processed trace file was then base called using standard settings for the feature-detecting modules. The sequence of each file was compared to the correct sequence using the GCG software package described above. The quality ratio was plotted versus mean confidence for each sample (Figure 9). Quality ratios ranged from 0.611 to 0.964 and mean confidences ranged from 0.644 to 0.798. Figure 9 shows that data with mean confidences of 0.74 and higher yield base calls with quality ratios of approximately 0.9 or higher. The relationship between quality ratio and mean confidence is approximately linear from 0.74 to 0.65. Thus, the average confidence for a particular data set is a good indicator of the accuracy of the base called data.
DISCUSSION An important part of the base calling process is the preprocessing. These steps directly influence the data quality passed to the algorithm, and thus directly affect performance. The steps presented here for pre-processing are not unique; there are numerous other possibilities for signal conditioning, particularly in the areas of normalization and noise filtering. One aspect of the pre-processing that may need further work is the dye-mobility shift correction. It has been observed in some data that the mobility-shift correction is different in the region of the first 40-50 bases from the primer than for the rest of the separation. This may be due to an effect such as a differing separation mechanism for shorter fragments during electrophoresis. This problem can be addressed by removing the first 40 bases of data, however, this decreases the amount of useable sequence produced in each run. It may be desirable to experimentally determine the function representing these mobility offsets so they can be better modelled and compensated for. After pre-processing, trace files are produced which can widely range in quality due to the sequencing method used, the conditions, the fragment being sequenced, and also the way in which pre-processing was performed. To indicate how these variations have affected base calling, final confidence values are returned on each base label. These values range from near zero to one. As explained earlier, these confidence values are the geometric mean of the input of the input of the judgement modules incorporated in the program. Because the current modules examine peak spacing, height, and width, the confidence values for each base are directly related to these features of each peak where a base label has been placed. This means that small, highly overlapped, or closely spaced peaks will receive lower confidence values. Regular, consistently spaced peaks with little signal overlap in other channels will receive the highest confidence values. These confidence values can potentially be used in fragment alignment algorithms to provide more information regarding the expected accuracy of each base, particularly in regions where there are disagreements or gaps during alignment. Additionally, areas of low-confidence can be used to pinpoint areas where problems occurred with some part of the experiment and thus need further attention.
As discussed, an average confidence of all the bases called for each trace file is calculated. This average is affected by several things, including a) the minimum confidence threshold set by the user, b) the signal strength, and c) resolution. The setting of the minimum confidence threshold for including a base call has several effects. If decreased, then more low confidence bases are included in the list, and a decreased average results. Increasing the parameter increases the average until a point is reached where the threshold is so high that many bases are discarded. At this point, the program attempts to compensate for these regions of missing base calls by inserting bases according to the spacing calibration, and these inserted bases may have lower confidence levels depending on where they are inserted. Another factor to be considered is the algorithm's speed. All tests were performed on a 33 MHz 68040 based workstation. For data obtained on the commercial ABI instrument as reported above, base calling takes 7-12 seconds which includes peak finding, iteration, and base insertion in gap areas. For high quality data, the average confidence typically converges to a stable value within 2-3 iterations, each of which takes less than one second. For lower quality data where there are resolution or sensitivity problems, convergence does not occur as rapidly, and iteration is often terminated at the user settable maximum iteration count. Though the resulting sequence is often useable (and comparable in quality to the resulting sequence from the ABI system), the lack of convergence can indicate that there is some problem with the trace file input to the algorithm.
Conclusions and future work As mentioned, there are a number of parameters necessary for the user of the program to choose in order to achieve the best performance for data from a particular instrument or set of experimental conditions. Choosing the parameters allows the operator flexibility in experimental conditions or instrument configurations. However, adjusting the parameters requires knowledge and some experimentation with different combinations of settings. It is desirable that this process be automated for users who do not have the background to effectively choose parameters, or for those who may be changing parameters quite often because of changing experimental conditions. We hope to continue towards this automation at the various steps of pre-processing and for the base calling algorithm. It is anticipated that the same algorithm and programs written here could be used on data from other sequencing techniques, possibly including Mass Spectrometry (22) and other new approaches to sequence analysis. The only requirement would be that the data is in a similar four-channel, peak-by-peak format. Data from alternative sequencing technologies would be likely to have similar requirements for peak recognition and base calling. Finally, we plan to soon modify one of the existing fragment alignment algorithms to incorporate confidences, and then to perform comparisons on the accuracy of the resulting consensus sequences with those obtained from unaltered alignment algorithms. We expect an improvement in the alignment accuracies due to the extra information available on each basecall in comparison to purely statistical consensus techniques. This may help especially where there are disagreements or gaps encountered in aligning fragments. Additionally, a confidence value maybe returned for each base in the finished, assembled data. These confidence values would be available to assist researchers using the sequence information.
4540 Nucleic Acids Research, 1993, Vol. 21, No. 19 Algorithm availability We have developed the algorithm as part of a program for data collection and analysis that is still expanding. The program was written in Objective-C and runs on NEXTSTEP based computers (NeXT hardware or Intel-486 based personal computers running NEXTSTEP). Source and executable code for the current version are available via FTP. For information via electronic mail, send a message to:
[email protected].
ACKNOWLEDGEMENTS We would like to thank John Luckey and Xinchung Tong for data, and Doug Kolner for sequencing reaction mixtures. This work was supported by NIH Human Genome grant # HG00321 and DOE Human Genome grant # DE-FG02-90ER61026.
REFERENCES 1. Hunkapiller, T., Kaiser, R.J., Koop, B.F., and Hood, L. (1991) Science, 254, 59-67. 2. Sanders, J.Z., MacKellar, S.L., Dodd, C.T., Otto, B.J., Heiner, C., Hood, L.E., and Smith, L.M. (1990) Structure & Methods, Volume 1: Human Genome Initiative & DNA Recombination, Eds. R.H. and M.H. Sarma, Adenine Press, 89-102. 3. Elder, J.K., Green, D.K., and Southern, E.M. (1986) Nucleic Acids Res.,
14, 417-424. 4. West, J. (1988) Nucleic Acids Res., 16, 1847-1856. 5. NeXT Publications (1993) NeXTSTEP Object-Oriented Programming and the Objective C Language. Addison-Wesley Publishing Company, New York, USA. 6. Hayersroth, B. (1985) Artificial Intelligence, 26:3, 291-321. 7. Waterman, M.S. (1984), Joumal of Mathematical Biology, 46, 473-500. 8. Smith, L.M., Sanders, J.Z., Kaiser, R.J., Hughes, P., Dodd, C., Connell, C.R., Heiner, C. Kent, S.B.H., and Hood, L.E. (1986) Nature, 321, 674-679. 9. Brumley, R.L. Jr., and Smith, L.M. (1991) Nucleic Acids Res., 19, 4121-4126. 10. Kostichka, A. J., Marchbanks, M. F., Brumley, R. L., Drossman, H., and Smith, L. M. (1992) BiolTechnology, 10, 78-81. 11. Luckey, J.A., Drossman, H., Kostichka, A.J., Mead, D.A., Dcunha, J., Norris, T.B., and Smith, L.M. (1990) Nucleic Acids Res., 18:15, 4417-4421. 12. Karger, A.E., Harris, J.M., and Gesteland, R.F. (1991) NucleicAcids Res.
19, 4955-4962. 13. Smith, L.M., Kaiser, R.J., Sanders, J.Z., and Hood, L.E. (1987) In: Methods In Enzymology, Vol. 155, pp. 260-301. 14. Erickson, C.L., Lysaght, M.J., and Callis, J.B. (1992) Analytical Chemistry, 64, 1155-1163. 15. Janssens, F., and Francois, J.P. (1991) Analytical Chemistry, 63, 320-331. 16. Press, W.H., Flannery, B.P., Saul, A.T., and Vetterling, W.T. (1986) Numerical Recipes The Art Of Scientific Computing. Cambridge University Press, Cambridge, England, 386-429. 17. Smith, L.M., Fung, S., Hunkapiller, M.W., Hunkapiller, T.J., and Hood, L.E. (1985) Nucleic Acids Res., 13, 2399-2412. 18. Fujii H., and Kashiwagi, K. (1992) Electrophoresis, 13, 500-505 19. Bowling, J.M., Bruner, K.L., Cmarik, J.L., and Tli,betts, C. (1991) Nucleic Acids Res., 19, 3089-3097. 20. Watzig, H. (1992) Chromatographia, 33:5-6, 218--224. 21. Smith and Watennan (1981) Advances in Applied Mathematics 2,482-489. 22. Parr, G.R., Fitzgerald, M.C., and Smith, L.M. (1992) Rapid Commun. Mass Spectrom., 6:369-372.