mobile ad hoc networks (MANETs). Researchers ... Key words: Wireless ad hoc and sensor network, network simulation, .... Table 1: Parameters for the race-free protocol simulation. Parameter ..... http://cnr.kaist.ac.kr/lecture/te523 2008/download/ Lab08 TA ... http://www.welzl.at/research/tools/ns/welzl-ns-tutorial.ppt,. 2008.
IJCSNS International Journal of Computer Science and Network Security, VOL.10 No.12, March 2012
51
An Efficient Object-Oriented Architecture for the Design and Implementation of an Adaptable Network Simulator Imad Jawhar College of Information Technology UAE University, Alain, UAE
Summary Simulation is an important part of the design and evaluation of networking protocols. Currently, there exist several network simulation tools which are available to researchers such as OPNET, ns-2, and others. Although they are very useful for a wide range of simulation experiments which involve performance evaluation of existing protocols that are supported by these tools, selecting them to verify and test the performance of new platforms and protocols that are not implemented in these programs tend to have considerable restrictions and limitations. Therefore, implementing these protocols in existing simulator packages could be relatively very difficult and time consuming. Consequently, many designers find out that it is more practical, time efficient, and often necessary to design their own simulator which includes the protocol they are evaluating. This paper presents the architecture and design of a typical object oriented event-driven network simulator. In order to validate and optimize the design, it was applied to implement a simulator which was used to evaluate the performance of two routing protocols for mobile ad hoc networks (MANETs). Researchers can use this framework to design a network simulator which can be used to accurately implement, evaluate, and optimize their networking models, architectures, and protocols.
Key words: Wireless ad hoc and sensor network, network simulation, simulator design, object-oriented design.
1. Introduction Advancements in the area of network protocols and architectures are constantly taking place as the corresponding technologies are developed. In addition, numerous new networking applications and platforms are created in response to evolving social, and commercial requirements. An essential part of research methodology is the simulation of newly created or optimized network models and protocols. Currently, there exist several network simulation packages such as OPNET [1], ns- 2 [2], and others. These packages can be reasonably easily used to study the performance of many networking protocols and platforms they support. However, practice has shown that implementing new protocols which are significantly different from the ones which are supported This work was supported in part by UAE Research grant 04-03-9-11/09. Manuscript received March 5, 2012 Manuscript revised March 20, 2012
using these simulation packages is very difficult. Consequently, many researchers are faced with the need to design their own simulator software in order to implement and study the performance of new network protocols and platforms which are significantly different from the ones supported by these off-the-shelf packages. This is a good alternative as long as the researcher is able to design this simulator in a reasonably short period of time and use the proper design and validation techniques. This paper, presents architecture and design techniques of a typical event-driven network simulator which uses the object oriented design methodology. The simulator can be used to analyze the performance of typical wireless networks including mobile ad hoc and sensor networks.
1.1 The ns-2 network simulator As mentioned earlier, one of the most popular network simulation packages is the ns-2 (network simulator, version 2) [2]. It is an open source software that is available on the Internet. It can be used for simulation of different algorithms and protocols such as IP, TCP (Tahoe, Reno, Newreno, SACK, Vegas), UDP, Ethernet, ARP, 802.11, DSDV, AODV, TORA, DiffServ, IntServ, and wireless ad hoc networks [3]. It also supports different queueing techniques such as Drop tail, RED, FRED, REM, DRR, and SFQ. The wireless and mobility extensions to ns-2 are a result of the Monarch project. A good number of researchers have contributed code that is used with ns-2. Although this simulator is text-based and does not have GUI capabilities for creating topologies and interfaces, it has features that allow the graphic visualization of the network and node activities such as transmission and reception of packets. The ns-2 simulator contains two sets of languages OTcl (Object oriented extension of the Tool Command Language) and C++ [2][4]. The OTcl language is used for setting up the simulation, configuring objects, and scripting simulation topology and events. Specifically, OTcl is used to do the following: (1) Allows the user to perform some simulations by varying different parameters and configurations. (2) Investigate different scenarios. (3) Determine the simulation model by setting parameters such as the number of iterations. On the other hand, the
52
IJCSNS International Journal of Computer Science and Network Security, VOL.10 No.12, December 2010
C++ language can be used for programming each object in the simulation structure and topology. Specifically, it can be used for the following reasons: (1) Create new objects that might be needed in some specialized simulations of new protocols that are not supported. (2) Increase the speed and efficiency of the simulation process. (3) Perform byte manipulation, packet processing, algorithm implementation, or change the actions performed by different modules. The ns-2 simulator provides some advantages due to its existence as an open source code [5]. It allows building upon existing work, and allows others to use the researcher’s work. However, it also has the disadvantage of being huge and complicated. In addition, it has relatively poorly maintained documentation and the possibility of sometimes having missing components and unexpected bugs which can be significantly time consuming to discover, isolate, and fix.
1.2 The OPNET network simulator OPNET (Optimized Network Engineering Tool) [1] is another available network simulation package. It is one of the leading existing network simulators in the market. The OPNET simulation software costs in the order of several thousand dollars for a single license. Although free licenses are available for educational purposes, it provides a graphical user interface that allows the user to create networking models using a drag and drop approach. It is designed using a discrete event driven simulation approach and applies an object-oriented design methodology [6]. In addition, OPNET uses a hierarchical modelling strategy that allows the user to choose the desired specifications and protocols including physical layer components such as transceivers, antennas, queue management, nodes with process modules, and a networking model that is used to connect them. In addition, packet formats that are to be used with the communication protocols can be programmed into the model. The hierarchical model building has the following modules [7]: (1) Network Editor which allows the user to build the network topology, (2) Node Editor which is used to define data flow models, (3) Process Editor which is used to specify control flow models. Through these editors, the user can specify models at three different levels: the network domain, the node domain, and the process domain [8]. Modeling in the network domain can be used to hide the complex structure of the lower level component which would be invisible to the user. For running simulations, it has a simulation tool to define and run the simulation, and a debugging tool. For results analysis, it has a probe editor to specify the points where data needs to be collected, an analysis tool, data filtering tool, and an animation viewer
to display the behavior of the network in case that is needed. OPNET operates at the packet level, and has a large library of models for existing network hardware and software protocols. It allows the running of external code components through its External System Domain (ESD) tool.
1.3 Other network simulators In addition to the simulations mentioned above, there are other more specialized network simulators such as REAL [9][7], which is used to study congestion control schemes in packet switched data networks, INSANE [10], which is used to simulate IP-over-ATM algorithms with traffic loads that are derived from real traffic measurements, NetSim [7], which is used for simulation of Ethernet networks, and Maisie [11] which uses a C-based language for using parallel discrete event simulations. In Maisie, a logical process is used to model one or more physical processes. The events in the physical system are implemented using message exchanges among the corresponding logical processes in the model. Additionally, Parsec and MOOSE are object-oriented extensions to Maisie. The rest of the paper is organized as follows. Section II presents an overview of the event-driven simulator design. Section III discusses each of the classes that are used. Section IV presents the simulation process and its phases, and the last section provides the conclusion.
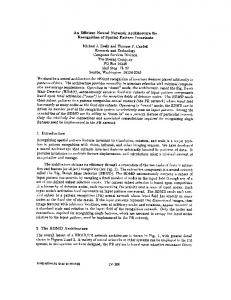
Fig. 1 A simplified example of the route discovery process.
IJCSNS International Journal of Computer Science and Network Security, VOL.10 No.12, December 2010
2. Event-Driven Simulator Design Overview The simulator design that is presented in this paper is event-driven and is implemented using an object-oriented design approach. It starts by creating the required simulation objects including the area, nodes, event priority queue (EPQ), and graph objects. It loads the EPQ with the initial data messages with each message having source, destination nodes, arrival time, and message length as the main parameters. It then starts the simulation process by deleting events from the EPQ according to their time of occurrence, executing them by updating the required objects and keeping the required statistics, and inserting any newly generated events into the EPQ. This process continues until the EPQ is empty. Then, the program outputs the simulation results to the user.
2.1 A case study: the simulation of a typical wireless ad hoc and sensor network In order to illustrate the design of the event-driven simulator, a case study is presented. The case study involves the simulation of a DSR-based routing algorithm and the study of its performance in a wireless ad hoc network [12][13][14]. An ad hoc network is a wireless network where the nodes do not have a pre-existing infrastructure. It has a variable topology where the nodes join, or leave the network anytime [15][16][17][18][19]. Also, nodes can be mobile which means that the connectivity of the node with its neighbors as well as the topology of the network is variable. New communication links between nodes are created and existing ones are deleted as nodes move from one location to another. Each node in the network plays the role of an end point as well as a router in the data transmission process. Communication between source and destination nodes is established using multi-hop routes passing through intermediate nodes.
2.2 A simplified overview of a DSR-based routing process The routing protocol that is used in this case study is based on the Dynamic Source Routing (DSR) protocol [13]. It is ondemand which makes it more scalable. Nodes do not need to keep information about the entire topology, and routes are only discovered as the need arises. When a source node s wants to send data to another destination node d which is not within its transmission range, it will try to discover a multi-hop path to it. In order to do that, node s broadcasts a request (REQ) message to all of its neighbors. Each of the neighbors adds its ID to the accumulating path in the message and in turn forwards it
53
to all of its neighbors. This process continues until the REQ message reaches the destination, which then unicasts a reply (REP) message back to the source. Upon receiving the reply message, the source updates its routing table and starts the data transmission process. A simplified example of the route discovery process is shown in Figure 1. In the figure, node A is a source node that needs to send data to a destination node E. Node A checks its routing table and realizes that it does not have a path to E. Consequently, node A starts a route discovery process by broadcasting a REQ message to its neighbors B and F. Nodes B and F, not having processed a REQ message with the same (s, d, ID) tuple, check the information in the REQ message and realize they are not the destination and that they do not have a path to E. Each of them forwards the REQ message to its neighbors except for the node from which they received the request (i.e. A). This process continues until the REQ message reaches the destination E. One or more REQ messages might reach the destination. If more than one REQ message reaches the destination, a certain criteria might be applied by the destination in order to select one of the discovered paths. In our case, the destination responds only to the first REQ message it receives, thereby choosing the earliest discovered paths. Assuming that the REQ message propagating along nodes A, F, G, H, and E arrives first, the destination unicasts a REP message with the discovered path A-F-G-H-E to A. Subsequently, the destination simply drops any subsequent REQ messages that might arrive later through different paths. Upon receiving the REP message, node A updates its routing table and starts the data transmission process along the discovered path. Table 1: Parameters for the race-free protocol simulation Parameter Value Network Area 600 x 600 m2 Number of Nodes 30 Transmission Range 150 m Data Packet Size 512 bytes Number of Sessions 50 Maximum Session Time 4000 s
2.3 A sample of simulation parameters Table 1 shows a sample of simulation parameters for the case study network. The number of nodes, n, is 30. The nodes are contained in an area of 600x600 m2. The range of each node is set to 150 m. The message length is randomly selected according to a uniform distribution with a range from 0 to 1000 Mbytes corresponding to a session length range of 0 to 4000 sec. In some simulation experiments, the traffic rate could be varied to study its
IJCSNS International Journal of Computer Science and Network Security, VOL.10 No.12, December 2010
54
impact on different network performance measures such as throughput and path acquisition delay. The session (or data message) arrival is a Poisson process with a mean which could be varied as needed.
printSimHeader(): prints the title, and the header of the simulation (e.g. Simulator name, version number, date, etc.)
3.2 Area Class Simulator 1
1
One area object is created from this class. It holds most of the other objects in the simulation including the array of nodes, an event priority queue, and graph.
1 Uses
1
1 1 1
Graph
Uses
1
Uses
Node
1
1
1
Uses
Area
1
Stats
SimClock
Uses Uses
1
EPQ
*
REQ/REP
1 Uses
Uses
*
Event
Fig. 2. A structure chart of the simulator.
3. The Classes Figure 2 shows a structure chart of the simulator design which includes all of the classes and their relationships. The main class is the simulator class which includes the main() method. Also, it includes one of each of the following objects: an area, a stats, and a simClock object. In turn, the area class includes a graph, an array of nodes, and an event priority queue (EPQ) class. The EPQ class includes an array of events objects. The chart also includes the REQ/REP class which is used by the area class. All of the classes in the simulator, along with their functions, and relationships are discussed in this section.
3.1 Simulator Class This class has the main() method. The main() method instantiates the other objects in the simulator such as the nodes, EPQ, graph, and so on. It also has the method which loads the EPQ with the initial events. In most simulation cases, these events consist of the initial data transmission messages which occur at certain times according to the desired random distribution function. As indicated earlier, they are typically randomly generated according to a Poisson arrival distribution with an average arrival rate. Main methods in the class: main(): this is the main method of the simulation.
Main methods in the class: shuffle(): places the nodes in random locations within the area. generateGraph(): generates a new graph from the node locations and ranges. loadEPQwithInitMess(): load the EPQ with the initial data messages. updateAllNodePos(): updates the node positions based on the elapsed time, current node location, geographic destination, and speed. saveXYLocationsToFile(), getXYLocationsFromFile(): save/get node locations to/from a file. These methods are optional and can be used for testing purposes.
3.3 Node Class: The array of node objects is instantiated from this class. Each node contains the basic attributes such as: node ID, x and y geographic location coordinates of the node, and all tables that each node might need. Depending on the simulation, and network protocol requirements, these tables might include the routing table, cached information tables, tables that might hold status of different node communication parameters such as slot reservation status in a time division multiple access (TDMA) environment, and so on. Main methods in the class: getID(), setID(): get and set the node id. getX(), setX(), getY(), setY(), getSpeed(), setSpeed(): get and set the node coordinates associated with its geographic location in the area as well as the node’s speed. updateRoutingTable(): updates the node’s routing table with a discovered path for a certain destination. checkPath(): checks the routing table for a discovered path to a particular destination. forwardReqMessToNeighbors(),forwardRepMessToN eighbors(): forwards the REQ/REP message to the node’s neighbors by inserting the appropriate events in the EPQ.
IJCSNS International Journal of Computer Science and Network Security, VOL.10 No.12, December 2010
3.4 Event Priority Queue (EPQ) Class This is a priority queue of events. The key field in each event that is used for ordering the events in the queue is the time. The time is an integer number which indicates the time of occurrence of the event. The main interface methods in the EPQ class are the insertEvent() and deleteEvent(). In order to increase the efficiency of the process of inserting and deleting events, a heap structure is used to implement the queue [20]. This makes the time complexity for insertion and deletion as well as most other queue processing functions O(log(n)). Main methods in the class: isEmpty(): returns true if the EPQ is empty. insert(): inserts an event in the EPQ. deleteMin(): retrieves the event with the smallest time
3.5 Event Class The event objects that are instantiated from this class are the events of the event-driven simulation. Each event has the following main attributes: 1) Event time: An integer number which is the time stamp of each event. 2) Event type: An integer number which represents the event type. Examples of event types are: send request message, receive request message, send data message, receive data message, etc. 3) Source node ID: This is an integer number representing the ID of the source node that is sending a route request or data message for example. 4) Destination node ID: This is an integer number representing the ID of the destination node with which a particular source node wants to communicate. 5) Session ID: This is an integer number representing the message or session ID. For example, each node can have a running counter which generates the message IDs of the messages it generates. 6) Other attributes: Additional attributes are typically added, which are specific to the particular networking simulation that is required. Main methods in the class: getType(), setType(): get and set event type. getTime(), setTime: get and set event time. getNID(), setNID(): get and set the ID of the node concerned with the execution of this event. getReq(), setReq(), getRep(), setRep(): get and set the REQ/REP object attached to this event. An event like “receive request/reply message” would use this event field.
55
setDataMessLength(), getDataMessLength(): get and set the data message length (in bytes). An event like “send data message” would use this event field.
3.6 Stats Class This class is used to keep track of the statistics and results of the simulation. It contains attributes such as number of successfully transmitted messages, number of unsuccessfully transmitted messages, number of dropped packets, number of collisions, and so on. Each attribute has accessor and mutator methods to read and update the corresponding variable. The stats class also contains a printResults() method which prints the required results at the end of the simulation experiment. Main methods in the class: setSuccRecDataMess(), getSuccRecDataMess(): set and get the number of successfully received data messages. setRejDataMess(), getRejDataMess(): set and get the number of rejected data messages. setSuccRecDataPackets(), getSuccRecDataPackets(): set and get the number of successfully received packets. This can be different than the number of received messages because each message can have a different number of packets depending on its randomly generated length. setSendReqMess(), getSendReqMess(), setSendRepMess(), getSendRepMess(): set and get the number of request/reply messages. This can be used to measure the communication overhead. getTotPathAcqTime(), setTotPathAcqTime(): set and get the total path acquisition time. At the end of the simulation, the resulting value can be divided by the total number of acquired paths to get the average path acquisition time. setAcqPaths(), getAcqPaths(): set and get the total number of acquired paths. printSimRes(): prints simulation results.
3.7 Graph Class Typically, one graph object is instantiated from this class. It is a graph data structure. The structure could be using an adjacency matrix, or an adjacency list [21][22][23]. This graph has the nodes in the network as vertices, and the one-hop communication links between the nodes as edges. The graph is constructed by first making each node in the network a vertex in the graph. Then, the communication range, which is a simulation constant, along with the geographic coordinates of the nodes are used to determine the edges between the vertices in the graph. Edges are added between the nodes that are within range of each
56
IJCSNS International Journal of Computer Science and Network Security, VOL.10 No.12, December 2010
other. Specifically, an edge is added if the Euclidian distance between two nodes is less than or equal than the corresponding communication range. Later, in the simulation, the graph is used to determine the neighbors of each node by calling the getNeighborList(x) method which returns a list of the neighbors of a node x. This information is used to propagate route requests, route replies, data transmission messages, as well as any other types of communication between the nodes. Main methods in the class: clear(): deletes all edges in the graph. addEdge(): adds an edge between two nodes. printGraph(): prints the graph to the screen. This method can be used for testing purposes. selectRandNode(): selects and returns a random node. This method can be used to select random source and destination nodes for the exchanged data messages. isNeighbor(): returns true if two given nodes are neighbors of each other. getListOfNeighbors(): returns a linked list of neighbor nodes to a particular node.
3.8 REQ/REP Class Depending on the kind of network and simulation that is being designed, this type of classes might be needed. For example, in the case study presented earlier, which involves the simulation of the routing and data communication protocols in a wireless ad hoc and sensor network, a request (REQ) message is broadcast by a source node to all of its one-hop neighbors to initiate the route discovery process. The request message propagates through the network until it reaches the desired destination node which then responds by unicasting a reply (REP) message back to the source. When the source receives the reply message, it updates its routing table with the discovered path and starts the data transmission process. In this kind of networks, each one of the REQ and REP classes would contain attributes such as the source ID, destination ID, message ID, and a linked list of the IDs of the accumulated nodes along the discovered path. Main methods in the class: getS(), setS(), getD(), setD(), getSID(), setSID(): get and set source, destination and message IDs. getX(), setX(): get and set the node to which this REQ/REP is being forwarded. getPath(), setPath(): get and set the linked list of node IDs along the discovered path. printReq(): print the REQ/REP information.
3.9 SimClock Class
This is a very simple class which is used to keep track of the current time in the event-driven simulation. It has only one integer attribute named time. It also mainly has two methods: getTime() which is used to return the value of the time integer, and setTime() which is used to set the value of the same variable. Initially the simulation starts at time 0. As the next earliest event is retrieved from the event priority queue, the time of the simulation clock is set to the time stamp (time of occurrence) of that event. Note that because this is an eventdriven simulation, this is the only way the simulation time is advanced. This is one of the main powerful features of an event-driven simulation compared to a time-driven simulation. Only instances of time concerned with the occurrence of an event are simulated as opposed to simulating each tick of the clock. Consequently, the simulation time can advance in large steps skipping all of the time when no events happen. This method of handling time significantly increases the efficiency of the simulation process. Main methods in the class: reset(): reset the simulation time to 0. getTime(), setTime(): get and set the current simulation time.
4. The Simulation Process and Its Phases This section describes the main steps and functions used in the simulation process. Basically, the simulator starts by generating an area with certain dimensions and randomly places a predetermined number of nodes in the area. Generating the area object automatically instantiates all of the objects inside it including the event priority queue and the array of nodes. Then, the shuffleNodes() method of the area class is used in order to randomly shuffle the geographic locations of the nodes (x- and y-coordinates) within the designated geographic area. As indicated earlier, the nodes have a predetermined transmission range. From the placement of the nodes, a graph is generated which includes the nodes as vertices. Edges in the graph are constructed between the nodes/vertices that are within range of each other. Then the simulator generates a number of data messages with a certain length for each message. The length of the messages is generated randomly according to a certain desired distribution function. Each message has a randomly generated source and destination pair. The arrival times of the messages is according to a Poisson process with a certain mean interarrival time. As the messages are generated, the corresponding events with the send data message type are inserted in the event priority queue. When the send data message event is retrieved from the queue according to its arrival time, the corresponding source node initiates the route discovery process by sending a REQ message to all
IJCSNS International Journal of Computer Science and Network Security, VOL.10 No.12, December 2010
57
of its neighbors as indicated earlier. This is done by inserting corresponding events into the queue with a receive request message type and a time stamp equal to the current time plus the total request message transmission time. The REQ message is propagated in this manner through the intermediate nodes until it reaches the destination node. Then, similarly a REP message is propagated back to the source along the discovered path. Each node has a routing table as well as all of the tables needed for the routing algorithm. When the source receives the REP message, it updates its routing table with the discovered path and starts the data transmission process. All of the indicated activities are done by insertion and extraction of the corresponding events into and from the event priority queue. Stated in other words, the simulation starts with the initial events in the event priority queue. Events are extracted according to their time stamp. As each event is processed it might generate additional events which are inserted into the queue to be processed at a later time. This process of extracting, processing, and inserting events continues while updating the corresponding parameters and statistics in the stats object, until all of the events are processed, and the priority queue is empty. At this point, the simulation is ended, and the program outputs the results to the user. Consequently, the main loop in this simulation is the one that extracts events from the EPQ and processes them one by one. This while-loop, which is considered the event processing engine of the simulation, is in the main() method in the simulator class. Algorithm 1 presents the main simulation steps which consist of the initialization phase, followed by the event processing loop, and the printing of the results.
4.1 Simulation Initialization As illustrated in Algorithm 1, the simulation starts by creating the area object which includes the event priority queue (EPQ), and array of node objects. Also, the simulation clock is created and initialized. Then, the EPQ is loaded with the initial events which consist mainly of a number of send data message events. Each message has a source, a destination, a message ID, an arrival time, and message length. The source node ID, destination node ID, and message length are randomly created from a uniform distribution. The arrival time is also a random number generated according to an exponential distribution with a given average arrival rate. This creates Poisson arrivals which is typically the most realistic assumption for the message arrival process, and is used in most simulations. Then, the area.shuffleNodes() method is called to assign random geographic coordinates for each node within the area dimensions.
The area.clearAndGenerateGraph() method is called to generate the graph from the node locations and node transmission range. Nodes are represented by the vertices
58
IJCSNS International Journal of Computer Science and Network Security, VOL.10 No.12, December 2010
of the graph and edges are created between nodes that are within range of each other.
4.2 Event Processing After the initialization phase is completed, the main while loop, which constitutes the event processing engine is executed by extracting, and processing the event from the event priority queue. Events are retrieved according to their time stamp starting with the earliest event.
4.3 Printing of the Results As the simulation is performed, different simulation and performance measures are maintained in the corresponding variables in the stats class. These variables are updated constantly during the running of the program and are printed at the end of the simulation.
4.4 Mobility Simulation In some networking applications such as mobile ad hoc networks, node mobility might be required. Node mobility can be simulated using different mobility models. In the research, the Waypoint model is the most popular model [24]. In this model, each node is assigned a particular random speed between 0 and MAX_SPEED in meters/sec. Each node is also assigned randomly generated starting and ending geographic coordinates within the area. Then, each node starts moving from its starting geographic position towards its ending position at its assigned speed. When the node arrives at its ending position, it pauses for a PAUSE_TIME seconds. The PAUSE_TIME is a simulation parameter chosen by the researchers to characterize the mobility of the nodes. A low value for this parameter along with a high value for the MAX_SPEED parameters indicate a highly mobile environment. After the expiration of the pause time, the node is assigned a new random speed as well as a new geographic destination. Then, the node starts to move again at the new speed towards the new destination. When it arrives at the destination, it pauses and starts moving again, and so on. This process is repeated for each node until the end of the simulation experiment. In the simulator design, a MOBILITY_UPDATE event is executed every MOBILITY_TICK_TIME seconds. During the initialization phase of the simulation, a MOBILITY_UPDATE event is inserted into the EPQ. When this event is executed, it inserts another MOBILITY_UPDATE event at the current time + MOBILIT_TICK_TIME. Also, new node location coordinates are calculated for each node using the current geographic coordinates, node speed, and direction. The nodes are then placed at their new locations, and a new
graph is generated again using the node locations and transmission ranges. This mobility update results in new links being formed or deleted between neighboring nodes. The size of the MOBILITY_TICK_TIME should be selected in a manner that is appropriate for the required movement precision considering the value of MAX_SPEED. Obviously, a smaller MOBILITY_TICK_TIME value produces higher precision in the node mobility simulation. However, this increase of the precision in the mobility simulation comes at a cost of increasing the total simulation running time.
5. Sample Simulation Results The presented simulator framework was used to design an event-driven simulator in order to test and analyze the performance of a QoS routing protocol for MANETs [12]. The implementation was done using the C++ objectoriented programming language. In the experiments performed, two different QoS routing protocols for TDMA-based MANETs were compared. The first routing protocol uses a slot allocation scheme which is intended to avoid racing conditions. Such conditions can occur in MANETs when the route discovery of different source/destination pairs is being done simultaneously. The second protocol is an existing one which does not have this feature and is used as a reference for comparison. More details about the two protocols are beyond the scope of this paper and can be found in [12]. In the first set of experiments, whose results are shown in Figures 3 and 4, the traffic rate was varied. The results in Figure 3 show that the percentage of successfully received data packets after QoS path acquisition is close to 100 percent with the allocation-based protocol and it drops to around 30 percent with the non-allocation-based protocol as the traffic rate increases. Figure 4 shows that the allocationbased protocol pays a price for the improvement in the quality of the acquired path by a slight increase in the path acquisition time. This is expected since the allocationbased protocol is more conservative and “works harder” during path acquisition to discover a higher quality path than the other protocol. In the second set of experiments, presented in Figures 5 and 6, the same two protocols were compared with the same parameters. However, in this case the maximum node speed was varied which affected the mobility rate of the nodes. Figures 5 and 6 show that the percentage of successfully received data packets after QoS path acquisition decreases as the speed increases for both protocols. However, the allocation-based protocol continues to exhibit better performance despite the slight overall increase in its path acquisition time. These results demonstrate the ability of the designed simulator to implement different networking protocols as well as vary
IJCSNS International Journal of Computer Science and Network Security, VOL.10 No.12, December 2010
59
and measure different performance parameters in both the spatial and temporal domains.
Fig. 6. Average ratio of path acquisition time to session length. Varying mobility rate.
Fig. 3 Percentage of successfully received packets after path acquisition. Varying traffic rate.
Fig. 4 Average ratio of path acquisition time to session length. Varying traffic rate.
6. Conclusion This paper presented an object oriented framework to design an event-driven network simulator that can be used to evaluate different wireless networking architectures and protocols. The design of the simulator allows for considerable increase in flexibility for the researcher. Consequently, the research is able to include particular aspects and implementations of the simulated protocols. This can require a considerable amount of work for code modification or may not even be readily possible in many existing off-the-shelf network simulators. The different classes that constitute the simulator application along with their functions, and relationships were presented. The design methods for simulating node mobility using the popular Waypoint model were offered as well. Additionally, the proposed framework was verified and tested by using it to implemented and analyze the performance of two competitive DSR-based QoS routing protocols for MANETs. The design can be a good starting point for many researchers that have new networking protocols and architectures that need to be evaluated which may not be supported by existing network simulation packages.
References
Fig. 5 Percentage of successfully received packets after path acquisition. Varying mobility rate.
[1] The official OPNET company website. http://www.opnet.com. [2] The network simulator - ns-2. http://www.isi.edu/nsnam/ns/. [3] Woongsup Lee. Network simulators: Opnet, ns-2. http://cnr.kaist.ac.kr/lecture/te523 2008/download/ Lab08 TA 2008.ppt, Korea Advanced Institute of Science and Technology, 2008. [4] Network simulator (ns-2), internet technologies 60-375. http://web2.uwindsor.ca/courses/cs/aggarwal/cs60375/NS/NS 2.ppt. [5] M. Welzl. The ns-2 network simulator. http://www.welzl.at/research/tools/ns/welzl-ns-tutorial.ppt, 2008.
60
IJCSNS International Journal of Computer Science and Network Security, VOL.10 No.12, December 2010
[6] Yi Pan. Introduction to opnet simulator. http://netresearch.ics.uci.edu/ypan/, 2008. [7] X. Chang. Network simulations with OPNET. Proc. of the 1999 Winter Simulation Conference, P.A. Farrington, H.B. Nembhard, D.T. Sturrock, and G.W. Evans, eds., pages 307– 314, 1999. [8] J. Prokkola. OPNET - network simulator. http://www.telecomlab.oulu.fi/kurssit/521365Atietoliikennete kniikan_simuloinnit ja tyokalut/Opnet esittely 07.pdf. [9] S. Keshav. Real 5.0 overview. Cornell University, Available as: http://www.cs.cornell.edu/skeshav/real. [10] Yi Pan. INSANE, An Internet Simulated ATM Networking Environment. [11] R. L. Bagrodia. Designing efficient simulations using maisie. Proceedings of the 1991 Winter Simulation Conference, Phoenix, AZ, USA, pages 243–247, December 1991. [12] I. Jawhar and J. Wu. Race-free resource allocation for QoS support in wireless networks. Ad Hoc and Sensor Wireless Networks: An International Journal, 1(3):179–206, May 2005. [13] D. B. Johnson and D. A. Maltz. Dynamic source routing in ad-hoc wireless networks. Mobile Computing, pages 153–181, 1996. [14] C. E. Perkins. Ad Hoc Networking. Addison-Wesley, Upper Saddle River, NJ, USA, 2001. [15] I. Jawhar and J. Wu. Quality of service routing in mobile ad hoc networks. Resource Management in Wireless Networking, M. Cardei, I. Cardei, and D. -Z. Du (eds.), Springer, Network Theory and Applications, 16:365–400, 2005. [16] I. Jawhar and J. Wu. Qos support in tdma-based mobile ad hoc networks. The Journal of Computer Science and Technology (JCST), 20(6):797– 910, November 2005. [17] I. Jawhar and J. Wu. Resource allocation in wireless networks using directional antennas. The Fourth IEEE International Conference on Pervasive Computing and Communications (PerCom-06), Pisa, Italy. Publisher IEEE Computer Society, pages 318–327, March 2006. [18] I. Gerasimov and R. Simon. Performance analysis for ad hoc QoS routing protocols. Mobility and Wireless Access Workshop, MobiWac 2002. International, pages 87–94, 2002. [19] W.-H. Liao, Y.-C. Tseng, and K.-P. Shih. A TDMA-based bandwidth reservation protocol for QoS routing in a wireless mobile ad hoc network. Communications, ICC 2002. IEEE International Conference on, 5:3186–3190, 2002. [20] Ronald L. Rivest Thomas H. Cormen, Charles E. Leiserson and Clifford Stein. Introduction to Algorithms. McGraw-Hill, The MIT Press, Cambridge, Massachusetts, USA, 2001. [21] Frank M. Carrano. Data Abstraction and Problem Solving with C++: Walls and Mirrors. Addison Wesley, USA, 2004. [22] Larry Nyhoff. ADTs, Data Structure, and Problem Solving with C++. Prentice Hall, Upper Saddle River, NJ, USA, 2005. [23] Walter Savitch. Problem Solving with C++, the Object of Programming. Addison-Wesley, NY, USA, 2005. [24] A. Jardosh, E. M. Belding-Royer, K. C. Almeroth, and S. Suri. Towards realistic mobility models for mobile ad hoc networks. In proceedings of ACM MobiCom, pages 217–229, September 2003.
Imad Jawhar is an associate professor at the College of Information Technology at United Arab Emirates University. He has a BS and an MS in electrical engineering from the University of North Carolina at Charlotte, USA, an MS in computer science, and a Ph.D. in computer engineering from Florida Atlantic University, USA, where he also served as a faculty member for several years. He has published numerous papers in international journals, conference proceedings and book chapters. He worked at Motorola as engineering task leader involved in the design and development of IBM PC based software used to program the world's leading portable radios, and cutting-edge communication products and systems, providing maximum flexibility and customization. He was also the president and owner of Atlantic Computer Training and Consulting, which is a company based on South Florida (USA) that trained thousands of people, and conducted numerous classes in the latest computer system applications. Its customers included small and large corporations such as GE, Federal Express and International Paper. His current research focuses on the areas of wireless networks and mobile computing, sensor networks, routing protocols, distributed and multimedia systems. He served on numerous international conference committees and reviewed publications for many international journals, conferences, and other research organizations such as the American National Science Foundation (NSF). He is a member of IEEE, ACM, and ACS organizations.