Implementing a New International Paper Mill Efficiency Standard - Using Computational Correctness Criteria to Model and Verify Timed Events
Jari Veijalainen1, Eleni Berki2, Jari Lehmonen3, Pasi Moisanen4 Hasso-Plattner-Institut fuer Software Systemtechnik GmbH University of Potsdam, Prof.-Dr.-Helmert Str. 2-3, P.O. Box 900460, D-14482 Potsdam, Germany,
[email protected] 2 Information Technology Research Institute (ITRI) P.O. Box 35 (Agora) FIN-40014 University of Jyväskylä, Finland
[email protected] 3
Wisdomus, Keskustie 20, FIN-42600 Multia, Finland
[email protected]
4 Institute of Measurement and Information Technology P.O. Box 692, FIN-33101 Tampere University of Technology, Finland
[email protected]
Abstract. In the currently used information system architectures of paper mills there is a huge number of signals generated at the lowest automation level by thousands of hardware sensors and other embedded components. These are accumulated and refined into a manageable number of semantically meaningful events by software layers above the physical and automation layer, stored into a persistent storage, i.e. log. (database). Some events are shown to operators that can acknowledge them through the user interface of the monitoring interface and issue control events. In this paper we discuss what formal properties the events and the log should have in order to be compatible with the proposed new standard paper line efficiency calculation rules and how a standard event log can be generated using the existing software and hardware components in a paper mill. Our main contribution is the standard log structure and an accompanying standard algorithm yielding comparable efficiency calculations in various environments. The inevitable heterogeneity between different paper mills is proposed to be overcome by a separate algorithm that maps existing event types into the standard ones and forms a standard log consisting of the instances. We evaluate our suggestions in a case study at a Finnish paper mill, where we have gone through the existing system, concrete logs and event types, and evaluated them against the needs of the new efficiency calculation standard and the standard algorithm implementing it.
J. Veijalainen, E. Berki, J. Lehmonen, P. Moisanen, "Implementing a New International Paper Mill Efficiency Standard - Using Computational Correctness Criteria to Model and Verify Timed Events", Proceedings of the 2nd South-East European Workshop on Formal Methods (SEEFM05), Ohrid, 18-19 Nov 2005, pp. 27-43. 27
1. Introduction Paper mills are large industrial and business complexes [1, 2] where many information systems have been introduced for various purposes over time. Human operators use some of them for monitoring the paper production line and some other to control the line [3, 4]. There exist standard calculation rules for paper production line efficiency calculation that are currently widely used in Europe, the German Zell Cheming Merkblatt II/2, 1981. The efficiency is specified as a product of time efficiency and material efficiency over a certain specified time interval. The problem with these standard calculation rules is that they can be interpreted in different ways concerning how the time efficiency is measured, i.e. how maximum time available (MTA), i.e. production time, idle time, etc. and time not available (TNA) are determined. Another problem is that the material efficiency is based on the weight of the produced paper. Only the saleable production is weighted on the scales though, whereas the weight of the produced paper on the machine roll is only estimated. In addition, the weight varies with the humidity of the paper and the humidity can greatly vary in different environments [5]. On paper machine lines with an offline coating the weight of the paper increases significantly due to coating after the reeler. Background: The existence of several different, but at the same time similar, calculation rules of efficiency has led to confusion and a lack of comparability. The main targets of the new efficiency standard [6] are to clarify and harmonize the paper production calculation rules, to support the efficiency and capability development in paper companies and to improve the communication between the machine suppliers and paper industry. The new standard improves the accuracy in two respects: First, it specifies in a more accurate way which time intervals are considered as time not available, idle time, and production time. Secondly, it replaces the weight-based material efficiency with area efficiency. The area of the produced paper can be directly measured at the mill using various methods and it can also be measured while the paper is cut and wound into the customer rolls. Thus, one gets two independent directly measured values for the area. In addition, the area of the paper hardly changes due to humidity or other factors, in contrast to the weight. For these reasons, introducing area efficiency should increase the accuracy of efficiency calculations. Together, the changes in the standard calculation rules should shrink the error in efficiency assessment below one percent unit [5, 6]. Rationale: The weight-based efficiency figure, renamed production quantity utilization factor, will be used as secondary efficiency figure for finishing operations. This is vital, as paper is, in most cases, still sold in tons. The new efficiency standard determines what the calculation rules for efficiency are and how the baseline data for the calculation is obtained, but it does not determine in any way how the efficiency calculation should be organized within the information systems architectures of the mills. Our idea is that a viable approach to this problem is to define a data structure, standard event log, and a standard calculation algorithm based on its formal correctness properties. The algorithm and the data structure should, then, be correctly implemented in various mill information systems. As a result, the efficiency calculation results obtained applying the standard algorithm should always be
28
comparable for two different standard logs of the same or different production line. The standard event types in the log are, at the same time, the target structure for transformations that map the existing event types and instances in the real mill information system logs onto the standard ones. Thus, the standard log is the central means in creating interoperability between existing software components. After introducing the standard log and the standard calculation algorithm, the number of sources for inaccuracies in efficiency calculation results within a paper production line and between paper production lines should shrink. The differences that mainly remain are those that result due to different signal/event generation and handling rules at the lower mill information system layers and due to operator-controlled events, i.e. human decision making, in situations where no automated decision is possible. In addition, measurement errors at the lowest layer cause differences, but according to our studies, their impact is at most +/- 0.5 % in the final efficiency figure [7]. Thus, reaching 1 % error margin in efficiency calculation requires that the above-mentioned errors comprise at most +/-0.5 %. Formal Methods for Problem Solving: We concentrated in providing the design for an adequate efficiency calculation component within a paper mill information system for the new efficiency calculation algorithm. System's adequacy in our case is related to the correct specification of the events monitoring and controlling, and the formal language in which these specification requirements are expressed. Diagrammatic and other techniques employed by structured methodologies in earlier phases of our work, though widely used and well known in software development, were not rigorous enough, resulting in ambiguities [5]. The main problem was that a certain shut down interval relevant for time efficiency calculation can be categorized into Time Not Available (TNA) or Time Available (TA) after 24 or 48 hours have passed after its start. This requires that the formalism used should be able to capture the length of time intervals and their allocation into different categories. Consequently, it was difficult to use non-mathematical methods to precisely capture the paper mill dynamic requirements for the new efficiency standard and to reason about them, particularly with automated proof systems. Therefore, a more formal specification of the systems models in general, and for the events' capture in particular, was needed. From structured methods we used techniques such as Data Flow Diagrams (DFDs) and Entity Life Histories (ELHs), which suffer from ambiguities, which, in turn, may cause inconsistencies [8, 9, 10]. In some cases these techniques needed to be modified and extended in order to facilitate future implementations [8, 9, 10, 11, 12]. In contrast, computational methods placed emphasis on the development of an unambiguous, correct, complete and consistent, implementable design, through the use of rigorous mathematical notation and techniques. Validation and verification techniques are constantly required to ensure that the requirements specification is a correct representation of the system needs, and that both design artefacts and their correspondent implementation should be proved so, as to satisfy these needs at modeling and implementation level [13]. The modeling area that considers time and change is otherwise known as ‘dynamic systems behavioral modeling’. This is notably an area, where dynamic properties and
29
temporal aspects of systems are studied. There exist comparisons of a plethora of modeling diagrammatic notations of different expressability and rigor, which manage to capture time and change with various degrees of success [14, 15, 16]. A recent characterization of this type of conceptual modeling, which also includes metamodeling aspects, has been carried out by [15], who mentions other reviews with similar and different findings, and comments on their effectiveness, contributions and limitations in specific application domains. Formal Computational Methods for Dynamic Systems: With the exception of the dynamic theoretical models of computation such as Finite State Machines (FSMs), Backus-Naur Form (BNF), etc. and their generalizations,X-Machines and Extended Backus-Naur Form (EBNF) respectively, all ‘formal’ approaches to dynamic systems development [16, 17, 18, 19, 20] concentrate on the coverage of the modeling needs of particular application domains. The limited availability of automated tools makes their use even more difficult, especially when it comes to issues of test cases generation from specifications, computability, reverse engineering and reengineering. Certain forms of deductive reasoning are often used for quality assurance, validation and verification, although a formal testing procedure is utilized in a limited fashion. Some formal methods such as process algebras for Communicating and Sequential Processes (CSP) and Calculus of Communicating Systems (CCS), which are also used to model time change and concurrency, and some of their extensions such as Timed CCS (TCCS) involve automated tools more than others such as Z and Vienna Development Method (VDM), which are used to model sequential systems [21, 22]. The extensions of the latter though, such as Z++ and Object Z seem to have wider applicability for domain specifics. Notations that describe a system’s dynamic behaviour well are Petri-Nets (used in many cases to also model concurrent processes), Statecharts and Finite State Machines; these are model-based diagrammatic formalisms with adequate textual visualisations of abstraction, too [16, 17, 18, 19, 20, 21, 22]. Moreover, Regular Expressions, Context Free Grammars and Backus Naur Form offer rich text descriptions and algorithmic steps to express events occurrence with more clarification details. Most of these formalisms, though, and other real time structured and semi-formal methods [23, 24, 25] do not address the real time needs of the efficiency calculations in paper mills. There, we need not only to model the order of events, but also duration between events, and in such a case none of the above formalisms alone would be strong enough to express the complete requirements unambiguously, correctly and consistently among different levels of abstraction. As can be seen in the next sections, the paper mill environment is highly dynamic in events occurrences, and with the new standard efficiency calculations, we needed to intuitively use a variety of the above formal computational techniques and sometimes a combination of them. The paper is organized as follows: We first discuss the overall paper making process and show the places in the process where the baseline data is gathered for the efficiency calculations. We subsequently refer to the collection and identification of event data found in the real paper mill environment and modeled as Finite State Machine and State Transition Matrix (Appendix A) in previous stages of the research work [5, 7]. We then define the event log as a finite sequence of event instances based
30
on BNF abstract typology; we also define its correctness criteria, and show that the efficiency calculation can be performed based on the assumed criteria in a single pass for any query. We finally discuss the implementability of the standard event log based on existing real events and problems in real systems, such as local clock drifts at different components, missing events and so on. We close the paper with conclusive remarks and future development issues on the results of our work and on the use of the particular computational methods as thinking and modeling tools for capturing the event data in other paper mill environments for the realization of the new international efficiency standard. We briefly provide a critical appraisal on the opportunities and difficulties encountered by the application of formal computational methods in the real environment of the Finnish local paper industry.
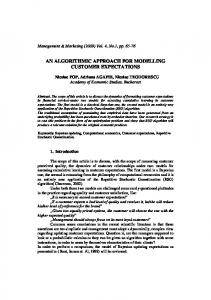
2. Paper Production Process and Calculation Rules Paper machines residing in paper mills produce paper. The material input to the paper making process is a water suspension containing one percent of wood fibers, fine materials of wood, chemicals, and most often also mineral fillers. Within the paper machine, the solid contents of the suspension are elevated to that of the paper that is typically 90-96 %. Dewatering takes place by free dewatering, suction and pulsing of the wet web on forming section, pressing of the web on press section, and by heating the paper web by steam on drying section. The speed of the paper line is typically 1000-2000 m/min (60-120 km/h). The speed is dependent on many factors, such as the machine and paper grade produced. The width of the wire is typically 5-8 meters. The ready paper is wound on a machine reel. At our case line a full reel it was ca. 6 m wide and contained typically ca. 50 km paper, i.e. it was produced in less than an hour. Its area was, thus, roughly 300000 m2, i.e. 0.3 km2.
Area efficiency
Time efficiency paper machine producing paper web
paper wound on machine reel (jumbo/parent (jumbo/parent roll)
multiple sets of shipping/ shipping/customer rolls from one machine reel
customer orders wrapped customer rolls or sheets
shipped
time loss
lenght and width loss
lenght loss
quality/ quality/area loss during handling and warehouse
Fig. 1. A schematic view on a paper production line
31
The ready machine roll is subsequently cut into smaller rolls, called customer rolls. Customers have ordered the latter and each of the rolls must have exactly the width specified by the customer. The customer rolls are finally wrapped and weighted on a scale. After that they are moved to storage where they will wait for the transport to the customers (see figure 1). According to the new standard proposal, efficiency calculation for a paper production line is as follows: Overall efficiency = Time efficiency*Area efficiency Time efficiency = Production time / Maximum time available Time efficiency is defined as a ratio of the length of the production time to maximum time available, during a certain calendar time interval (typically a mill day, a month, a year). Production time is determined using the combination of the states of the machine chest pump (on/off), vacuum in the wire suction (on/off), and the paper machine reeler (paper wound/paper not wound on the reel). Production time = maximum time available - shut downs - idle time The maximum time available = calendar time – time not available, is, in practice, a fraction of calendar time. During idle time, stock is on wire, but no paper is wound on the reeler because of tail threading, break, or maintenance work. Area efficiency = Area of saleable production / Calculated average maximum produced area Area efficiency is calculated from paper machine reel onwards. The data for calculating area efficiency is available when the customer rolls are ready at winder. The area of returned production from outside the mill gate is reduced from saleable area. Rewinder salvage is added into the saleable area. Calculated average maximum produced area = Paper length at paper machine reel *Average maximum trim width at winder This represents the area of the potentially saleable paper that the machine has produced during a certain time interval (mill day, month, year). The length above should be accurately measured. Using the average maximum trim width above might also cause a slight error, because it might deviate from the actual trim width used Notice that the time efficiency, as defined above, does not tell what fraction of the calendar time the machine is running, nor the speed with which the machine is run during production, nor how much paper was produced by the machine during a certain period of time. The same holds for the area efficiency. The overall efficiency is a ratio between zero and one (hundred percent) and it tells primarily how many per cent of the potential maximum output the paper production line was able to produce during a given time interval.
32
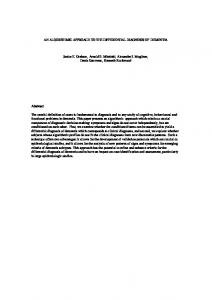
3. Event Log as a Finite Sequence of Event Instances When calculating the overall efficiency, i.e. the product of the time efficiency and area efficiency, one has to collect the baseline data from the same query time interval [t1, t2] (the same mill day, month, year). This is an important requirement when organizing the data for efficiency calculations. The overall schematic architecture for the efficiency calculation is depicted in Fig. 2. The idea is that base line data is gathered into the standard event log. An event log L is a finite sequence of event instances ei, i=1, 2, n and nN, where L = e1e2, …, en. A new event instance is always added at the end of the log. The insertion order is denoted by information) information)
Mill systems interface module
Log (data)
Data gathering (interfaces/ interfaces/adjustments) adjustments) data (events (events)) Control systems
Paper machine interface module
signals Sensors and machinery
Fig. 2. Proposed overall architecture for paper machine efficiency calculation
There are many event types that are needed in monitoring and controlling a paper machine. In our real case environment of the Finnish paper mill, over 100 different event types were encountered and categorized as internally-triggered, externallytriggered and time-triggered [5]. Only a small portion of these is needed for efficiency calculations. Event sequences consisting of events of these types, modeled with finite state machines notation as deterministic and non-deterministic automata, are formally documented in the time state event transition matrix of Appendix A,
33
where a '?' indicates a missing requirement/event transition. We assume that only those absolutely necessary for this purpose are gathered into the standard event log in Fig. 2. Based on these, the efficiency figures defined above will be calculated upon request from applications or human users mentioned at the top of Fig. 2, namely mill and corporate managers, paper machine operators and production managers. According to Turski in [26], formalizing the properties of an application domain is a challenge, because there are "two fundamental difficulties involved in dealing with non-formal domains (also known as 'the real world'). 1. Properties they enjoy are not necessarily expressible in any single linguistic system. 2. The notion of mathematical (logical) proof does not apply to them". In general, the use of computational methods for designing a system offers quality assurance regarding the development of unambiguous, consistent, correct and verified mathematically-proven specifications. That being the reality, a rigorous and integrated method based on formal specification rules must provide an appropriate syntactic and semantic structure to model the dynamic requirements of events occurrence and capture some or all of the features of specification and further computation. This can be achieved in terms of a specialized mathematical (therefore sufficiently generic) structure that can computationally express the richness of events specifications, considering implementation needs of further computer-based and hardware-based activity. The following section demonstrates the application of that structure. 3.1
The Event Structure in BNF Form
We define that an event in the event log has the following Backus-Naur Form (BNF) structure: ::= %et = ev type, ec =event ::= [“beg”|(”end”)] % category ::= integer; %time stamp in seconds from 1.1.1970 ::= %event source identifier ::= % time-related (“shutdown”(“ personnel_na”)| “personnel_av” )) | %no stock on wire, or no vacuum in the %wire suction “idle,” | “production” %paper wound on reeler ::= “planned”| ”unplanned” ::= “holidays”|”work_agreements”|”strike” ::= .. %ca.10 codes, ::=% stock on wire, no paper wound on reeler “start_up”|”Technical/paper technical work”|“break” |”grade-change” ::= “Technical/paper technical work”|”Material shortage”| ”Lack of tambours”| “Repair” %area related (“mr_ready”)| (”cr_saleable”)| (“cr_rejected” ”)
34
:: :: If the event category of e is time-related, the event type contains beg or end. In the latter case the first field pair [ts, sid] contains e’[ts, sid] that is of the same category as e and e’ . Every event e has a time stamp e[ts], whose denotation is explained later. We assume for the moment that the timestamp an event carries refers to the global system time (or wall clock time) when the original event (such as stock on wire signal, break, shut-down start event) was detected/generated by a sensor, human being, or some information system component. We assume for simplicity, and without loss of generality, that a timestamp is a number that tells how many seconds had passed from 1.1.1970 00:00:00 GMT to the occurrence of the original event. This is transformable to year:month:day:hour:minute:second in an unambiguous way when the time zone GMT+/- X hours is given, and vice verso. The timestamp order is denoted by 48h Lack of Orders, Mat. Shortage, Unexp. events >24h
Production Time
holidays. work agreements, strikes holidays. work agreements, strikes
Manager Decision
Unplanned Shutdown
STOCK WIRE
Manager Decision
Planned Shutdown
holidays. work agreements, strikes
holidays. work agreements, strikes
TNA Personnel Available
Start-Up Time
Productio n Time
Time Not Available (TNA) no Personnel Available TNA Personnel Available Planned Shutdown Unplanne d Shutdown
Time Not Available (TNA) no personnel available
APPENDIX A: Real Time States and Event transition matrix in Paper Mill (Start state on 1st column) Techni Break cal /PT Work
Paper not PNWO PNWOR wound on R+? +? reeler (PNWOR) + ?
Grade Change