Dhaka Univ. J. Sci. 61(1): 81-85, 2013 (January)
An Alternative Algorithm for Classification Based on Robust Mahalanobis Distance A. H. Sajib, A. Z. M. Shafiullah1 and A. H. Sumon Department of Statistics, Biostatistics & Informatics University of Dhaka, Dhaka 1000, Bangladesh Received on 07.03.2012. Accepted for Published on 14. 05. 2012
Abstract This study considers the classification problem for binary output attribute when input attributes are drawn from multivariate normal distribution, in both clean and contaminated case. Classical metrics are affected by the outliers, while robust metrics are computationally inefficient. In order to achieve robustness and computational efficiency at the same time, we propose a new robust distance metric for K-Nearest Neighbor (KNN) method. We call our proposed metric Alternative Robust Mahalanobis Distance (ARMD) metric. Thus KNN using ARMD is alternative KNN method. The classical metrics use non robust estimate (mean) as the building block. To construct the proposed ARMD metric, we replace non robust estimate (mean) by its robust counterpart median. Thus, we developed ARMD metric for alternative KNN classification technique. Our simulation studies show that the proposed alternative KNN method gives better results in case of contaminated data compared to the classical KNN. The performance of our method is similar to classical KNN using the existing robust metric. The major advantage of proposed method is that it requires less computing time compared to classical KNN that using existing robust metric.
Keywords: Classification, KNN, Robustness, ARMD. I. Introduction We consider the classification problem with binary output variable. Fix and Hodges (1951) proposed K-Nearest Neighbor (KNN). When input variables are continuous and correlated The commonly used Euclidean Distance metric (ED) in KNN deals with uncorrelated data. This assumption may not be always satisfied in real applications. The Mahalanobis distance (MD) accounts for correlations among the variables. Therefore, KNN based on MD can adequately solve the problem of using ED when the input variables are correlated. Despite the advantage of MD over ED, it is not robust against outliers. In presence of outliers, classical distance metrics provide poor results while Robust Mahalanobis distance i.e., RMD (with MVE) metric gives reasonable results (Table 1). Table.1. Performance of KNN with different robust and non robust metrics Y Data type
Clean Contaminated
ED
MD
RMD (MVE)
0
1
1
0
0
1
(The true value of output attribute (Y) of the test case is 1) But existing robust metrics are based on iterative algorithm and so computationally inefficient. In this study, we attempt to develop a new distance metric for KNN that is resistant to outliers, does not require iterative algorithm and is computationally efficient. We call the new metric Alternative Robust Mahalanobis Distance (ARMD). The KNN using ARMD is a new classification technique which we call “An Alternative Algorithm for Classification based on Robust Mahalanobis Distance”. This *A.Z.M. Shafiullah, E-mail:
[email protected]
algorithm is designed to reduce the misclassification rate and improve the efficiency of KNN with less computing time. The rest of the paper is organized as follows. In section II, we present our alternative algorithm for classification based on robust Mahalanobis Distance (ARMD). In section III, we illustrate our proposed algorithm with example. In chapter IV, we show the results of simulation study to compare the performance of our proposed algorithm. Section V is the conclusion. II. Alternative Algorithm for Classification The proposed alternative KNN algorithm uses a new robust MD (ARMD) that is based on a new robust covariance matrix ( ) which is an estimator of variance covariance matrix ( ) of a multivariate normal population. Proposed and ARMD are given below. New robust covariance matrix ( ) Let be the explanatory variables in the design matrix x is given as
The covariance matrix (dispersion matrix) S of x is a matrix whose element in the position is the covariance between and vector of observations in design matrix. diagonal element of S is the variance of The given by
Where
. Thus S is
82
A. H. Sajib, A. Z. M. Shafiullah and A. H. Sumon Alternative KNN Algorithm
Since and use non robust estimate mean of location parameter, they are affected by outliers. According to robustifying the solution (Khan, 2007) we replace the non robust building block (mean) of and by their robust counterpart (median). Thus, the new covariance matrix ( ) is
Let our training dataset is drawn from multivariate normal distribution where output attributes are binary. To classify a test instance by alternative KNN we propose the following algorithm: The alternative KNN algorithm as follows: i. Determine the value of k the number of nearest neighbors by using cross-validation. ii. Calculate the distances of each training instance from the test instance using ARMD metric. iii. Sort the distances to select K nearest neighbors. iv.Determine the category (0 or 1) of output variable based on majority voting. v.Classify the test case accordingly.
Where
III.Example To illustrate the alternative KNN by using proposed ARMD metric, we generate a data set of size n=41 using R program for the explanatory variables .These input attributes comes from multivariate normal distribution where the variables are correlated (pair wise correlation between 0.5 to 0.7). As we consider binary output attribute, we use logistic model. We calculate the probability or . Then using R, we generate a random sample from uniform distribution. If then set y=1, otherwise 0. First 40 observations will be used for training purpose and last observation will be used for classification purpose (Table 2). In this case, we consider that the class of last observation (test instance) is hidden and our task is to predict the class of this observation. For including 5% outliers in data set, we generate a data set of size n=5 from multivariate normal distribution with parameters which are far apart from the existing data. Then, substitute randomly 5 value of first data set by these outliers.
Alternative Robust Mahalanobis distance (ARMD) Let MV
normal
and variables. Then
MD
is
;
be two given by Where,
S is a variance-covariance matrix of x. In order to make MD robust against outliers the choice of S is crucial. For example, existing robust MD with MVE estimate of performs better than classical MD with S. Thus Alternative Robust Mahalanobis distance (ARMD) is obtained by simply replacing by .Thus
Table. 2. Generated data from multivariate normal and logistic distributions. Serial no. 1
-0.279078
-0.831844
1.046478
-1.045900
1.132575
1
2
-0.517143
0.737991
0.442278
0.673105
-1.206625
0
3
2.089992
1.107868
0.922225
1.834622
0.063152
1
4
-0.539974
-0.742748
-0.021114
-0.519428
-0.884770
0
5
0.857197
0.182683
0.738741
-0.343491
-0.110309
0
…
…
…
…
…
…
…
…
…
…
…
…
…
…
40
1.006717
1.452302
2.225043
1.292893
0.926470
1
41
0.490334
0.536876
-0.285910
-0.0076728
0.313805
?
An Alternative Algorithm for Classification based on Robust Mahalanobis Distance Now, we calculate distance for each of training instances from the test instance by using ARMD metric. Then we select K=11 (using cross validation) training cases that are closest to the test case (Table 3). A decision list is a set of statements (Table 4). If sum of y is greater than 50% of k, then we classify our new instance class 1, otherwise 0. Since sum of y (= 7) is greater than 5.50
83
(50% of k = 11), according to the above decision rule alternative KNN algorithm based on ARMD classifies the new instance into class 1 which is the actual class of the test (41st) case (Table. 5). The classification results of the new instance by alternative KNN algorithm based on ED, MD, RMD (MVE) and ARMD are shown in Table 5.
Table. 3. K nearest neighbor based on distances with k=11. Serial no. 34
0.575533
0.748980
-0.011612
0.12740
0.700779
1
21
0.258814
0.664815
0.092676
0.623640
-0.272450
1
9
0.068041
-0.053654
0.348468
0.209054
-0.378606
1
16
-0.056768
0.108436
0.411065
0.51623
0.521828
1
5
0.857197
0.182683
0.738741
-0.343491
-0.110309
0
25
0.179896
-0.050324
-0.876126
0.316605
-0.149603
0
27
0.328022
0.600272
0.474078
0.143447
1.471035
1
28
-0.235329
0.074911
-0.461405
0.775869
-0.501880
0
6
-0.181108
0.011308
0.092142
-0.488100
0.320586
1
23
-0.066643
0.041887
0.695631
1.107563
0.082300
1
12
1.466001
-0.507377
-0.224082
0.98526
0.348671
1
Table. 4. Decision rule for alternative KNN
Instance gets class 1. Instance gets class 0.
Serial 41
…… 0.490334
0.536876
……
0.313805
1
Table. 5. Classification results of new instance for KNN based on ED, MD, RMD and ARMD metric. (actual value is 1) Serial
41
Outliers ED
MD
RMD
ARMD
Absent
0
1
(MVE) 1
1
Present
0
0
1
1
In the next section, we conduct a simulation study for several test instances. Datasets of different sizes are simulated for 1000 trials.
IV. Simulation We conduct simulation studies to compare the performance of KNN based on existing robust and classical distance metrics with the performance of alternative KNN based on ARMD metric. We conduct studies for small and large samples before and after incorporating outliers. The performances are determined by misclassification rate, graphical presentation of frequency of misclassification, computing CPU elapse time and standard error (S.E.) of misclassification rate. We consider multivariate normal distribution to generate the input attributes, while logistic model is used to generate the output attribute. We use the following form of logistic model.
To create the binary outcomes attributes Y, a uniform (0, 1) attribute U was simulated and compared with P. We set y=1,
84
A. H. Sajib, A. Z. M. Shafiullah and A. H. Sumon
if P>U otherwise we set y=0. Pongsapukdee, V. and Sujin, S. (2007) discussed how to generate data in the analysis of category of binary response data with the combination of continuous and categorical explanatory attributes models. Now to choose the coefficients of logistic model we have to consider the value of P. If the value of P is large enough then almost all the values of Y will be “1”. On the other hand, if the value of P is too small then almost all the values of Y will be “0”. Considering this issue, we choose in such way that the value of P is moderate size. Table 6 shows the parameter values for which P becomes approximately 0.50 the dataset contains approximately 50% of Y equals “1” and 50% of Y equals “0”.
n=40 and size of test data is n=10, we first generate 50 observations for each of the attributes and make a data set of size n=50. Then randomly divide this data set into 5 folds such that each fold contains 10 observations and consider that first 4 folds make training data and last fold make test data set. To create a training data size n=90 and n=190 first we generate 100 and 200 observations and then divided 10 and 20 folds respectively. For each clean and contaminated datasets, we consider the number of misclassifications for KNN with ED, MD, RMD (MVE) and ARMD metric. We count for each of metrics the number of times (out of one thousand dataset) misclassification occur at numbers T=0, 1, 2, 3, 4, 5, 6, 7, 8, 9, 10 where T stands for number of misclassified test cases out of 10. We also compute the average misclassification rate for each metrics from these misclassifications.
Table. 6. Parameters used in logistic model.
V. Results and Discussion
We consider 3 different sample sizes: n=50, n=100 and n=200. For each of the cases we have 2 different situations, i.e., clean data (no outliers) and contaminated data (5% outliers). For each situation, we generate 1000 datasets. In our study, we use separate training data to build a model and test data to measure the performance of KNN with different metrics. For each sample size we used separate test data of size n=10. For example, suppose our training data size is
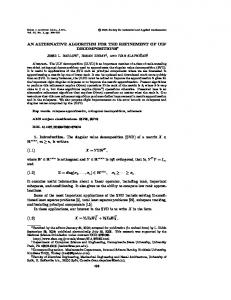
Table 7 shows the average misclassification rate over 1000 simulated data. The distribution misclassifications are graphically represented in Figure 1. We observe that KNN with proposed ARMD gives similar results in presence and absence of outliers. These results are comparable with KNN with existing robust RMD (MVE). On the other hand KNN with existing non robust metrics (ED & MD) give different results in presence and absence of outliers. Moreover, KNN with non robust ED metric has higher average misclassification rate than that with ARMD for both clean and contaminated data. The table also shows that KNN with ARMD and MD gives similar results for clean data but KNN with ARMD has less average misclassification rate than that with MD for contaminated data. Such comparison is similar for every sample size.
Table. 7. Average Misclassification rate (%) of KNN using proposed ARMD and other metric. Metric used in KNN
n=50
n=100
n=200
Clean data
5% outliers
Clean data
5% outliers
Clean data
5% outliers
ED
24.77
26.13
23.85
23.81
22.72
23.28
MD
17.79
22.13
16.43
17.47
15.48
16.94
RMD (MVE)
18.10
18.14
16.49
16.40
15.38
15.97
ARMD
18.22
18.22
16.67
16.55
15.75
16.04
An Alternative Algorithm for Classification based on Robust Mahalanobis Distance
100
150
200
250
ED MD RMD(MVE) ARMD
0
50
Number of occurrences
300
350
clean (n=200) data
0
1
2
3
4
5
6
7
8
9
10
Numbers
100
150
200
250
ED MD RMD(MVE) ARMD
0
50
Number of occurrences
300
350
contaminated (n=200) data
0
1
2
3
4
5
6
7
8
9
10
Numbers
Fig. 1. Frequency of misclassification for clean and contaminated data.
85
Table 8 shows that for , the standard error of misclassification rate of KNN with ARMD is less than KNN with MD and almost equal compared to RMD (MVE). For the standard errors are almost similar of KNN for three metrics. For the value of KNN with ARMD is almost similar to KNN with RMD (MVE) and less than the errors are almost similar for three MD. For metrics. This result indicates that alternative KNN based on ARMD metric is comparable to the KNN based on RMD (MVE) metric and better than MD, sample size even large or small in the contaminated datasets. The last column of Table 8 gives stronger justification in attainment of the objective of the present study. Alternative KNN with ARMD metric takes much less computing time than the KNN with RMD (MVE) and MD metric. For KNN using RMD (MVE) metric required a total of 71.41 and MD required a total of 0.79 seconds of CPU time while KNN with ARMD metric required only 0.58 seconds over 1000 trials. For and KNN by RMD (MVE) required 102.02 and 169.14 seconds and MD required 1.24 and 0.95 seconds while alternative KNN required only 0.49 and 0.69 seconds of CPU time respectively over 1000 trials. For KNN using RMD (MVE) and MD required 372.01 and 1.52 seconds while alternative KNN required 1.23 seconds of CPU time over 1000 trials.
Table. 8. S.E. and total elapse (CPU) time of KNN with MD, RMD and ARMD in contaminated data. Criteria
Metric
Standard error of misclassification rate
Elapse computing (CPU) time in sec
MD
0.143
0.79
RMD(MVE)
0.128
71.41
ARMD
0.128
0.58
MD
0.122
1.24
RMD(MVE)
0.123
102.02
ARMD
0.124
0.49
MD
0.119
0.95
RMD(MVE)
0.116
169.14
ARMD
0.117
0.69
MD
0.111
1.52
RMD(MVE)
0.112
372.01
ARMD
0.113
1.23
VI. Conclusion The main contribution of this study is that we propose a new robust study of Mahalanobis distance (ARMD) metric for alternative KNN classification technique. We replaced the classical covariance matrix (S) by covariance matrix based on median ( ) in the Mahalanobis distance metric. Our new method with ARMD performs much better for the contaminated data compared to KNN with ED, MD and almost similar compared to that using RMD (MVE).The efficiency of proposed method is comparable to the KNN with RMD (MVE) metric. The major advantage of our method is that it is computationally more efficient (takes less CPU time) compared to KNN with RMD (MVE) metric.
Thus the alternative KNN based on ARMD metric is a reasonable choice for real datasets that may contain a fraction of outliers. ------------------1.
Fix, E. and Hodges, J. L. (1951). Discriminatory Analysis, Nonparametric Discrimination Consistency properties. Technical Report 4, USAF School of Aviation Medicine, Randolph Field, Texas. 2. Khan, J. A. (2007). Robust Linear Model Selection for High Dimensional Data. Statistical Workshop, Department of Statistics, University of Dhaka, June 27. 3. Pongsapukdee, V. and Sujin, S. (2007). Goodness of fit of Cumulative Logit models for Ordinal Response Categories and Nominal Explanatory variables with two factor interaction, November 27.
86
A. H. Sajib, A. Z. M. Shafiullah and A. H. Sumon