60
Pol. J. Chem. Tech., Vol. 20, No. 4, Polish 2018 Journal of Chemical Technology, 20, 4, 60—65, 10.2478/pjct-2018-0055
An alternative and indirect statistical modeling method for viscosity estimation and its experimental validation for low styrene content polyester resin Ahmad Nawaz1, Bilal Islam2, 3*, M. Zafar Ijaz4, Umar Saleem5, M. Sadiq Khattak6, Shahid Nisar Ahmad2, Nabeel Maqsood2, Liaquat Ali1 1
Department of Mechanical Technology, University of Technology, Nowshera, Postcode 24100, Amangarh, KPK, Pakistan National Institute of Vacuum Science & Technology, Shahdara valley, NCP Complex, Quaid.e.Azam University, Postcode 45320, Islamabad, Pakistan 3 Department of Industrial Engineering, University of Engineering & Technology Peshawar, Postcode 25120, KPK (Peshawar), Pakistan 4 Department of Mechanical Engineering, Cecos University of IT & Emerging Sciences, F-5, Phase-6, Hayatabad, Peshawar, Pakistan 5 Department of Mechanical Engineering, College of Electrical and Mechanical Engineering (EME), National University of Science & Technology (NUST) Rawalpindi, Pakistan 6 Department of Mechanical Engineering, University of Engineering & Technology Peshawar, Postcode 25120, KPK (Peshawar), Pakistan *Corresponding authors: e-mail:
[email protected] 2
We propose an indirect method of ASTM D-1200 for measurement of viscosity from 0.1 to 30 stokes (St) using Ford cup 5 (range 2~ 12 St) by developing a statistical relation. General purpose low styrene content polyester resin (without adding initiator, hardener and accelerator) was used for viscosity measurement. In existing ASTM D 1200 standard, ford cups (1-4) are used to measure the viscosity up to 2 St, while fifth cup is used for measurement from 2 to 12 St. Viscosity above 12 St is not estimated using existing ASTM D- 1200 method. In contrast, our method and statistical relation proposed in this paper estimates viscosity in the flexible range of 0.1 to 30 St by using Ford cup 5 only. The estimated values were confirmed by existing ASTM D-1200 (0.1 to 12 St) and by using Ubbelohde viscometer (12 to 30 St). Values estimated above 12 St are from the proposed model are also in good conformance (percentage error ~ 5% or less) with experimental results. The satisfaction level of the estimated values with the experiments suggests that the model has also the potential for application to paints, polymer and oil industry. Keywords: indirect method, polyester resin, statistical relation, Ford viscosity cup. INTRODUCTION Viscosity is a measure of internal resistance of fluid against flow1. Viscosity is an important material property which characterizes flow behavior. In most of industrial processes in which medicines, polymers, paints, oils are produced on mass level, optimization of viscosity is a crucial and important aspect. Quality problems may arise due to variation in viscosities in production of aforesaid products i.e. paints, polymers, oils etc. Polyesters and epoxies are used in various manufacturing processes which include layup2, resin transfer molding (RTM)3, vacuum assisted resin transfer molding (VARTM)4–5 and high voltage insulation6. Optimization of viscosity is an important aspect in these processes. Therefore, accurate viscosity determination at industrial scale is required in these processes. There are a whole host of methods and viscometers for measurement of viscosity, such as capillary viscometers, vibrational viscometer, ultrasonic viscometer, falling ball viscometers, rotary viscometers and orifice viscometer. Capillary viscometers are widely being used for viscosity measurement at laboratory scale, but due to slow and tedious measurement procedure it is not feasible at industrial scale. Similarly, vibrational and rotary viscometers are very expensive and therefore, not practicable for large scale production setup. Orifice viscometer method is suitable method for measuring viscosity at industrial scale and is widely being used by
industry7–9. Paint, polymer, oil and other related industries, control and ensure the product viscosity by the use of orifice viscometer method. Orifice viscometer method can further be subdivided into six classes of viscometers: Saybolt viscometer, Shell viscosity cup, Zahn cup viscometer, Engler viscometer, Redwood viscometer and Ford viscosity cup. Generally ASTM standard is preferred over others therefore; Ford viscosity cup is used in industries. The problem with existing viscosity cup method is limited viscosity measurement Rheological characterization plays vital role in dispersion studies and can be used as an important tool to monitor and control the degree of dispersion of nanofillers in epoxy resins. Addition of different micro or nanofillers to epoxy increase its viscosity which can be attributed to higher level of interaction between the epoxy and fillers and as a result enhances frictional forces10–12. Significant literature is available about various significant parameters which affects the viscosity of the epoxy resin. For example, iron particles increase viscosity of the fluid at higher temperatures, and increasing particle size of filler material which ultimately increases viscosity13. In addition, during curing initially, viscosity of resin decreases and afterwards increases with increase in degree of cure14–17. Furthermore, with the increase in shear rate viscosity of most of the polymeric materials experiences shear thinning phenomenon which pronouncedly decrease viscosity18. Addition of low viscosity fluid in another
Pol. J. Chem. Tech., Vol. 20, No. 4, 2018 matrix material was also part of previous studies. It has been reported that viscosity can be lowered by making emulsion with low viscosity fluid19. In the present work an effort has been made to indirectly estimate viscosity of polyester resin without adding initiator/hardener and accelerator. The Ford viscosity cup method has a shortcoming in viscosity measurement, due to its limitation of maximum capability limited only to 12 St. Instead of measuring viscosity, flow rate was measured by recording the efflux time of a known volume to completely expel out of the Ford viscosity cup at atmospheric pressure. Therefore, in the present work, an estimation model was developed which is based on the significant parameters i.e. flow rate, density and input temperature. To the best of our knowledge, a study in which viscosity was estimated indirectly by utilizing flow rate, density and temperature has not been previously conducted. Furthermore, with the use of this method, viscosity can be estimated for any known flow rate.
61
in Appendix). Cup no. 5 is used to measure the viscosity at ambient conditions between 2 to 12 St. However, in the present work, measurement of viscosity has been performed using conventional ASTM D-1200 and our proposed procedure for more and less than 12 St using corresponding density and flow-rate values at various elevated temperatures (see Figure 1 in Appendix). Additionally, to find viscosity at higher temperatures the inner surface of cup is coated with Teflon.
EXPERIMENTAL SECTION Materials Polyester resin (Descon Chemicals) having low styrene content i.e. less than 31% has been selected. Hardener and accelerator are not mixed with polyester resin (polyester is not cured without adding hardener and accelerator). All the experiments are conducted at room temperature 25oC ±2 with relative humidity in the range of 40%~60% (as per ASHRAE specifications). Calculation of viscosity conventionally Viscosity of general polyester resin (Descon Chemicals) having low styrene content i.e. less than 31%, was calculated using five viscosity cups and each cup has its respective formula according to ASTM standards. Usually polymers are highly viscous fluids therefore cup no. 5 was used for measuring viscosity in the present work. For cup no. 5 the range of efflux time was between 20 to 100 seconds. If efflux time was less than 20 seconds than cup no. 4, 3, 2 or 1 should be used. For measurement of viscosities following formulas were used respectively as per ASTM standard D-1200. (1) v1 = 0.49 (t – 35) v2 = 1.44 (t – 18) (2) v3 = 2.31 (t – 6.58) (3) v4 = 3.85 (t – 4.49) (4) v5 = 12.1 (t – 2) (5) In these relations v1, v2, v3, v4 and v5 are kinematic viscosities in St of five cups respectively. Each cup has a specified range for measuring viscosities (see Table 1 Table 1. Viscosity, efflux time and flow-rate readings except viscosity greater than 12 stokes
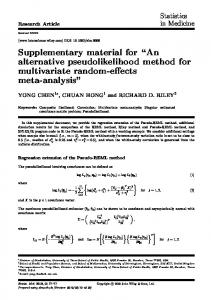
Figure 1. (a) Efflux time plotted against temperature (b) Flow-rate plotted against temperature
Calculating flow rate For all the values even if it is more than 1200 cSt flow rate is calculated using a known relation. ASTM Cup number 5 is selected for measuring flow rate of polyester resin. In this case fluid (Polyester) flows downwards due to gravity. Fixed quantity of resin (as per volume of Ford cup 100 ±2 ml) in milliliters was poured and dropped from viscosity cup at various temperatures. Afterwards, efflux time was recorded with assistance of stop watch. Formula for calculating flow rate can be written as: (6)
62
Pol. J. Chem. Tech., Vol. 20, No. 4, 2018
In this relation ‘V’ represents volume emptied from viscosity cup, time of efflux is represented by ‘t’ and ‘a’ is area of orifice and ‘’ represents velocity of flowing fluid. Significance of parameters In order to find significant parameters interdependence between different input parameters has been found by conducting experiments. Effect of temperature is studied on efflux time and flow rate. In addition, effect of temperature is also studied on velocity. Furthermore, effect of velocity on flow rate is also studied. This analysis will help in identifying the significant parameters which contribute in making statistical model for viscosity estimation. Multiple regression analysis has been used to further validate those input parameters which play significant role in affecting the viscosity of the sample. Afterwards, significant and non- significant parameters can be separated on the basis of t and p-statistics [20]. t statistics is initially performed based on experimental data using the under-mentioned formula: (7) In the abovementioned Eq. (6) is the predictor or coefficient of respective input i.e., βo, β1, β2, β3 in our case. In contrast, βi is a non-uniform constant, whose value is generally considered zero. Furthermore, in our analysis we also considered βi = 0. Similarly, SE ( ) is the error in respective error of each predictor i.e., βo, β1, β2 and β3 in our case. t-statistic is further used to find the p-value from t- distribution Table based on degree of freedom (DOF) [20]. Furthermore, preference is given to p over t statistics or value. If the value of p is equal to or less than 0.05, it means that parameter was significant in our analysis.
RESULTS Measuring viscosity using efflux time Measured values of viscosities as per ASTM Standard D-1200 are given in Table 1. From Table 1, it is obvious that only those values of viscosities can be calculated which are less than 12 St. Heating duration/time for all the experiments are fixed at five minutes. Effect of temperature on efflux time & flow rate In order to investigate the interdependence of input parameters which influences viscosity, some experiments are conducted. The results of these experiments shows that by increasing temperature at a fixed heating time of five minutes, there is an abrupt decrease in efflux time [see Fig. 1(a)]. From efflux time viscosity is calculated directly using the procedure given in the ASTM D-1200. Therefore, reduction in efflux time means viscosity will decrease. Similarly, decrease in efflux time also means polyester resin is flowing faster. Furthermore, with help of efflux time, flow rate is determined for fixed volume accumulated in Ford viscosity cup. Fig. 1(b) shows calculated flow rate which is plotted against input temperature. More-ever, Fig. 1(b) depicting that with increase in temperature, flow rate increases because it is dependent on decrease of efflux time. Fig. 2 (a), further supports Fig. 1(a) and (b) by depicting increase in flow rate with increasing input temperature.
Estimation of viscosity from significant input parameters All the values greater than 1200 cSt were not suggested by ASTM standard D-1200. Therefore, these viscosity values were estimated using indirect estimation parameters. By relating all significant input parameters with viscosity a statistical relation was established. For the known values of viscosity (up to 12 St) a statistical model was established with all input variables. This regression equation was used to extrapolate values beyond 1200 cSt or 12 St. Assumptions for estimation model Following assumptions have been considered during this study for simplifying the statistical estimation and analysis: – The interatomic bonding of long chain polymer (polyester resin) molecules is strong enough to hinder its flow. – Thermal expansion of viscosity cup has been considered negligible. To achieve minimum thermal expansion in cup, Teflon has been coated on the inner surface of the cup. – All the samples are heating for fixed or constant time. – Flow of fluid has been considered under gravity. No external pressure, force or shear stress has been applied on the liquid.
Figure 2. (a) Effect of input temperature on viscosity (b) Effect of velocity on flowrate
Pol. J. Chem. Tech., Vol. 20, No. 4, 2018 Regression analysis of input parameters Regression results based on p value (see Table 2) depicts that input parameters analyzed above (temperature and flow rate) as well as density (parameter indicated in literature21) plays a significant role in influencing viscosity, because p- values are substantially low. Based on Table 2, the t-values of density, temperature and flow-rate are 4.67, 5.33 and –8.24 respectively. These t- values are used to find the p-values by procedure mentioned in material and method section. Based on minitab software p-values of density, temperature and flow-rate are 0.001, 0.00001 and 0.00003 respectively. Based on eight samples, DOF comes out to be seven. Based on these results all the three input parameters must be included for further analysis.
63
of data points which means the statistical model can be used for the estimation of viscosity with confidence. Validation of results by Ubbelohde viscometer Ubbelohde viscometer readings validated the estimated viscosities [see Eq. (9)] which were above 12 St. Table 4, depicts that estimation using regression gives a close approximation, which were near to actual measurements. Effect of temperature and flow-rate on viscosity Results of three dimensional scatter plots [see Fig. 3] suggest that viscosity decreases with increasing temperature and flow rate. The reason for this change is the heat energy gained by polyester resin. After gaining some heat energy, flow-rate of the polyester resin en-
Table 2. Significance analysis of density, temperature and flow-rate calculated by minitab software based on available experimental data
Estimated unknown viscosities Based on known input and output values statistical relation was established. Flow rate and temperature are inversely related to viscosity. Furthermore, density is directly related with viscosity. Relation in generalized form is written as:
Table 4. Validating of estimated values which are greater than 12 St using Ubbelohde Viscometer
(8) is estimated value of viscosity in cm2/sec Where (St), density is represented by in g/cm3, ‘T’ represents temperature in Kelvins, and represents flow-rate in cm3/s, and fitting parameter ‘k’ of this model can be expressed in units K.cm8/g.s2. Estimation of viscosity can be performed using the above relation. By utilizing known values of inputs and outputs the relation can be written as follows: (9) On the basis of above relation estimated viscosities were calculated. The differences between estimated and measured values were shown in Table 3. The data given in Table 3, shows a small percentage of error for majority Table 3. Error estimation between measured and estimated values
Figure 3. 3D-plot depicting relationship of temperature, flowrate and viscosity
hances which as a result reduces viscosity and resin flows easily. This result further strengthens and validates the proposed statistical model and shows that with increase in temperature, flow rate is alleviated which reduces viscosity as a result. DISCUSSIONS Synthetic polymers have wide distribution between heavier and lighter macromolecules or network chains. Moreover, polymers like polyesters follow Gaussian distribution22. Some network chains are relatively higher while other are having lesser molar mass. Maximum
64
Pol. J. Chem. Tech., Vol. 20, No. 4, 2018
number of network chains lies between two extremes. Large variations in molar mass in polymers are overcome by characterizing them in terms of relative molar masses and we(RMM) i.e., number average molar mass ight average molecular mass . Increase in RMM and makes the motion of chains sluggish and ultimately elevates the viscosity23. A previous study indicates that increase in carbon chain length or molecular size in organic molecules also increases the viscosity and density24. Temperature also remained an important parameter which has been focal center of the various viscosity studies. Besides, increase in temperature also increases specific volume of the polymer sample which ultimately decreases the density of material22. By heating the viscous molecules of resin gains heat energy. This gained energy enhances flow characteristics of the polyester resin. Previously reported studies also validates that viscosity of organic materials decreases generally with increase in temperature due to ease of molecular motion25, 26. Furthermore, elevated temperature also increases the entropy or disorder of the system22. Fig. 2(a) depicts significant increase in velocity with temperature. Furthermore, Fig. 2(b) shows that flow rate depends upon velocity of the fluid, with increase in velocity, flow rate increases. Eq. (6) shows dependence of flow rate on velocity. Study conducted by Joseph27 also supports this notion that with increase in velocity, pressure decreases which enhances flow characteristics of the fluid. Based on these results it is deduced that flow rate and temperature directly influence viscosity of polyester. Moreover, increase in temperature enhances the possibility of chain motion. Furthermore, the relation between viscosity and input parameters exists with 99.99% confidence interval i.e., 0.001. Results obtained from Eq. (9) are also validated by a recent research conducted on diesel fuel21. Findings of that diesel research concluded that temperature effects density, viscosity and flow behavior of the fluid. By increasing temperature, density and viscosity decreases21. Furthermore, existing literature shows that polyester resin viscosity also lies in somewhat close ranges28. CONCLUSION This paper concludes that viscosity can be estimated indirectly by using Ford cup to determine flow rate instead of viscosity after heating specimen at desired temperature. Based on obtained results it is concluded that instead of measuring viscosity directly, flow rate shall be measured from Ford cup at atmospheric conditions. The measured flow rate is used in statistical model along with input temperature and density. This proposed estimation model has the ability to estimate viscosities up to and greater than 12 St. Readings from Ubbelohde viscometer further validated the estimated results. Additionally, this indirect estimation method is very simple and economical at industrial scale. Estimation of viscosity was achieved without using rigorous calculations. Additionally, this method can be used in estimation of viscosity of liquids (paints, liquor, varnishes, resins, juices and oils). Since a key contribution of this study was to find viscosity estimation procedure using temperature, flow-rate
and density. In future, several areas for research work can spin off from this study. Notably, the aforementioned method can be successfully used for the estimation of viscosity of various other polymers. Acknowledgement We acknowledge Dr. Javaid Ahsan Bhatti for assisting in manufacturing of viscosity cups in time and for allowing us to conduct in their research institute National Institute of Vacuum Science & Technology, NCP Complex, 45320, Quaid.e.Azam University, Islamabad,Pakistan. LITERATURE CITED 1. Rajput, R.K. (2008). A text book of Fluid Mechanics (Ist ed.). New Delhi: S. Chand limited 2. Harper, B.D. & Staab, G.H. (1987). A note on the effect of voids upon the hygral and mechanical properties of AS4/3502 graphite/epoxy, J. Compos. Mater. 21(3), 280–289. DOI: 10.1177/002199838702100306. 3. Um, M.K., Byun, J.H. & Isaac, M.D. (2009). Similarity relations of resin flow in resin transfer molding process, Adv. Compos. Mater. 18(2), 135–152. DOI: 10.1163/156855109X428745. 4. Brouwer, W.D., van Herpt, E.C.F.C. & Labordus, M. (2003). Vacuum injection moulding for large Applications, Compos 34(6), 551–558. DOI: 10.1016/S1359-835X(03)00060-5. 5. Kedari, V.R., Farah, B.I. & Hsiao, K.T. (2011). Effects of vacuum pressure, inlet pressure, and mold temperature on the void content, volume fraction of polyester/e-glass fiber composites manufactured with VARTM process, J. Compos. Mater. 45, 2727–2742. DOI: 10.1177/0021998311415442. 6. Nawaz, A., Islam, B., Akhtar, R., Alamgir, K. & Noor, S. (2015). Failure of polyester laminated automotive ignition coils influenced by environmental factors. Arab. J. Sci. Eng. 40, 3337–3344 (2015) DOI: 10.1007/s13369-015-1789-4. 7. Kulicke, W.M. & Clasen, C.M. (2004). Viscosimetry of Polymers and Polyelectrolytes (1st ed.). Berlin: Springer Verlag 8. Viswanath, D.S., Ghosh, .T., Prasad, D.H.L., Dutt N.V.K. & Rani, K.Y. (2007). viscosity of liquids theory, estimation, experiment, and data (1st ed.). Berlin: Springer 9. Walters, K. & Barnes, H.A. (1980). Anomalous extensionsal-flow effects in the use of commercial viscometers. In: Astarita, G.M. (Eds.), Rheology, (pp. 45–62) Newyork, Springer. 10. Pereira, C.M.C., Nóvoa, P., Martins, M., Forero, S., Hepp, F. & Pambaguian, L. (2010). Characterization of carbon nanotube 3D-structures infused with low viscosity epoxy resin system, Compos. Structures. 92(9), 2252–2257. DOI:10.1016/j. compstruct.2009.08.009. 11. Rahmanian, S., Suraya, A.R., Roshanravan, B., Othmand, R.N., Nasser, A.H., Zahari, R. & Zainudin, E.S. (2015). The influence of multiscale fillers on the rheological and mechanical properties of carbon-nanotube–silica-reinforced epoxy composite, Mater. & Desi. 88, 227–235. DOI: 10.1016/j.matdes.2015.08.149. 12. Vahedi, V., Pasbakhsh, P. & Chai, S.P. (2015). Toward high performance epoxy/halloysite nanocomposites: New insights based on rheological, curing, and impact properties, Mater. & Desi. 68(5), 43–53. DOI: 10.1016/j.matdes.2014.12.010. 13. Zhang, Y., An, Z., Bai, H., Li, Q. & Guo, .Z. (2015). Characterization and measurement of apparent viscosity of solid particles in fixed beds under high temperature, Powder Technol. 284, 279–288. DOI: 10.1016/j.powtec.2015.06.069. 14. Lee, W.I., Loos, A.C. & Springer, G.S. (1982) Heat of reaction, degree of cure, and viscosity of Hercules 3501-6 resin, J. Compos. Mater. 16(6), 510–520. DOI: 10.1177/002199838201600605. 15. Dusi, M.R., Lee, W.I., Peter, R.C. & Springer, G.S. (1987). Cure kinetics and viscosity of fiberite 976 resin, J. Compos. Mater. 21(3), 243–261. DOI: 10.1177/002199838702100304.
Pol. J. Chem. Tech., Vol. 20, No. 4, 2018 16. Halley, P.J. & Mackay, M.E. (1996). Chemorheology of thermosets: an overview, Polymer Eng. Sci. 36(5), 593–609. DOI: 10.1002/pen.10447. 17. Berry, G.C. & Fox, T.G. (1968). The viscosity of polymer and their concentrated solutions, Adv. Polymer Sci. 5(3), 261–357. DOI:10.1007/BFb0050985. 18. Deka, A. & Dey, N. (2013). Rheological studies of two component high build epoxy and polyurethane based high performance coatings, J. Coat. Technol. Res. 10(3), 305–315. DOI: 10.1007/s11998-012-9445-3. 19. Ghannam, M.T. & Esmail, N. (2006). Flow enhancement of medium-viscosity crude oil, Petroleum Sci & Technol, 24(8), 985–999. DOI: 10.1081/LFT-200048166. 20. Montgomery, D.C. (2006). Design and analysis of experiments. New York: Wiley. 21. Park, Y., Hwang, J., Bae, C., Kim, K., Lee, J. & Pyo, S. (2015). Effects of diesel fuel temperature on fuel flow and spray characteristics, Fuel 162, 1–7. DOI: 10.1016/j.fuel.2015.09.008. 22. Young, R.J. & Lovell P.A. (1991) Introduction to polymers. Hongkong: Chapman & Hall. 23. McCrum, N.G., Buckley, C.P. & Bucknall, C.B. (1997) Principles of polymer engineering. New York: Oxford University Press.
65
24. Saleh, M.A., Akhtar, S., Begum, S., Ahmed, M.S. & Begum, S.K. (2004) Density and viscosity of 1-alkanols, Phys. Chem. Liquids 42(6), 615–623. DOI: 10.1080/00319100412331284422. 25. Ren, D.H., Fang, S., Xu, X.J. & Ding, B. (2014). Volumetric properties and viscosities of acetic acid with ethylene glycol and diethylene glycol at temperatures from 303.15 to 323.15K, Chem Eng Comm. 201(4), 528–544. DOI: 10.1080/00986445.2013.780164. 26. Nawaz, A. (2013). Study of the problem of void formation in electrical lamination parts and its removal. MS Dissertation, University of Engineering & Technology, Peshawar, KPK, Pakistan 27. Joseph, D.D. (1998). Cavitation and the state of stress in a flowing fluid. J. Fluid Mech. 366, 367–378. DOI: 10.1017/ S0022112098001530. 28. Yang, Y.S. (1996). Viscosities of unsaturated polyester resins: combining effects of prepolymer structure, resin composition, and temperature, J. Appl. Poly. Sci. 60(13), 2387–2395. DOI: 10.1002/(SICI)1097-4628(19960627)60:133.0.CO;2-2.
APPENDIX Table 1. Ranges of Ford Viscosity cups
Figure 1. (a) Inner dimensions of viscosity cup [ASTM D-1200] (b) Experimental setup for measuring viscosity [Courtesy from Paul N. Gardner Co.]