Journal of Modern Applied Statistical Methods Volume 15 | Issue 2
Article 44
11-1-2016
An Alternative Method for Multiple Linear Model Regression Modeling, a Technical Combining of Robust, Bootstrap and Fuzzy Approach Wan Muhamad Amir W Ahmad Universiti Sains Malaysia,
[email protected]
Mohamad Arif Awang Nawi Universiti Malaysia Terengganu,
[email protected]
Nor Azlida Aleng Universiti Malaysia Terengganu,
[email protected]
Mohamad Shafiq Universiti Sains Malaysia, Kelantan, Malaysia,
[email protected]
Follow this and additional works at: http://digitalcommons.wayne.edu/jmasm Part of the Applied Statistics Commons, Social and Behavioral Sciences Commons, and the Statistical Theory Commons Recommended Citation W Ahmad, Wan Muhamad Amir; Awang Nawi, Mohamad Arif; Aleng, Nor Azlida; and Shafiq, Mohamad (2016) "An Alternative Method for Multiple Linear Model Regression Modeling, a Technical Combining of Robust, Bootstrap and Fuzzy Approach," Journal of Modern Applied Statistical Methods: Vol. 15: Iss. 2, Article 44. DOI: 10.22237/jmasm/1478004120 Available at: http://digitalcommons.wayne.edu/jmasm/vol15/iss2/44
This Algorithms and Code is brought to you for free and open access by the Open Access Journals at DigitalCommons@WayneState. It has been accepted for inclusion in Journal of Modern Applied Statistical Methods by an authorized administrator of DigitalCommons@WayneState.
Journal of Modern Applied Statistical Methods November 2016, Vol. 15, No. 2, pp-pp. doi: 10.22237/jmasm/1478004120
Copyright © 2016 JMASM, Inc. ISSN 1538 − 9472
An Alternative Method for Multiple Linear Model Regression Modeling, a Technical Combining of Robust, Bootstrap and Fuzzy Approach Wan Muhamad Amir W Ahmad
Mohamad Arif Awang Nawi
University of Science, Malaysia Kelantan, Malaysia
University Malaysia Terengganu Kuala Terengganu, Malaysia
Nor Azlida Aleng
Mohamad Shafiq
University Malaysia Terengganu Kuala Terengganu, Malaysia
University of Science, Malaysia Kelantan, Malaysia
Research on modeling is becoming popular nowadays, there are several of analyses used in research for modeling and one of them is known as applied multiple linear regressions (MLR). To obtain a bootstrap, robust and fuzzy multiple linear regressions, an experienced researchers should be aware the correct method of statistical analysis in order to get a better improved result. The main idea of bootstrapping is to approximate the entire sampling distribution of some estimator. To achieve this is by resampling from our original sample. In this paper, we emphasized on combining and modeling using bootstrapping, robust and fuzzy regression methodology. An algorithm for combining method is given by SAS language. We also provided some technical example of application of method discussed by using SAS computer software. The visualizing output of the analysis is discussed in detail. Keywords:
Multiple linear regression, robust regression, bootstrap method
Introduction Multiple linear regression (MLR) is an extension of simple linear regression. The random error term is added to make the model probabilistic rather than deterministic. The value of the coefficient βi determines the contribution of the independent variables xi, and β0 is the y-intercept (Ngo & La Puente, 2012; Amir,
Dr. Wan Muhamad Amir W Ahmad is an Associate Professor. Email him at:
[email protected]. Mohamad Arif Bin Awang Nawi is a postgraduate student in the Faculty Informatics and Computing. Email him at:
[email protected].
2
AHMAD ET AL.
Shafiq, Rahim, Liza, & Aleng, 2016). A fuzzy regression model corresponding to equation (1) can be stated as:
y A0 A1 x1 A2 x2 Ak xk
(1)
Explanation variables xi’s are assumed to be precise. However, response variable Y is not crisp; it is fuzzy in nature. That means the parameters are also fuzzy in nature. Hence, the objective is to estimate these parameters. Assume Ai’s are assumes symmetric fuzzy numbers which can be presented by interval. For example, Ai can be expressed as a fuzzy set given by Ai = < a1c, a1w > where aic is center and aiw is radius or has associated vagueness. The fuzzy set reflects the confidence in the regression coefficients around aic in terms of symmetric triangular memberships function. Application of this method should be given more attention when the underlying phenomenon is fuzzy which means that the response variable is fuzzy. Thus, the relationship is also considered to be fuzzy. Ai = < a1c, a1w > can be written as Ai = [ a1L, a1R ] with a1L = a1c - a1w and a1R = a1c - a1w (Kacprzyk & Fedrizzi, 1992). In fuzzy regression methodology, parameters are estimated by minimizing total vagueness in the model.
y j A0 A1 x1 j A2 x2 j Ak xkj
(2)
Using Ai = < a1c, a1w > write
y j a0c , a0 w a1c , a1w x1 j anc , anw xnj a jc , a jw
(3)
Thus,
y jc a0c a1c x1 j y jw a0 w a1w x1 j
anc xnj
(4)
anw xnj
(5)
As yjw represent radius and so cannot be negative, therefore on the righthand side of equation yjw = a0w + a1w | x1j | +…+ anw | xnj |, absolute values of xij are taken. Suppose there m data point, each comprising a (n + 1) - row vector. Then parameters Ai are estimated by minimizing the quantity, which is total vagueness
3
ALTERNATIVE MULTIPLE LINEAR MODEL REGRESSION MODELING
of the model-data set combination, subject to the constraint that each data point must fall within estimated value of response variable. This can be visualized as the following linear programming problem.
a m
Minimized
0w
j 1
a1w x1 j
anw xnj
Subject to n n a a x a 0c ic ij 0 w aiw xij Y j i 1 i 1
n n a a x a 0c ic ij 0 w aiw xij Y j i 1 i 1
and aiw ≥ 0. Simplex procedure is generally employed in order to solve the linear programming problem. Calculation for linear Regression using SAS /* First do Multiple linear regression */ procreg data=temp1; model y=x1
x2;
run;
Approach the MM-Estimation Procedure for Robust Regression /* Then do robust regression, in this case, MM-estimation */ ods graphics on; procrobustreg
method
=
MM
fwls
data=biostatistics
plot=fitplot(nolimits)
plots=all; model y = x1
x2 / diagnostics itprint;
output out=resids out=robout r=residual weight=weight outlier=outlier sr=stdres; run; ods graphics off;
4
AHMAD ET AL.
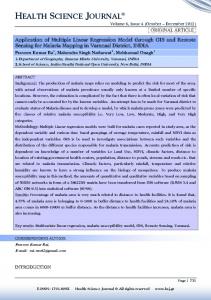
Start
Data Collection
Checking Assumptions
Model Building with Robust Regression
Yes
Diagnostics Test : Checking for outliers Robust Procedure in SAS Algorithm
Selection of MM or LTS estimation
No
Linear Regression (Using SAS software)
Adding Bootstrap to the Linear Regression with Replication (n = 1000) Bootstrap Procedure In SAS Data Analysis Based on Alternative Model
Results
Stop
Figure 1. Flow Chart of Robust, Bootstrap and Fuzzy Regression
5
ALTERNATIVE MULTIPLE LINEAR MODEL REGRESSION MODELING
Procedure for Bootstrap with Case Resampling n = 1000 /* And finally, use a bootstrap with case resampling */ ods listing close; procsurveyselect data=temp1 out=boot1 method=urs samprate=1 outhits rep=1000; run;
Procedure for bootstrap into fuzzy regression Model /*Combination of Bootstrap Technique with Fuzzy Regression*/ ods listing close; procoptmodel; set j= 1..8; numberFish{j}, weight{j}, height{j}; read data boot1 into [_n_]
Fishweight height;
/*Print Fishweight height*/ printFishweight height; number n init 8;
/*Total of Observations*/
/* Decision Variables bounded or not bounded*/ /*Theses three variables are bounded*/ var aw{1..3}>=0; /*These three variables are not bounded*/ var ac{1..3}; /* Objective Function*/ min z1= aw[1]*n + sum{i in j} weight[i]*aw[2]+sum{i in j} height[i]*aw[3]; /*Linear Constraints*/ con c{i in 1..n}: ac[1]+weight[i]*ac[2]+height[i]*ac[3]-aw[1]-weight[i]*aw[2]-height[i]*aw[3]
= Fish[i];
6
AHMAD ET AL.
expand;/* This provides all equations */ solve; print ac aw; quit; ods rtf close;
An Illustration of a Biostatistics Case A Case Study of Aquaculture Table 1. Description of the Variables Variables
Code
Description
Fish Weight Height
Y X1 X2
Number of Fish Caught Weight in (g) Height in (cm)
*(Talib, Jaafar, & Sirwar, 2007)
Full Algorithm for Alternative Multiple Linear Regression Modelling Title 'Alternative Linear programming with combining robust and bootstrap'; data Biostatistics; input Fish weigh height; datalines; 97.32
110.41
103.74
174.52
111.08
104.80
214.56
114.98
105.71
178.44
114.16
105.27
199.48
112.99
105.45
189.92
115.20
105.34
170.48
113.24
105.11
207.16
117.19
105.66
; run; ods rtf file='result_ex1.rtf' ; /*The next step is performing the procedure of modeling linear
7
ALTERNATIVE MULTIPLE LINEAR MODEL REGRESSION MODELING
regression model */ procreg data = biostatistics; modelFish =weigh height; run; /* Then do robust regression, in this case, MM-estimation */ ods graphics on; procrobustreg
method
=
MM
fwls
data=
biostatistics
plot=fitplot(nolimits)
plots=all; modelFish =weigh height/ diagnostics itprint; output out=resids out=robout r=residual weight=weight outlier=outlier sr=stdres; run; ods graphics off; /* And finally use a bootstrap with case resampling */ ods listing close; procsurveyselect data = biostatistics out = boot1 method = urs samprate =1 outhits rep=1000; run; /*Combination of Bootstrap Technique with Fuzzy Regression*/ ods listing close; procoptmodel; set j= 1..8; numberFish{j}, weigh{j}, height{j}; read data boot1 into [_n_]
Fish weigh height;
/*Print Fish weight height*/ printFish weigh height; /*Total of Observations*/ number n init 8; /*Theses three variables are bounded*/ var aw{1..3}>=0; /*These three variables are not bounded*/ var ac{1..3}; /* Objective Function*/
8
AHMAD ET AL.
min z1= aw[1]*n + sum{i in j} weigh[i]*aw[2]+sum{i in j} height[i]*aw[3]; /*Linear Constraints*/ con c{i in 1..n}: ac[1]+ weigh[i]*ac[2]+height[i]*ac[3]-aw[1]-weigh[i]*aw[2]height[i]*aw[3] = Fish[i]; expand; /* This provides all equations */ solve; print ac aw; quit; ods rtf close;
Results A higher R-squared value indicated how well the data fit the model and indicates a better model. Table 2. Goodness-of-fit Goodness-of-Fit Statistic R-Square AICR BICR Deviance
Value 0.8199 5.5323 9.4456 234.4750
Method of Multiple linear regression (MLR), we obtained the result as shown in Table 3 Table 4 shows the results by using bootstrapping method for fuzzy regression with n = 1000. The aim of bootstrapping procedure is to approximate the entire sampling distribution of some estimator by resampling (simple random sampling with replacement) from the original data (Yaffee, 2002). Table 4 summarizes the findings of the calculated parameter.
9
ALTERNATIVE MULTIPLE LINEAR MODEL REGRESSION MODELING
Table 3. Parameter Estimates for Final Weighted Least Squares Fit Parameter Estimates for Final Weighted Least Squares Fit Parameter DF Estimate Intercept x1 x2 Scale
Standard Error
95% Confidence Limits
Chi-Square
Pr > ChiSq
1
-6334.91
608.3789
-7527.31
-5142.51
108.43