Key words: Bootstrap Weighted SAS algorithm and robust regression. INTRODUCTION ... Con c{i in 1..n}:. Ac[1]+x1[i]*ac[2]+x2[i]*ac[3]+x3[i]*ac[4]+x4[i]*ac[5]+x.
Middle-East Journal of Scientific Research 23 (10): 2559-2571, 2015 ISSN 1990-9233 © IDOSI Publications, 2015 DOI: 10.5829/idosi.mejsr.2015.23.10.22731
An Alternative Method for Regression Modelling: Algorithm for Weighted Robust Regression 1
Wan Muhamad Amir W. Ahmad, 2Nor Azlida Aleng, 2Nurfadhlina Abdul Halim, 2 Syerrina Zakaria, 3Kasypi Mokhtar, 1Ruhaya Hasan and 4Tan Min Pau
School of Dental Sciences, Health Campus, Universiti Sains Malaysia (USM), 16150 Kubang Kerian, Kelantan, Malaysia 2 School of Informatics and Applied Mathematics, 3School of Maritime Business and Management, 4 School of Fisheries and Aquaculture Sciences, Universiti Malaysia Terengganu (UMT), 21030 Terengganu Malaysia 1
Abstract: This report supplied a comprehensive method of an alternative fuzzy weighted robust linear regression as a technique for analysis through SAS algorithm. This alternative method is a manipulation technique for the small data set and give the researcher an options to launch the analysis even there is not enough data set. Key words: Bootstrap
Weighted
SAS algorithm and robust regression
INTRODUCTION
D a t a C o ll e ct i o n
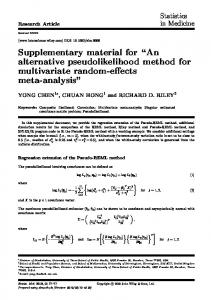
Thus, this paper provides a road map of the practical approach for regression modeling and an illustration using fisheries dataset. The parametric bootstrap method is recommended for sample size between 50 and 100 for a reliable performance [1, 2]. A recent approach to analyse data with missing values in the covariates is weighted estimating equations and this technique appear to be highly efficient [3, 4]. Data of this study is a sample which composed of six variables. Namely variables are as in Table 1. Multiple fuzzy with weighted regression technique was used in the analysis of relationship between variables. The algorithm is given as follows: Figure 1 showed the flow chart of an alternative method of fuzzy weighted regression procedure.
L i n e a r R e g r e s s io n Model
R o b u s t R e g ress i o n w i th m m E s ti ma tio n
P e rform i n g R o b u st R e g res s i o n w ith cas e Resampling
A ltern a tive Stan d a rd P roce d u r e F o r R e g r e s s i o n M o d e llin g
P e rform i n g W e i g h te d f o r t h e Re gres s i o n
A p p l ie d F u z z y R e g re s s i o n M e t h o d to thi s A l t ern a t i v e M e th o d
Table 1: Description of Data Num.
Code
Explanation of user variables
1. 2. 3. 4. 5. 6
Y X1 X2 X3 X4 X5
Standard Length of the fish Total Length of the fish Fish Weight (g) Turbidity Temperature Dissolved Oxygen (mg/l)
Corresponding Author:
In te rp re t T he O u t pu t
E n d P ro c e s s
Fig. 1: Flow Chart of an Alternative Analysis
Wan Muhamad Amir W. Ahmad, School of Dental Sciences,Health Campus, Universiti Sains Malaysia (USM), 16150 Kubang Kerian, Kelantan, Malaysia.
2569
Middle-East J. Sci. Res., 23 (10): 2569-2571, 2015
/*Title 'alternatif linear programming with combining robust and bootstrap'*/ Data fish; Input y x1 x2 x3 x4 x5; Datalines; 31.00
52.00
2.00
19.70
26.08
5.43
32.00
42.00
2.00
1.420
29.75
3.58
32.00
41.00
2.00
6.100
26.39
7.06
33.00
42.00
1.00
1.420
29.75
3.58
33.00
42.00
2.00
17.80
28.36
6.56
34.00
44.00
2.00
1.420
29.75
3.58
34.00
45.00
10.00
1.730
29.35
3.54
35.00
45.00
1.00
12.63
30.44
4.03
35.00
43.00
1.00
1.420
29.75
3.58
; run; Ods rtf style=journal;
/*performing the procedure regression model*/ Ods graphics on; Proc reg data=fish; Model y=x1 x2 x3 x4 x5; run; Ods graphics off;
of modeling
linear
/*robust regression for mm-estimation*/ Ods graphics on; Proc robustreg method=mm fwls data=fish plots=all; Model y=x1 x2 x3 x4 x5 / diagnostics itprint; Output out=resids out=robout r=residual weight=weight outlier=outlier sr=stdres; run; Ods graphics off; /*using bootstrap with case resampling*/ Proc surveyselect data=fish out=boot1 method=urs samprate=1 outhits rep=100; run; /*robust regression for mm-estimation+bootstrap*/ Ods graphics on; Proc robustreg method=m(wf=huber(c=1.345))fwls data=boot1 plots=all; Model y=x1 x2 x3 x4 x5 / diagnostics itprint; Output out=resids out=robout r=residual weight=weight outlier=outlier sr=stdres; run; Ods graphics off;
/*combining bootstrap technique with regression*/ Proc optmodel; Set j= 1..30; Number y{j}, x1{j}, x2{j}, x3{j}, x4{j}, x5{j}; Read data boot1 into [_n_] y x1 x2 x3 x4 x5;
fuzzy
/*print y x1 x2 x3 x4 x5*/ Print y x1 x2 x3 x4 x5; Number n init 30; /*total of observation*/ /*decision variable bounded or not bounded*/ Var aw{1..6}>=0; /*these six variables are bounded*/ Var ac{1..6}; /*these six variables are not bounded*/ /*objective function*/ Min z1= aw[1] * n + sum{i in j} x1[i] * aw[2]+sum{i in j} x2[i] * aw[3]+sum{i in j} x3[i] * aw[4]+sum{i in j} x4[i] * aw[5]+sum{i in j} x5[i] * aw[6]; /*linear constraints*/ Con c{i in 1..n}: Ac[1]+x1[i]*ac[2]+x2[i]*ac[3]+x3[i]*ac[4]+x4[i]*ac[5]+x 5[i]*ac[6]-aw[1]-x1[i]*aw[2]-x2[i]*aw[3]-x3[i]*aw[4]x4[i]*aw[5]-x5[i]*aw[6]=y[i]; Expand; /*this provides all equations*/ Solve; Print ac aw; Quit; Ods rtf close; RESULT AND DISCUSSION This paper explained on how an alternative programming method of fuzzy bootstrap weighted regression procedure using SAS software can be applied for the small sample size which the data is very difficult to collect. By resampling (using bootstrap method), it provides the pleminary comprehensive information and also give the general overview on how the data behaviour even though the original data is not enough (small sample size). 2570
Middle-East J. Sci. Res., 23 (10): 2569-2571, 2015
In our case, smaller standard error of the estimate parameter will tell us how accurate our estimate parameter is likely to be. REFERENCES 1.
Cassel, D.L., 2010. Bootstrap Mania: Re sampling the SAS. SAS Global Forum 2010: Statistics and Data Analysis Paper, pp: 1-11.
2.
3.
4.
2571
Jung, B.C., M. Jhun and J.W. Lee, 2005. Bootstrap tests for overdispersion in a zero-inflated Poisson model. Journal of Biometrics, 61(6): 626-628. Robin, J.M., A. Rotnitzky and L.P. Zhoa, 1994. Estimation of regression coe_cients when some regressors are not always observed. Journal of the American Statistical Association, 89: 846-866. Zhao, L.P., S.R. Lipsitz and D. Lew, 1996. Regression analysis with missing covariate data using estimating equations. Biometrics, 52: 1165-1182.