ISTANBUL UNIVERSITY – JOURNAL OF ELECTRICAL & ELECTRONICS ENGINEERING
YEAR VOLUME NUMBER
: 2008 :8 :2
(657-663)
AN APPLICATION OF DENOISING BASED ON WAVELET TRANSFORM FOR TEMPERATURE SIGNALS OF THE ALTERNATORS IN A PASSENGER COACH Sezai TAŞKIN
Serhat ŞEKER (*)
T. Çetin AKINCI
[email protected]
[email protected]
[email protected]
Celal Bayar University, Turgutlu Vocational College, 45400, Turgutlu-Manisa, Turkey Marmara University, Faculty of Technical Education, Electrical Education Department, 34722, Kadikoy-Istanbul, Turkey Istanbul Technical University, Electrical Engineering Department (*), 34469, Maslak-Istanbul, Turkey
ABSTRACT This paper deals with a passenger coach alternators. In this study, temperature variations, which are depended on load conditions of alternators in a passenger coach, have been investigated using the wavelet transform based denoising and statistical methods. To obtain real road data from the bus alternators, the bus was driven 456 km on the roadway in Turkey. During the collecting alternators data, interior lighting lambs on/off locations, air conditioner operation position, bus headlights situations and other electrical/electronic devices on/off positions have been considered. MATLAB program was used for the signal analysis of the alternators. Keywords: Wavelet transformation, alternator, passenger coach, temperature signal analysis. 1. INTRODUCTION The vehicle electric power system, which consists of two major components: a alternator and a battery, which have to provide numerous electrical and electronic systems with enough electrical energy. A detailed understand ding of the characteristics of the electric power system, electrical load demands, and the driving environment such as road, season, and vehicle weight is required when the capacities of the alternator and the battery are to be determined for a vehicle. The customer requirements and expectations are the driving force behind the increase in electrical power demand, and must be the strongest influence in determining future strategy. In order for the entire system to be reliable and trouble free in any operating it is necessary that the electric power output from a battery and an alternator should be matched with the remaining electrical loads as optimally as possible. An improper decision of the capacity of electric power system, such as the alternator and battery, will cause serious problems in real driving conditions. For example, if the Received Date: 08.08.2007 Accepted Date: 01.07.2008
alternator capacity is designed too small, cold cranking problems and roadside breakdowns may occur. On the contrary, overdesign of alternator capacity will degrade fuel economy due to vehicle weight and loss of propulsion power, and it will increase the cost of the vehicles [1]. An alternator is an electromechanical device that converts rotational motion into a DC voltage output. Alternators are widely used as generators in passenger cars. They have to generate sufficient energy for all electric consumers and to keep the battery charge in balance. A controller provides constant voltage at variable speed and load. The output performance is highly depending on the alternator speed. In order to reduce emissions and fuel consumption, to increase comfort and security and to improve drive dynamics more electric and electronic consumers, which require higher output performance, are installed [2].
658
AN APPLICATION OF DENOISING BASED ON WAVELET TRANSFORM FOR TEMPERATURE SIGNALS OF THE ALTERNATORS IN A PASSENGER COACH
The technology used within starter motors and alternators has become more advanced in response to the installation of an increasing number of electrical components in vehicles. Alternator converts rotational motion into DC voltage output. In general, the alternators are composed of an AC generator, rectifier, and voltage regulator. The regulator, which is connected the terminal of the AC generator, regulates the terminal voltage of the alternator at the constant value. Alternators are coupled with the engine by a pulley. Owing to the constant pulley ratio between the alternator and the engine, the alternator operates at greatly different speeds. So, the generated energy of the alternator heavily depends on the engine rpm [3,4]. This connection schema is shown by Fig. 1.
rn Alte
r ato
ine E ng
Battery
Figure 1. General electrical connection schema for the vehicles In order to supply the electric power, vehicles need an efficient and highly reliable source of energy of their own which must always be available at any time. When the engine is running, the alternator becomes the on-board electricity generating plant, whereas, either when the engine stopped or when the alternator’s output power is insufficient, the battery is the vehicles energy storage [1]. The connection schema is shown in Fig. 2.
Figure 3. Characteristic curve of the alternator Temperature measurement is one of the significant functions in the field of measurement, which has been most frequently conducted in meteorological observation, environmental research, laboratories, and various other production processes. Temperature measurement is fundamental and important in terms of manufacturing products in a specified condition and maintaining consistent quality in the industry [5]. In this study, temperature variations, which are depended on load conditions of alternators in a passenger coach, have been investigated using the wavelet transform based denoising and statistical methods. For this aim, calculating coherence function defined between two temperature variations related to the alternator, hence most correlated peak appeared at around the coherence level of 0.7, can be estimated to describe the equal load sharing of the alternators in time domain. 2. MATHEMATICAL METHODS 2.1 Statistical Method
Battery
Electrical Load
Alternator
Figure 2. Diagram of supply/demand of vehicle electric power In Fig. 3, the maximum available output current of the alternator at a variety of different speeds is shown by the characteristic curve.
Several statistical parameters, calculated in the time domain, are generally used to define average properties of machinery data. The two basic parameters are the mean value, μ and the standard deviation, σ. For a given data set {xi} these are defined as follows:
μ=
1 N ∑ xi N i =1
where N is the number of the data points.
Sezai TAŞKIN, T. Çetin AKINCI, Serhat ŞEKER
(1)
AN APPLICATION OF DENOISING BASED ON WAVELET TRANSFORM FOR TEMPERATURE SIGNALS OF THE ALTERNATORS IN A PASSENGER COACH
For the Gaussian (normal) probability distribution, two parameters that reflect the departure from the normal distribution are skewness (c) and kurtosis (k). These are calculated as follows,
⎡1 N 3⎤ ⎢ N ∑ ( xi − μ ) ⎥ ⎦ c = ⎣ i =1 3 σ ⎡1 ⎢ N k=⎣
N
∑ (x
i
i =1
⎤ − μ) 4 ⎥ ⎦
The cause and effect relationship between two signals or the commonality between them is generally estimated using the coherence function. The coherence function is given by
S xy ( f )
γ xy ( f ) =
S xx ( f ) S yy ( f )
, 0 < γxy < 1 (6)
(2) Where Sxx and Syy are the APSD’s of x(t) and y(t), respectively, and Sxy is the CPSD between x(t) and y(t). A value of coherence close to unity indicates highly linear and close relationship between the two signals [8-10].
(3)
σ4
659
For a perfect normal distribution, c is equal to zero. A negative value is due to skewness towards lower values while a positive value indicates non-symmetry towards higher values. For small data sets, one often gets values that differ from zero. The kurtosis or flatness k, is very close to unity for a normal distribution. These statistical parameters may be used to perform a quick check of the changes in the statistical behaviour of a signal [6,7]. 2.2 Spectral Methods
2.3 Wavelet Transform The use of wavelet transform is particularly appropriate since it gives information about the signal both in frequency and time domains. Let f(x) be the signal, the continuous wavelet transform of f(x) is then defined as W f (a, b) =
+∞
f(x)ψ a,b (x)dx,
(7)
Where;
ψa,b (x) =
A common approach for extracting the information about the frequency features of a random signal is to transform the signal to the frequency domain by computing the discrete Fourier transform. For a block of data of length N samples the transform at frequency mΔf is given by
∫
−∞
⎛ x−b⎞ ψ⎜ ⎟ a, b ∈ R, a ≠ 0 a ⎝ a ⎠
1
(8) And it provides the admissibility condition as below
CΨ =
∫
+∞
0
ψ (ω) dω 〈∞ ω 2
(9)
N −1
X (mΔf ) = ∑ x(kΔt ) exp[− j 2πkm / N ] k =0
(4) Where Δf is the frequency resolution and Δt is the data-sampling interval. The auto-power spectral density (APSD) of x(t) is estimated as
S xx ( f ) =
1 2 X (mΔf ) , f = mΔf N
(5)
The cross power spectral density (CPSD) between x(t) and y(t) is similarly estimated. The statistical accuracy of the estimate in Equation (2) increases as the number of data points or the number of blocks of data increases.
And for this reason, it is +∞
∫ ψ (x )dx = 0 −∞
(10)
Here ψ (ω) stands for the Fourier transform of
ψ ( x ) . The admissibility condition implies that the Fourier transform of ψ ( x ) vanishes at the zero frequency. Therefore ψ is called as a
wave or the mother wavelet and it have two characteristic parameters, namely, dilation (a) and translation (b), which vary continuously. The translation parameter, “b”, controls the position of the wavelet in time. A “narrow” wavelet can access high-frequency information, while a more dilated wavelet can access low-frequency information. This means
Sezai TAŞKIN, T. Çetin AKINCI, Serhat ŞEKER
660
AN APPLICATION OF DENOISING BASED ON WAVELET TRANSFORM FOR TEMPERATURE SIGNALS OF THE ALTERNATORS IN A PASSENGER COACH
that the parameter “a” varies with different frequency. The parameters “a” and “b” take j
discrete values, a = a0 , b = nb0 a0j , where n, j ∈ Z, a0 >1, and b0 >0. The discrete wavelet transformation (DWT) is defined as [11-14]; DWT [j, k] =
1 a0j
K type termocouple
⎡ k − na0j ⎤ ⎥ j ⎣ a0 ⎦
∑ f [n]ψ ⎢ n
(11) Alternator_2
Alternator_1
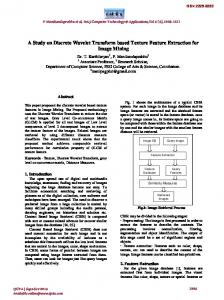
3. MEASUREMENT SYSTEM and DATA ACQUISITION
Figure 4. Picture for locations of alternators in the bus
This study based on temperature variation measurement of alternators in bus. During the data acquisition, environmental temperature measurements and battery temperature were also collected by sampling frequency at 1 Hz, while the bus is driven total 456 km on the roadway under the specific load conditions as given in Table 1. Hence, the data were saved using a hybrid temperature recorder via K type thermocouples. Fig. 4 shows the replacements of the alternators in the bus.
4. APPLICATION
Weight 18 T
Electrical Loads Air conditioner, low beam lamp, position lamps, fog lamps, internal lamps.
Battery
70 60 50 40 30 20 10 0
Good (Acid ratio:1.30 g/ml)
Also, other electrical specifications of the bus are summarized:
80
24 V - central electrical systems 28 V - 140 A for each alternator 24 V - 5.4 kW starter motor 200 Ah for each battery.
1
2
3 4 Time [s]
5
6
7 4 x 10
Figure 5. Temperature variation for the alternator #1 Temperature #2 60 55 Temperature [C]
Mechanical Load
Temperature #1 90
Temperature [C]
Table 1. Bus Load Conditions
Data sets used in this application are shown by the following figures. Here Fig. 5 and Fig. 6 are related to temperature variations of the alternators, namely alternator #1 and #2 respectively.
50 45 40 35 30 25 20 15 0
1
2
3 4 Time [s]
5
Figure 6. Temperature variation for the alternator #2 As seen in Figure 5 and 6, their mean values are at around the 55oC and 35oC respectively. However both of them reflect noise parts. These noise parts can be interpreted as useful Sezai TAŞKIN, T. Çetin AKINCI, Serhat ŞEKER
6
7 x 10⁴
AN APPLICATION OF DENOISING BASED ON WAVELET TRANSFORM FOR TEMPERATURE SIGNALS OF THE ALTERNATORS IN A PASSENGER COACH
661
As a denoising method, threshold level can be determined as universal threshold which is
information in terms of the feature extraction. For this reason, as a first step, it can be considered their probability density functions. Section 4.1 contains the statistical interpretations of the data.
defined
by 2 log(.) .
Using
wavelet
transform for the denoising, main waveforms of the temperature variations can be separated from their noise parts. These separations can be shown by Fig. 9 and 10.
4.1 Statistical Interpretation The probability density functions of the temperature signals for alternator #1 and #2 are given as below figures,
Denoising of
t1
90 80
Time [s]
70
Histogram for Generator #1 12000
60 50 40 30
10000 Number of data
20 8000
10 0
1
2
3 4 Temperature [C]
5
6
6000
7 4 x 10
(a)
4000
2000
Noise of t1 15
0 0
10
20
30 Current [A]
40
50
60
10
Figure 7. Histogram for the temperature variation for alternator #1
Time [s]
5
Histogram for Generator #2 12000
0
-5 10000 Number of data
-10 8000
-15 0
1
2
3 4 Temperature [C]
6000
4000
5
6
7 4 x 10
(b)
2000
0 -10
0
10
20
30 40 Current [A]
50
60
70
Figure 9. Mean value (a) and noise part (b) of the temp. measurement for alternator #1
Figure 8. Histogram for the temperature variation for alternator #2
t2
50 45 Time [s]
From the above figures, it is seen that they have the non-Gaussian probability distributions. Considering these histograms it can be said that the statistical distributions show asymmetric distributions at around their mean values. In order to get the more statistical information by these data, denoising application is realized considering the wavelet transform.
Denoising of 55
40 35 30 25 20 0
1
4.2. Denoising by Wavelet Transform for temperature data of the alternator 1 and 2
Sezai TAŞKIN, T. Çetin AKINCI, Serhat ŞEKER
2
3 4 5 Temperature [C]
(a)
6
7 x 10⁴
AN APPLICATION OF DENOISING BASED ON WAVELET TRANSFORM FOR TEMPERATURE SIGNALS OF THE ALTERNATORS IN A PASSENGER COACH
662
Noise of
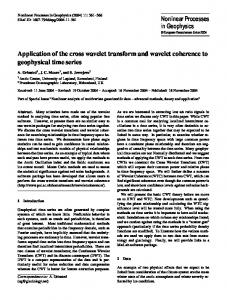
4.3. Coherence Calculations
t2
8 6
After the denoising procedure, coherence function is calculated between the denoised temperature signals of the alternator 1 and 2. Hence some peaks are indicated at the special frequency values to describe the physical behaviour of the alternators like load sharing of the alternators. This correlation, which is defined between the denoised signals in the frequency domain, is given by Fig. 12.
4
Time [s]
2 0 -2 -4 -6 -8 0
1
2
3 4 Temperature [C]
5
6
7 4 x 10
1
(b)
Coherences between (t1d)
& (t2d)
0.9
Figure 10. Mean value (a) and noise part (b) of the temp. measurement for alternator #2
0.8
Coherence
0.7
Using the noise parts of the separated signals, their probability distribution functions can be shown by Fig. 11.
0.6 0.5 0.4 0.3 0.2
Histogram for deltat1
4
x 10 2.5
0.1 0 0
0.1
Number of data
2
0.4
Figure 12. Coherence between the denoised temperature signals for alternator 1 and 2.
1.5
1
0.5
0 -15
-10
-5
0 5 Temperature [C]
10
15
(a) 2.5
Histogram for deltat2
x 104
2 Number of data
0.2 0.3 Frequency [Hz]
5. CONCLUSIONS and DISCUSSIONS
1.5
1
0.5
0 -8
According to the Fig. 12, if it is determined correlation levels at 0.4 of the coherence axis, most correlated peaks are seen between 0.05 and 0.15 Hz. This situation denotes that the side-band effects appear at around a central frequency value of 0.1 Hz with the frequency interval 0.05 Hz. As a result, the biggest peak is observed at 0.1 Hz with the coherence value of 0.7. This feature can be interpreted as having an equal-load sharing of the alternators in consideration of time.
-6
-4
-2 0 2 Temperature [C]
4
(b)
6
8
In this research, temperature measurements related to two alternators of a coach passenger are considered. Firstly, their noise parts are removed using the denoising method based upon the wavelet technique. Then, statistical properties are examined for these noise parts of the temperature signals. In this sense their statistical parameters are given by the following table.
Figure 11. Noise distributions: a) alternator #1 b) alternator #2
Sezai TAŞKIN, T. Çetin AKINCI, Serhat ŞEKER
0.5
AN APPLICATION OF DENOISING BASED ON WAVELET TRANSFORM FOR TEMPERATURE SIGNALS OF THE ALTERNATORS IN A PASSENGER COACH
663
Table 2. The Alternators Statistical Parameters Statistical Parameters for noise parts of alternator 1 and 2 Alternator-1 Alternator-2
Mean 0.0021 -0.0022
Standard deviation 3.3132 1.5018
Skewness
Kurtosis
0.1209 0.1088
4.0091 3.9790
[8] According to the results of the Table 2, the statistical parameters of the noise parts for the temperature variations are close to each other. Also, they have similar non-Gaussian characteristics by their similar statistical parameters. Under these statistical determinations, their histograms show almost symmetrical distribution as seen in Fig. 11 (a) and (b). After the denoising, in terms of the denoised signals, their coherence variations are considered and then, highly correlated peaks are determined for the denoised temperature signals at the 0.1± 0.05 Hz. Hence most correlated peak, which reveals at the coherence level of 0.7, can be used to describe the equal load sharing of the alternators in time domain. REFERENCES [1] Lee W., Sunwoo, M. “Vehicle Electric Power Simulator for Optimizing The Electric Charging System”, International Journal of Automotive Technology, Vol. 2, No. 4, pp. 157-164, 2001. [2] Henneberger, G., Kuppers, S., Ramesohl, I., “Numerical calculation, simulation and design optimization of claw pole alternators for automotive application”, Machines for Automotive Applications, 166, 1996.
Vaseghi, S.V., Advanced Signal Processing and Digital Noise Reduction, John Wiley & Sons Inc, 1996.
[9] Seker, S., Ayaz, E., “A reliability modelfor induction motor ball bearing degradation”, Electric Power Components and Systems, 31(7):639-652 JUL 2003 [10] Seker, S., “Determination of air-gap eccentricity in electric motors using coherence Analysis”, IEEE Power Engineering Review, V. 20,N. 7, p. 48-50, 2000. [11] Daubechies, I., “The Wavelet Transform, Time- Frequency Localization and Singnal Analysis”, IEEE Trans. On Information Theory, 36, 1990. [12] Goswami, J.C., Chan, A.K., Fundamentals of wavelets, theory, algorithms and applications, John Wiley and Sons, 1999. [13] Misiti, M., Misiti, Y., Oppenheim, G., Wavelet Toolbox For Use With Matlab User’s Guide, 2nd ed., The MathWork Inc., 1.1-1.38, 2000. [14] Stark, H.G., Wavelets and Signal Processing, Springer-Verlag Berlin Heidelberg, 2005
[3] Ferber, A., Alternators, Laboratory for Intelligent Mechanical Systems, Northwestern University, Lecture Notes, 2005. [4] Ferber, A., Stair Climber Alternator Analysis Summary, Northwestern University, Lecture Notes, 2005. [5] Temperature Measurement, http://www.yokogawa.com/ns/support/tips/nstips_05.htm, Oct. 2005 [6] Milewski, E. G., The Essentials of Statistics, Research and Education Association, 1996. [7] Taylor, J.K., Statistical Techniques for Data Analysis, Lewis Publishers, 1990. Sezai TAŞKIN, T. Çetin AKINCI, Serhat ŞEKER