EUSFLAT - LFA 2005
An approach to Color Gradient Vector Argument Considering Data Uncertainty
Santiago Romaní Pilar Sobrevilla Belén Prados-Suarez Eduard Montseny Computer Engineering and MAII Department Dept. of Computer Science ESAII Department Technical University of Mathematics Department University of Jaen Technical University of Rovira I Virgili University Catalonia Jaen, Spain Catalonia Tarragona, Spain Barcelona, Spain
[email protected] Barcelona, Spain
[email protected] [email protected]
Abstract Despite their shortcomings, gradient and second derivative operators remain popular as edge detectors because human beings usually do not show strong directional preferences when detecting edges or boundaries. However, in a colour image an edge can be given not only if the respective brightness values of two neighbouring pixels are significantly different, but also if their chromatic components are significantly different, even though their brightness values are very similar. So, it is important to consider changes in colour between neighbouring pixels for getting efficient colour-edge extraction algorithms. Unlike the gradient vector magnitude, the gradient vector argument has not been approximated. It has been in part due to the three dimensions used for defining colour feature. In this paper we present an approach to colour gradient vector argument approximation that considers the reliability indicators of the Smith’s Hue and Saturation components introduced in [13] for taking into account colour vagueness and variability problems on a HSI space Keywords: Gradient vector, color image processing, fuzzy sets.
1
Introduction
Edge detection is one of the most important tasks in image processing and machine vision systems, and is a critical preprocessing step towards high-level image knowledge and understanding. The process consists in detecting areas of abrupt changes or discontinuities in some visual property as light intensity, texture or color.
705
In grey-level images the usual approach is to simply define edges as step discontinuities in the illumination function. The classical way to detect and localize these discontinuities is the analysis of the derivative of the illumination function looking for local maximal or zero-crossings in the second derivative of the signal. This approach derived in some well known algorithms like those of Canny [1], Derich [2], and Marr and Hildreth [3], all of them based on the gradient vector and the second directional derivative analysis. For color images, the notion of an edge is much more complex than in grey scale images. Color segmentation algorithms are mostly direct applications of the early intensity gradient methods to individual primary color plane of an image. However, it is uncertain how the gradient map of each component can be integrated to construct the edge diagram. Since color images provide more information than grey valued ones, more detailed edge information is expected from color than from grey-scale edge detection. Edges in a color image can be produced by objects having the same (or similar) luminance but different chrominance information. Large color discontinuity may exist among the pixels, but only little difference in intensity value. To overcome this problem, the chrominance information present in color images must be taken into account. Some color edge detection and segmentation algorithms are based on the RGB color representation ([4], [5]). However, RGB representation does not coincide with the vision psychology of human eyes and there is high correlation among its three components. So, RGBbased approaches are not fully satisfactory because chromatic information is split into the three components. Other color spaces have been considered. So, in [6], Shafarenko et al. compared the vector gradient operator in several spaces. In [7] the vector gradient and the difference vector operators are evaluated in both, the RGB and the CIELUV color spaces. Lambert and Carron ([8]) examined the Sobel edge
EUSFLAT - LFA 2005
detector in HSI. Gevers and Smeulders [9] evaluated an eigenvector-based edge detection scheme on several physics-based color spaces. In [10] Wesolkowski compared the color adaptations of the Sobel, the Canny, the vector gradient, the modified Roberts and 3x3 difference vector operators in a multitude of color spaces with various color similarity measures: the Euclidean distance, the vector angle and combinations of both. Moreover, there is a growing interest in using fuzzy logic for image processing, due to their ability to represent imprecise information. Some fuzzy techniques have specially addressed the problem of segmentation and edge detection of color images ([4], [6], [11], and [12]). Here we present our proposal to approximate the argument of the color gradient vector that has into account color vagueness problems due to low Saturation and Intensity and makes use of fuzzy techniques for taking into account color vagueness and variability problems on a HSI space. The Paper is organized as follows. After introducing the considered color space, at section 3 we generalize the Sobel operators to compute the Hue and Saturation Sobel operators along the x and y directions. At next section the convolution
kernels to obtain de H-S Color Gradient vector argument. At section 5 we define the Fuzzy Color Gradient Vector Approximation considering the Hue and Saturation Reliability Functions introduced in [13]. Finally, in section 6, we present some results and give the conclusions.
2
Proposed Color Space
Color images are classically obtained by using the Red-Green-Blue (RGB) representation. However, as color is not an absolute characteristic of an object, but a human perception, color-order systems based on perceptual variables are more convenient for computer vision applications, as they are somehow correlated with human being’s color perception [14]. The Hue-Saturation-Intensity (HSI) color model was developed to put color terms easier for human to quantify [15]. Two principal factors make this model ideal for developing machine vision applications: decoupling the intensity component from the color information, and the close relationship between chromaticity and how humans perceive color. Among the available transformations that convert RGB components into perceptual ones, we will consider the Smith’s model [16] because besides its high independence among the three components it is easier and faster to compute than other non-linear models like Tenenmaum’s [17]. Hue and Saturation are the color features which provide the most useful basis for judging color
706
uniformity, being rather invariant to surface curvature and lighting conditions [18]. So, in this paper we regard color as a 2D+1D signal by decomposing it into its chromatic (H and S) and achromatic (I) components. However, variability of Hue and Saturation components is an important drawback for developing accurate color image edge extraction algorithms based on HSI spaces, because different colors can return similar color components values due to different illumination levels. For taking into account these problems we will consider the Hue and Saturation Stability Functions, [13], that provide the confident degree of the components values under any illumination level condition. Moreover, to cope with the problems due to the vagueness introduced by low saturation and intensity variability (shadows), we’ll make use of fuzzy techniques.
3 Gradient Vector Argument Approximation Gradient functions for color images may be basically defined in two ways, embedding in a single measure the variation of all three color channels, or computing the gradients of the single channels and combining them according to certain criteria. Because of we are considering separately the achromatic and chromatic components our proposal consists in considering by a hand the illumination gradient and, by other hand, defining a gradient for the chromatic components. So, to approximate the partial derivatives of the chromatic components’ gradient vector we will adapt the way of work used for calculating the illumination gradient vector. As it is known in image processing Prewitt and Sobel operators are commonly used for computing digital gradients. However, Sobel masks (Fig. 1-a and 1-b) have slightly superior noise-suppression characteristics, and it is possible to extend the use of this operator to define the Hue and Saturation Gradients through the corresponding Hue and Saturation Sobel operators along the x and y directions: ∂H/∂x, ∂S/∂x, ∂H/∂y, and ∂S/∂y. 3.1 Achromatic Gradient Vector Approximation In 2D, the Sobel operator uses two 3x3 kernels, kx and ky (Fig. 1-a and b), which are convolved with the intensity values of a 3x3 window of the source image, IA (Fig. 1-c), to produce a map of intensity gradients. -1 -2 -1
0 0 0 a)
1 2 1
kx
-1 0 1
-2 -1 0 0 2 1 b)
ky
I1 I8 I7
I2 I0 I6 c)
I3 I4 I5
IA
Figure 1: a) and b) Sobel operators. c) 3x3 Intensity window of the source image
EUSFLAT - LFA 2005
C2
The areas of highest gradient are where the intensity of the image changes rapidly over a few pixels, and are thus likely to represent edges. So, if we denote by IA a 3x3 window of the source image, we can compute the partial derivatives as:
P1 H1 C1 P H2 2
∂I/∂x = kx ∗ IA = I3 +2I4 +I5 – (I1 +2I8 +I7 )
(1)
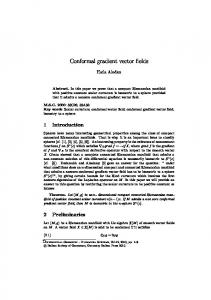
Figure 2: Hue circularity representation.
∂I/∂y = ky ∗ IA = I7 +2I6 +I5 – (I1 +2I2 +I3 )
(2)
For taking into account circularity restrictions we will consider next definitions:
These expressions are combined to obtain the overall magnitude and the gradient’s direction according to:
∇=
( ∂I ∂x )
2
( ∂y)
+ ∂I
2
or ∇ = ∂I
∂x
+ ∂I
⎛ ∂I ∂y ⎞ α = arctan ⎜ ⎟ ⎝ ∂I ∂x ⎠
∂y
(3) (4)
where α is perpendicular to the contour and so it is 0 for a vertical edge and increases for edges anticlockwise of this. 3.2
Chromatic First Order Derivatives
Now, we want to extend the previous process for obtaining the H and S first derivatives. Saturation First Order Derivatives If SA contains the Saturation values corresponding to a 3x3 window of the source image, centered at pixel (i, j), we can compute the Saturation partial derivatives, S x and S y , by: S x (i,j ) = S3 +2S4 +S5 - ( S1+2S8 +S7 ) S y (i,j ) = S7 +2S6 +S5 - ( S1+2S2 +S3 )
(5) (6)
Hue First Order Derivatives Similarly to the Saturation, in the case of the Hue component we can compute its partial derivatives, H x and H y , as follows: H x (i,j ) = H 3 +2H 4 +H 5 - ( H1+2H 8 +H7 ) H y (i,j ) = H7 +2H6 +H 5 - ( H1+2H 2 +H 3 )
(7) (8)
However, as we are aware of the Hue circularity, we must to face up the problem of calculate the Hue differences appearing within previous expressions. The effect of the Hue cyclic property observed representing the Hue component in a two dimensional space as shown in Fig.2, wherein the hue value of a point is given by the positive angle obtained starting from C1 axis and going counter clockwise along the unit circle to that point. So, the Hue difference of points P1 and P2 is H2−H1=21342=171. However, if we start from P1 and go clockwise along the circle to P2, the absolute value of the angle is ⎢−42−42⎪= 84, that is smaller because a shortcut has been taken.
707
Definition 1 The distance between two Hue values H1 and H2 is:
⎧ H − H2 if H 1 − H 2 ≤ 128 d ( H 1 ,H 2 )= ⎨ 1 − − 256 H H otherwise 1 2 ⎩ As previous definition satisfies the three axioms of distance the Hue Space is defined as the set of all the Hue values within [0,256), so d(H1, H2) is the length of the shorter arc between H1 and H2 and 0≤d ≤128. Definition 2 The directed distance between H1 and H2 is given by: ⎧⎪ H 2 - H 1 if H 2 - H 1 ≤ 128 r d ( H 1 ,H 2 )= ⎨ H 2 - H 1 - 256 if H 2 - H 1 > 128 ⎪⎩ H 2 - H 1 + 256 if H 2 - H 1 < −128
This directed distance will be considered to calculate the Hue partial derivatives given by Eqs. (7) and (8).
4 Chromatic Gradient Vector Argument Approximation Once we have approximated the Hue and Saturation partial derivatives, the next problem we must solve is how to approximate the color gradient vector argument. In our case, this problem has be reduced to the one of mixing the Hue and Saturation partial derivatives approximations in order to obtain either the Chromatic Partials Derivatives (ChPD), or some values proportional to them. The approach here proposed consists in considering that the high potential of the color gradient vector is given when the Hue and Saturation first derivatives approximations get the same values. So, the ChPDs, ΔCx (i, j ) and ΔC y (i, j ) , and the argument of the color gradient vector, are defined as follows: Definition 3 The ChPD of the pixel (i, j) along the x and y directions, ΔCx (i, j ) and ΔC y (i, j ), and the Argument of the Chromatic Gradient Vector,ΦCh, is given by:
ΔCx (i, j ) = k ⋅ Cx (i, j ); ΔC y (i, j ) = k ⋅ C y (i, j ) ΦCh = arctan Cx C y
(
)
(9) (10)
EUSFLAT - LFA 2005
Where Cx (i, j ) and C y (i, j ) are the projections of
Modified Saturation Deviation Values
( H x (i, j ),
As the reliability values aren’t constant, but depend on the color pixels values, the problem we have to face up to is how to obtain the modified Hue and Saturation deviation values of two given pixels, For obtaining the modified Saturation Deviation we must take into consideration that the Saturation Reliability Function depends on the Intensity value. So, if we go from pixel pi, to pixel pj, with saturation values Sj and Si, respectively, for getting their Saturation deviation each point/pixel within the way from pi to pj should be considered and multiplied by its Saturation reliability value. So, going to the limit, the modified Saturation deviation between these pixels could be approached as in expression 17. Moreover, as all the points are close points, for any given point p, within the way from pi to pj its Intensity (I) can be expressed as a function of its Saturation (S) according to Eq. 18.
S x (i, j ) ) and
(H
y (i,
j ), S y (i, j )
)
on the
straight lines H x =S x and H y =S y , respectively, i.e.: ⎧⎪ Cx (i, j ) = projH = S ( H x (i, j ), S x (i, j ) ) x x ⎨ C ( i, j ) = proj H x = S x H y (i, j ), S y (i, j ) ⎪⎩ x
(
)
(11)
4 Fuzzy Color Gradient Vector Argument Approximation
In a previous work, [13], after analyzing the behavior of Hue, Saturation, and Intensity with regard to Saturation changes and Intensity variability, we proved that it is also worth to consider it as a characteristic feature of a color. From this analysis we derived the Hue and Saturation Reliability Functions that allow predicting the expected reliability of the Smith’s H-S data for any color pixel. So, if Hxy, Sxy, and Ixy are the component values of a pixel pxy, its Hue and Saturation Reliability values (Eqs. 12 and 13) provide the degree to which we can be confident of the component pixel values. ⎛ S xy ⋅ I xy ⎞ RH ( H xy , S xy , I xy ) = Min ⎜1, ⎟ ⎝ 20000 ⎠ ⎛ 2 ⋅ I xy ⎞ RS ( H xy , S xy , I xy ) = Min ⎜ 1, ⎟ ⎝ 500 ⎠
(12) (13)
Taking into consideration the vagueness of color information and the meaning of the reliability values of a pixel, we have included these values within the Color Partial Derivatives approximations, and therefore in the Color Gradient Argument definition. 4.1
Fuzzy Color Partial Derivatives
The Saturation and Hue partial derivatives approximations (Eqs. 5 to 8) can be rewritten in terms of the deviation values by: S x (i,j ) = Δ13 S + 2Δ84 S + Δ75 S ⎫⎪ ⎬ S y (i,j ) =Δ71 S + 2Δ62 S + Δ35 S ⎪⎭
(14)
H x (i,j ) =Δ13 H+2Δ48 H+Δ75 H ⎫⎪ ⎬ H y (i,j ) =Δ71 H+2Δ62 H+Δ35 H ⎪⎭
(15)
Sj
j i
Si
i
(17)
S
i
j
)
− Si ) ⋅ ( I j − Ii )
and Δij S , by the modified ones: (16)
708
(18)
Modified Hue Deviation Values As depicted in Eq. 12, the Hue Reliability value of a pixel is a function of its Intensity and Saturation values. So, following the same process than in the case of the Saturation Deviation, if we go from pixel pi to pixel pj, whose saturation and intensity values are (Si, Ii) and (Sj, Ij) respectively, the modified Hue deviation between these pixels could be approached as in expression 19. Considering that for any given pixel p within the way from pi to pj its Intensity (I) and Saturation (S) can be expressed as in Eq. 20 and 21, respectively, these expressions will be substituted within Eq. 19 for obtaining the modified Hue deviation values.
( Δ H )' ≅ ∫ R dH I = I + ((H − H ) (H Hj
j i
Hi
i
(19)
H
i
j
)
− H i ) ⋅ ( I j − Ii )
S = S1 + ( ( H − H1 ) ( H 2 − H1 ) ) ⋅ ( S2 − S1 )
So, we introduce the reliability values within the partial derivatives approximation obtaining substituting the Hue and Saturation deviations, Δij H
(Δij H )' = Δij H ⋅ RH ; (Δij S )' = Δij S ⋅ RS
( Δ S )' ≅ ∫ R dS I = I + ( (S − S ) (S
5
(20)
(21)
Results and Conclusions
The proposed color gradient vector argument approach has been applied over sixty-three bone marrow microscopic images taken from a data base collected at the Ellis Fischel Cancer Center of the University of Columbia-Missouri using an Olympus BX50 microscope, a B/W CCD camera, and a digitizer (8 bits/pixel, PDI IMAXX). We have considered these images because within them appear
EUSFLAT - LFA 2005
white and red cells that have circular or elliptical shapes, which is very convenient to prove the effectiveness of our approach. The results obtained after applying the proposed algorithm to one of these smear images (Fig. 3-a) are shown in Fig. 3-b and 3-c.
a)
b)
c)
Figure 3: a) Original image; b) representation of the gradient vector arguments; c) amplification of the results obtained for a particular white blood cell. Within images 3-b and 3-c the grey levels are proportional to the angle of the gradient vector, so the grey levels 0 and 1 correspond to 0 and [255, 360] degrees respectively. Moreover, as the white is a very few saturated color (background), the gradient vector argument will go always from the contour to the cell center. So, having a look at images 3-b and 3-c, and taken into consideration that the origin of coordinates is at the top-left corner, it can be observed that, as should be expected, the dark color appears at the left hand of the contour what corresponds to a orientation of 0-degrees. If we move clockwise from this point, it can be appreciated that the grey-level goes lighter till we arrive to the left- down cell contour, wherein there is a frontier between the grey-levels 0 and 255 that match with 0 and 360 degrees respectively.
References [1] J. Canny, “A computational appraoch to edge detection”, PAMI, vol. 8, 1986, pp. 679–698. [2] R. Deriche, “Using Canny's Criteria to Derive a Recursive Implemented Optimal Edge Detector”, Int. Jour. of Comp. Vision, vol.1, 1987, pp. 167-187. [3] D. C. Marr, E. Hildreth, “Theory of Edge Detection”, Proc. of the Royal Society of London, Series B, vol. 207, 1980.
709
[4] A. Mohaddamzadeh, N. Bourbakis, “A fuzzy region growing approach for segmentation of color images”, Pattern Recognition, vol.30, no 6, 1997, pp. 867-881. [5] S.Y. Zhu, K. N. Plataniotis, and A. N. Venetsanopoulos, “Comprehensive analysis of edge detection in color image processing”, Optical Engin., vol. 38, no 4, 1999, pp. 612-625. [6] L. Shafarenko, M. Petrou, J. Kittler, “Automatic watershed segmentation of randomly textured color images,” IEEE Trans. on Image Process., vol. 6, 1997, pp. 1530-1544. [7] S. Wesolkowski, M.E. Jernigan, “Color Edge Detection in RGB Using Jointly Euclidean Distance and Vector Angle,” IAPR Proceedings of Vision Infedace, 1999, pp. 1-9. [8] P. Lambert, T. Carron, “Symbolic fusion of luminance-hue-chroma features for region segmentation”, Pattern Recognition, vol.32, 1999, pp. 1857-1872. [9] T. Gevers, A.W.M. Smeulders, “ReflectanceBased Edge Classification,” MPR Proc. of Vision Interface, 1999, pp. 25-32. [10] S . Wesolkowski, “Color Image Edge Detection and Segmentation: A Comparison of the Vector Angle and the Euclidean Distance Color Similarity Measures,” Master’s thesis, University of Waterloo, Canada, 1999. [11] F. Russo, A. Lazzari, “Fuzzy Models for Color Edge Detection in Impulse Noise”, VIMS 2002, pp. 93-98. [14] Chi Zhang, P. Wang, “A New Method of Color Image Segmentation Based on Intensity and Hue Clustering”, 2002. [13] S. Romani, E. Montseny, P. Sobrevilla. “Obtaining the Relevant Colors of an image through Stability-based Fuzzy Color Histograms” Proc. IEEE Conference on Fuzzy Systems. 2003, pp 914-919. [14] A.R. Robertson, Color Perception. Physics Today, 1992, pp. 24-29. [15] G. Wyszecki, W.S. Stiles, Color science, concepts and methods, quatitative data and formulas. John Wiley and Sons, 1967. [16] A.R. Smith, “Color gamut transform pairs,” Computer Graphics 12, 1978, pp. 12-19. [17] J.N. Tenenbaum, “An interactive facility for scene analysis research,” Technical Note 87, Artificial Intelligence Center, Stanford Research Institute, 1974. [18] R.W.G. Hunt, “The Reproduction of Colour”, 5th Ed., Fountain Press, Kingstone-uponThames, U.K. 1995.