Article
An Architectural Based Framework for the Distributed Collection, Analysis and Query from Inhomogeneous Time Series Data Sets and Wearables for Biofeedback Applications James Lee 1,* David Rowlands 2, Nicholas Jackson 2, Raymond Leadbetter 2, Tomohito Wada 3 and Daniel A. James 2,4, Physiolytics Laboratory, School of Psychological and Clinical Sciences, Charles Darwin University, Ellengowan Drive, Casuarina, NT 0810, Australia;
[email protected] 2 Sport and Biomedical Engineering Laboratories (SABEL), Griffith University, Nathan Campus, 170 Kessels Road, Nathan, QLD 4111, Australia;
[email protected] (D.R.);
[email protected] (N.J.);
[email protected] (R.L.);
[email protected] (D.A.J.) 3 Information Technology Center for Sports Sciences, National Institute of Fitness and Sports, Kanoya 891-2393, Japan;
[email protected] (T.W.) 4 Centre of Excellence for Applied Sport Science Research, Queensland Academy of Sport, Queensland Sport and Athletics Centre, Kessels Road, Nathan, QLD 4111, Australia * Correspondence:
[email protected]; Tel.: +61-889-46-6716 1
Academic Editor: Olga C. Santos Received: 30 May 2016; Accepted: 20 January 2017; Published: 1 February 2017
Abstract: The increasing professionalism of sports persons and desire of consumers to imitate this has led to an increased metrification of sport. This has been driven in no small part by the widespread availability of comparatively cheap assessment technologies and, more recently, wearable technologies. Historically, whilst these have produced large data sets, often only the most rudimentary analysis has taken place (Wisbey et al in: “Quantifying movement demands of AFL football using GPS tracking”). This paucity of analysis is due in no small part to the challenges of analysing large sets of data that are often from disparate data sources to glean useful key performance indicators, which has been a largely a labour intensive process. This paper presents a framework that can be cloud based for the gathering, storing and algorithmic interpretation of large and inhomogeneous time series data sets. The framework is architecture based and technology agnostic in the data sources it can gather, and presents a model for multi set analysis for inter- and intra- devices and individual subject matter. A sample implementation demonstrates the utility of the framework for sports performance data collected from distributed inertial sensors in the sport of swimming. Keywords: Python; data science; cloud computing; MATLAB; feedback
1. Introduction The sports community is an acknowledged early adopter of technologies for the quantification of movement demands of athletes such as inertial sensors [1]. Typically large datasets are produced by such devices. However until recently, it was often the case that only basic analysis was performed [2]. This data has often been used to augment typical methods of data capture in specialist sports laboratories that often are restrictive in allowing activities to be assessed—for example, reduction in range of motion of joints by equipment cabling, or can only capture small Algorithms 2017, 10, 23; doi:10.3390/a10010023
www.mdpi.com/journal/algorithms
Algorithms 2017, 10, 23
2 of 14
volumes of data such as limited gait kinematics by a 3D motion analysis system capture volume. This wearable technology adoption is driven by the desire to improve sporting performance outcomes through technique, training, performance analysis and injury prevention and mitigation through workload assessment [3]. To accomplish this, the sports community use a range of technologies for movement analysis [4] that typically produce time series data. These include 3D motion capture systems, 2D video, force plates, heart rate and electromyography data, and, more recently, ambulatory body worn sensors (such as inertial sensors) and even smart phones [5]. These have been combined in applications as diverse as gait studies [6], swimming monitoring [7] and bowling action in cricket [8]. As stand alones, these instruments have proven to be able to provide effective feedback for interventions to improve sporting outcomes. However, with the rise of connectedness, there is a desire and need to integrate these more efficiently than through labour intensive methods [9]. The value of feedback of performance and biomechanics data to both coaches and athletes is fundamental to the learning process. This information can come from sporting periods such as: intra session, inter session, seasonal, years, and multiple athletes/teams as an aid to learning [10]. To gain competitive advantages, individuals or teams have inherently required greater detail or information. To meet this ongoing demand necessitates moving from single small data sets to large multimodal data from various sources ranging from wearables to laboratory equipment and video for effective intervention. The growth in this demand is evidenced by the 30+ year paralleled expansion in sport science professional recruitment as supporting staff as well as the world wide establishment of government backed institutes of sport in part to facilitate the increased need to analyse the larger volumes of data in order to gain or maintain a competitive edge. Such initiatives are on the rise in many disciplines including: health domains [11], expertise and topologies from collaboration type tools [12] and innovation in programming methodologies [13]. These examples are useful points of reference to consider for technological uptake that have similar purposes for different applications. This paper presents a multidisciplinary approach grounded in feedback from wearables fused with various sources that will be presented in the remainder of this document. Therefore, the contained information has been arranged to present a basic architecture based framework along with a cloud based application, together with a sample implementation using commonly available tools and a high performance computation environment, specifically, MATLAB (version 7.11.0.584 (R2010b), The MathWorks, MA, USA). The development of a framework for fusing wearables and other data sources requires an intimate knowledge of the application area needs, thus listening to the demand pull rather than pushing particular technologies at a predetermined solution was critical. We adopted a user centric needs analysis [14] approach where the current and future needs of typical deployment scenarios were considered from existing research and consultancy relationships. From this, their test sites for deployment and their data needs were considered (Table 1). Table 1. Sample deployment sites.
Site 1: Wearable Technology Enterprise Data Source
Description
Inertial sensor 9 DoF inertial (SABEL Sense) sensors 3D Motion Capture (Vicon, 20 markers Oxford, UK) [15] * 2D Video Data (Panasonic 50 Hz HD video HC-V759M) [15] * Site 2: Sports Teaching and Research Lab Inertial sensor 4 × 9 DoF inertial (SABEL Sense) [9] * sensors
Sample Bandwidth
Interpretation
9 × (25–250) Hz
Extensive data processing
20 × 50 Hz
Conversion from gait model to frame of reference data
45 Mbps
For visual comparison
36 × 100 Hz
Data processing for swimming analysis
Algorithms 2017, 10, 23
2D Video data (GoPro San Mateo, CA, USA) [9] * Inertial sensor (SABEL Sense) [16] * 3D Motion Capture (Optitrack, Corvallis, OR, USA) [16] * 2D Video Data (Panasonic HC-V759M) [16] * Inertial Sensor (SABEL Sense) [17] * 3D Motion Capture (Vicon) [17] *
3 of 14
25 Hz HD underwater video 8 × 9 DoF inertial sensors
12 Mbps 72 × 100 Hz
Visual comparison for temporal kinematic measures Data processing for vertebra analysis during lifting
6× markers
6 × 100 Hz
Marker positional change for frame of reference data
25 Hz HD video
12 Mbps
Visual comparison
1 × 9 DoF inertial sensors
9 × 100 Hz
Helen Hayes marker model
19 × 100 Hz
2 Plate Force Platform 8 × 3 DoF (Bertec, Fairfax, VA, piezoelectric USA) [17] * load cells Site 3: National Sports Institute [18] Force Platform under Composed 6-axis Athletics Track (Tec force sensors Gihan, Kyoto, Japan) 3D Motion Capture 16 infrared (Motion Analysis Co, cameras Santa Rosa, CA, USA) Object Tracking System Wireless object (ChyronHego Co, New tracking system York, NY, USA) Force Platform for 13 × 6-axis force Baseball Mount and plates Batter’s Box (Tec Gihan) High Speed Cameras (NAC Image Technology, 500 Hz HD video Tokyo, Japan)
Data processing for gait analysis Conversion from lower body model to frame of reference data
8 × 100 Hz–500 Hz
Orthogonal force production data
6 × 1 k–5 kHz
Conversion to power output, distance, speed, velocity
3 × 16 markers × 250 Hz (32 markers/subject) 30 players × 11 items × 20 Hz 13 × 6 × 1–5 kHz 1920 × 1080 pixels × 500 Hz
Calculation from 3d data to distance, velocity, angle, acceleration, COM, etc. To measure speed, distance, HR, trajectory, heading direction To analyse reaction force, movement of COP, time differences between players For visual analysis and confirmation
* Cited research.
2.1. Homogenenous Datastructure for Inhomogenous Datasets One of the largest challenges for the development of the data management system was the ability to store, index and modify multiple data streams, without exhaustive development cycles for adaptive processing of inhomogeneous data sources. Specifically, inhomogeneous data are sourced from different technologies that require processing to provide evidence of a specific outcome, typically, in this case, kinematic measures. This required additional development time in producing a data structure that was abstract enough to accommodate various sensor types and data formats, with enough specificity to ensure appropriate indexing. Previous work has been made on the development of the ADAT Toolbox (Version 1.0., SABEL Laboratories, Brisbane, Australia) [19], a toolbox designed for the storage and processing of time-series based inertial data of elite athletes for post-process cognitive feedback. Development as part of the Toolbox, in a MATLAB data structure was produced to provide sensory information and data source associated metadata for a single sensory input. Limitations of the existing structure in the context of distributed collections of inhomogeneous data sources meant that the structure could only retain context into a singular time-series data source, for example, a single inertial sensor. However, due to the primary objective
Algorithms 2017, 10, 23
4 of 14
being the process of providing a unified platform for the distributed collection of varying datasets, modifications were required to accommodate the disconnect in various collection methods. The process of redevelopment and extension of the existing structure presented with additional challenges for extension to distributed implementation. A unique requirement was generated for the distributed implementation of the structure. Allowing a generalised interface to be constructed between multiple differentiating platforms with common data source interfaces. The Athdata structure was used as a central communication tool between the logical layers of data collection, storage, processing and feedback to users for intended purposes, e.g., motor learning applications, be they near real-time or for post processing intervention. This was initially determined by detailed user requirement analysis for the sport of swimming [20]. The functional blocks consisted of data sources, data transport, staging/transformation, storage, analysis and retrieval. Existing development on the Athdata structure saw the use of the MATLAB data science environment as the primary platform of implementation. However, this provided limitations in the development of a distributed collection and management of inhomogeneous data sources, particular with MATLAB specific data structures. Primary focus for the redevelopment and the extension of the structure required the ability for primary data types, generic in implementation to accommodate various implementation methods for collections of disjointed data, which was undertaken in Unified Modelling Language (UML). The UML representation of the improved structure used for the implementation (Figure 1). This was extended to a cloud based system. The major challenge for the development of the structure was to provide the ability to have sessional context of a data source in relation to varying inhomogeneous data sources. From an implementation perspective, a major challenge was generated from the requirements for the existing MATLAB structure to be implemented in standard data types, for example, by allowing implementation in an SQL database backend. Thus, the updated implementation was intended to be provided as a specification of implementation, rather than an implementation method perse. The use of MATLAB was considered advantageous on balance, despite being a proprietary technology, as it was a common tool across the deployment sites. The majority of the existing structure remains in the updated implementation with key elements included to satisfy the requirements of data source context in relation to distributed inhomogeneous data sources. Included in the structure, session information provided indexing for session context of the data source specific to both the sensor, and the context for the whole session of a collection of sensors. For example, the context of a sensor includes the definition of spatial placement in relation to the testing subject, such as the placement on the human body. Modifications to the “sensor” structure were made to ensure that the update structure was inclusive of varying data source collection methods, moving away from specific device structures. The majority of modifications made to the athlete data (Athdata) structure saw the inclusion of two additional structures referred to as “Metadata” and “Segments” (Figure 1). Both were developed to provide indexing interfaces of inhomogeneous data sources. Therefore, allowing the ability to associate searchable references to metadata tags in the context of a whole session, dataset and specific regions of time series data. 2.2. Framework for the Aggregation and Visualisation of Inhomogeneous Data Sources Initial requirements for the system revolved around the primary objective for the implementation of a common interface for the storage, collection and modification of inhomogeneous data sources. Generated from the requirements, several phases of the system were developed as a high level abstract framework for the system, visually represented in the context of the system framework (Figure 2). The framework consisted of the following high level data components, sources, transport, staging and transformation, data storage, analysis and retrieval and visualisation. Because of the time-dependent nature of feedback, the efficient handling and flow of time series data was critical. In all applications, data transport required the processing of moving data from specific data sources, both from operators manually uploading or automatic transport from
Algorithms 2017, 10, 23
5 of 14
wearable devices through modern internet based protocols e.g., IPv6. Transformation includes the process of taking various distributed inhomogeneous data sources and compiling them into a converging uniform data structure—therefore, allowing the ability for autonomous and operator based metadata indexing for future processing. Storage provides an interface for the long-term storage and retrieval of indexed data sources including the file storage of archived original data sources and exported transformed data structures. Analysis includes the ability for the system to provide interfaces for the processing of transformed and indexed data sources. This allows for the retrieval of cached indexed homogeneous data structured through exported data sources as well as system visualisation and aggregation through integrated layers (Figure 2).
Figure 1. Unified Modelling Language (UML) top-down depiction of the revision for athlete homogeneous wearable sensor data structure.
Algorithms 2017, 10, 23
6 of 14
Figure 2. Visualisation of a typical user workflow and application for aggregation of inhomogeneous datasets.
The framework was developed using open source tools with platform independence and scalability as important factors. Initially implemented on a single workstation, a browser based interface was seen as desirable because of its platform independence and scalability to multi workstation and cloud based functionality [21]. It was considered that using open source enables resources that improve system development and reduce development time and dependency on proprietary systems. Java and in particular Node.JS [22] was selected due to its available packages, wide community and could be used both client and server side. It is reasonably portable and has favourable development times. Whilst legacy code exists within MATLAB, implementation in Python scripting language was seen as favourable because of similar processing power, popularity with the data sciences community in similar applications [23] and its backward compatibility with the data structures. 2.3. System Framework The developed system was modelled closely following a service-orientated framework—by which, each module is developed as a micro-service application that plays a specific and detected role within the cloud system stack—abstracted to four primary modules, formally named, Data Process Queue, Data Management Frontend, Data Management Backend and the Web Proxy (Figure 3). The Data Management Front micro-service handles all HTTP proxy traffic directed by the Web Proxy through a public SSL (Secure Socket Layer) pipeline, rendering the static frontend HTML application for system interaction by the user. The Data Management Backend was implemented to handle the process of storing all inhomogeneous data sources conformed to the revised data structure. The Data Management Backend also provides an Application Program Interface (API) to the stored and index data sources. Finally, the Data Process Queue was implemented to handle aggregation of varying inhomogeneous data sources, conforming the data sources to a single uniform Athdata structure to be stored within the backend. The Process Queue also provides visualisation functionality with real-time rendering of time series datasets, allowing the collaboration of operators for processing of distributed data sources.
Algorithms 2017, 10, 23
7 of 14
Figure 3. Visualisation of a typical user workflow and application for aggregation of inhomogeneous datasets in the context of system stack interaction.
2.4. User Interface and User Workflow Ensuring success of the platform requires strenuous detail applied to the user interface to allow seamless collaborative workflow allowing rapid and easy user adoption. The primary incentive into the development of the user interface was to provide a simple and easy to use interface with minimal start up time for new user bases. Figure 4 illustrates the user workflow for the typical use case scenario of generating new sessions and migrating existing session information. With the seamless integration of session creation with existing data source migration, rapid user adaption can be achieved.
Figure 4. Illustration of a typical user workflow and application for aggregation of inhomogeneous datasets.
Algorithms 2017, 10, 23
8 of 14
The primary objective was to provide a collaborative and highly socialised platform for continuous, distributed and seamless integration for research and high performance sport environments with multiple members. With focus on operator centric development, providing the ability for multiple operators at varying access levels to collaborate, process, index and export various supported datasets. Providing functionality for indexing and searching raw datasets, as well as collaborative data processing, forms a repository of existing work. Once an operator has been granted access to the system, either through self-registration or registration via a lab manager, the operator is presented with a list of sessions. The encapsulation of a session is considered an experiment, allowing an operator to register various data sources encapsulated as datasets for a created session (Figure 5a). An operator is provided with the means of registering additional metadata to both session information and specific datasets. The operator can associate any supported data source as a dataset, which is provided as a basis for further data processing and collaboration with other operators. The operator with administrative privileges of a dataset has the ability to search for operators and assign various access levels for a defined session. Key features for the platform were the ability to index and search inhomogeneous data structures from various data sources for a defined captured session. The primary method for indexing includes assigned tags to various components of a session. This includes the ability for operators to assign tags to sessions, datasets and various index regions of time-series data, referred to as events. Searchable indexes into specific areas of time-series data allow operators to store information for later processing, allowing collaborative data analysis with multiple operators (Figure 5b). Any operator assigned to a session has the ability to export datasets in various formats, including archived versions of the original uploaded file, and homogenously structured data conformed to the previous discussed structure in a variety of languages (Figure 5c) in addition to universal standardised formats such as JavaScript Object Notation (JSON) for currently non-supported languages. A key requirement of the system is the migration process of the users for importing existing datasets to the new collaborative cloud based system. Major challenges for the design and implementation for the import functionality was the incentive of users to fill out information in a convenient and efficient manner. This was resolved by the segmentation of information required through an “import wizard”, allowing users to stage multiple datasets efficiently through an iterative process.
Algorithms 2017, 10, 23
9 of 14
(a)
(b)
Algorithms 2017, 10, 23
10 of 14
(c) Figure 5. (a) Operator uploading several data sources for a newly created session; (b) operator session with six data sources shared with multiple operators; and (c) detailed dataset information with time-series dataset rendering.
Algorithms 2017, 10, 23
11 of 14
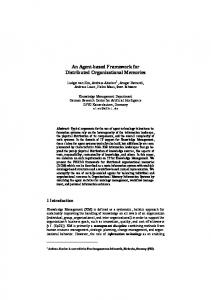
2.5. System Implementation The implementation of the cloud based system following the implementation of a service orientated framework was isolated to the three primary components including the frontend application server for a web based application. The backend API server that provided interfaces to processed data. In addition, the Python data processing server that provided interfaces to batch processing on inhomogeneous time-series based data sources. The development of the cloud application stack presented unique challenges for the imp. The frontend of the system handles all browser based user interaction and was implemented using open source tools. These included using the Node.JS express web framework and presents a single page application to the user. The backend provides data management and storage functionality. It is implemented using Node.JS and a Restify API to link to a relation database. User security is also provided by the backend with token authentication. The data processing server handles the staging, transformation, analysis and visualisation processing of the data. It was implemented using Python and the Flask web framework. The processing of data is handled by the data science module SciPy, managed by a Celery task queue. 3. Sample Application A key advantage of the framework is the ability for a number of researchers to access shared data capture from multiple data sources for subsequent analyses. In this sample application, the test data set was from six inertial sensors per participant (n = 12) doing six sessions each with video data segments. Specific details of the study’s purpose including researcher and participant obligations were given, and, after agreeing to participate, volunteers signed the associated institute’s ethical committee approved informed consent form (ENG/05/10/HREC). Each session involved a two-lap swim of a 25 metre swimming pool. This large amount of data would be difficult to distribute and search if it were stored as flat files. Using the developed framework, the data capture can be indexed and becomes accessible to any researcher it is shared with. The indexed metadata is also searchable, providing easy access to sessions and data relevant to a current area of interest. Analysis of data is typically performed using standalone tools either commercially available or written in-house. An example of one of these tools is the SABEL data analysis tool [23], which was applied to one of the swimmers in the data capture set (Figure 6). This tool enables the time series inertial sensor data to be synchronised to video data, thereby giving the data context. The data can then be analysed to find key patterns or events to be used in specific algorithm development. To illustrate the concept, one of the swimmer’s from the data capture was used to visualise the body roll when swimming a single lap of freestyle. The body roll is defined as the clockwise and anti-clockwise roll of the body whilst the arms are performing the strokes. The aim for the athlete is to be as consistent as possible in the strokes to minimise extraneous effort such as profile drag. This, in turn, means that the body roll will also be consistent. The sensor unit was located on the sacrum of the swimmer and the gyroscope channel examined aligned to the direction of the spine. The data was initially examined using the tool displayed in Figure 6. The state-space diagram with a delay of three was generated using the method detailed in Rowlands et al. [24] (Figure 7). The maximum and minimum roll velocities of the body during the left and right arm stroke actions are given at the extents of the diagram. It can be seen that, by examining the contours at the extents of the diagram, the action is asymmetric with variability that changes over time. The coach can then use this information to provide feedback to the swimmer.
Algorithms 2017, 10, 23
12 of 14
Figure 6. SABEL data analysis with synchronised inertial sensor data and video.
Figure 7. State-Space Based Visualisation technique demonstrating the consistency of the strokes using the body roll.
4. Conclusions Development of the application framework targeted development options specific to time series sport data to limit project scope and restricted available resources to sports biomechanical feedback applications. The majority of application design focused on providing the ability for the inclusion of varying system architectures and physical system resources within the framework. Allowing continuing expansion of hardware allocation from a single multicore machine to an array of high performance servers provides sufficient flexibility to scale and for tailored customisation. The development of a cloud based inhomogeneous time series framework has been designed to allow the push forward and adoption of varying systems in a collaborative but also a decentralised
Algorithms 2017, 10, 23
13 of 14
manner of distributed data collection, moving away from the sole reliance on a proprietary platform to a larger open standardised platform within the data science community. Access to the data stored would enable the generation of algorithms based upon the activity performed. The results from the algorithms could then be presented to the appropriate stakeholders in the most meaningful form for them e.g., customised visualisation. These stakeholders would initially be research based. However, it is not intended to remain solely as a research focus tool, with the ultimate aim for greater application design for use in the public realm with developments for general users. Continued development for the open standardised platform will require the seamless ability for data aggregation of wearable sensors through modern network protocols—moving from dedicated desktop applications to cloud based data management and analysis tools and allowing wearable sensors to push data to the cloud platform for real-time bio-feedback analysis of athletes. Future development would also see the expansion and support for additional data sources, in order to meet the future adoption trends of wearables in sports science, thus providing a greater ecosystem for traditionally non-supported hardware, data formats and emergent applications. Acknowledgements: The authors wish to acknowledge all participants and volunteers associated with the various projects referred to here. Without their generosity, much of this research would have been difficult. Author Contributions: A multidisciplinary project across three institutions this paper and associated project was the co-creation of multiple skills and skillsets. J.L contributed to writing, user perspective and the application environment; D.R. was responsible for technical supervision and test bed application; N.J. contributed to writing and technical development implementation; R.L. was responsible for implementation; T.W. handled user perspective and application environment; and D.A.J. contributed to manuscript concept, framework and visualization. All authors have read and approved the final manuscript. Conflicts of Interest: The authors declare no conflicts of interest.
References 1. 2. 3.
4. 5. 6.
7. 8. 9. 10. 11.
James, D.A. The application of inertial sensors in elite sports monitoring. In The Engineering of Sport 6; Springer: New York, NY, USA, 2006; pp. 289–294. Wisbey, B.; Montgomery, P.G.; Pyne, D.B.; Rattray, B. Quantifying movement demands of AFL football using GPS tracking. J. Sci. Med. Sport 2010, 13, 531–536. Neville, J.; Wixted, A.; Rowlands, D.; James, D. Accelerometers: An underutilized resource in sports monitoring. In Proceeding of the 2010 Sixth International Conference on Intelligent Sensors, Sensor Networks and Information Processing (ISSNIP), Brisbane, Australia, 7–10 December 2010; pp. 287–290. Cutmore, T.R.; James, D.A. Sensors and sensor systems for psychophysiological monitoring: A review of current trends. J. Psychophysiol. 2007, 21, 51–71. McNab, T.; James, D.A.; Rowlands, D. iPhone sensor platforms: Applications to sports monitoring. Proc. Eng. 2011, 13, 507–512. Wixted, A.J.; Billing, D.C.; James, D.A. Validation of trunk mounted inertial sensors for analysing running biomechanics under field conditions, using synchronously collected foot contact data. Sports Eng. 2010, 12, 207–212. Stamm, A.; James, D.A.; Thiel, D.V. Velocity profiling using inertial sensors for freestyle swimming. Sports Eng. 2013, 16, 1–11. Spratford, W.; Portus, M.; Wixted, A.; Leadbetter, R.; James, D.A. Peak outward acceleration and ball release in cricket. J. Sport Sci. 2015, 33, 754–760. Lee, J.B.; Ohgi, Y.; James, D.A. Sensor fusion: Let’s enhance the performance of performance enhancement. Proc. Eng. 2012, 34, 795–800. Ride, J.; Ringuet, C.; Rowlands, D.; Lee, J.; James, D. A sports technology needs assessment for performance monitoring in swimming. Proc. Eng. 2013, 60, 442–447. Deng, Z.; Yang, P.; Zhao, Y.; Zhao, X.; Dong, F. Life-Logging Data Aggregation Solution for Interdisciplinary Healthcare Research and Collaboration. In Proceedings of the 2015 IEEE International Conference on Computer and Information Technology; Ubiquitous Computing and Communications; Dependable, Autonomic and Secure Computing; Pervasive Intelligence and Computing (CIT/IUCC/DASC/PICOM), Liverpool, UK, 26–28 October 2015; pp. 2315–2320.
Algorithms 2017, 10, 23
12.
13.
14. 15. 16. 17. 18. 19. 20. 21. 22. 23. 24.
14 of 14
McGregor, A.; Bennett, D.; Majumdar, S.; Nandy, B.; Melendez, J.O.; St-Hilaire, M.; Lau, D.; Liu, J. A Cloud-Based Platform for Supporting Research Collaboration. In Proceedings of the 2015 IEEE 8th International Conference on Cloud Computing, New York, NY, USA, 27 June–2 July 2015; pp. 1107–1110. Kambona, K.; Boix, E.G.; De Meuter, W. An Evaluation of Reactive Programming and Promises for Structuring Collaborative Web Applications. In Proceedings of the 7th Workshop on Dynamic Languages and Applications, New York, NY, USA, 1 July 2013; doi:10.1145/2489798.2489802. Ringuet-Riot, C.J.; Hahn, A.; James, D.A. A structured approach for technology innovation in sport. Sports Technol. 2013, 6, 137–149. Winter, S.C.; Lee, J.B.; Leadbetter, R.I.; Gordon, S.J. Validation of a single inertial sensor for measuring running kinematics overground during a prolonged run. J. Fit. Res. 2016, 5, 14–23. Gleadhill, S.; Lee, J.B.; James, D.A. The development and validation of using inertial sensors to monitor postural change in resistance exercise. J. Biomech. 2016, 49, 1259–1263. Espinosa, H.G.; Lee, J.B.; Keogh, J.; Grigg, J.; James, D.A. On the use of inertial sensors in educational engagement activities. Proc. Eng. 2015, 1, 262–266. The Sports Performance Laboratory, National Institute of Fitness and Sports, Kanoya, Japan. http://splab.nifs-k.ac.jp/function/ or http://splab.nifs-k.ac.jp/ (accessed on 30 January 2017). James, D.A.; Wixted, A. ADAT: A Matlab toolbox for handling time series athlete performance data. Proc. Eng. 2011, 13, 451–456. Ride, J.R.; James, D.A.; Lee, J.B.; Rowlands, D.D. A distributed architecture for storing and processing multi channel multi-sensor athlete performance data. Proc. Eng. 2012, 34, 403–408. Tilkov, S.; Vinoski, S. Node. js: Using JavaScript to build high-performance network programs. IEEE Internet Comp. 2010, 14, 80. Demšar, J.; Curk, T.; Erjavec, A.; Gorup, Č.; Hočevar, T.; Milutinovič, M.; Možina, M.; Polajnar, M.; Toplak, M.; Starič, A.; et al. Orange: Data mining toolbox in Python. J. Mach Lng. Res. 2013, 14, 2349–2353. James, D.A.; Leadbetter, R.I.; Neeli, M.R.; Burkett, B.J.; Thiel, D.V.; Lee, J.B. An integrated swimming monitoring system for the biomechanical analysis of swimming strokes. Sports Technol. 2011, 4, 141–150. Rowlands, D.; James, D.; Lee, J.B. Visualization of wearable sensor data during swimming for performance analysis. Sports Technol. 2013, 6, 130–136. © 2017 by the authors. Submitted for possible open access publication under the terms and conditions of the Creative Commons Attribution (CC BY) license (http://creativecommons.org/licenses/by/4.0/).