applications dependent on information related to soil types and terrain of the project site. ... The user may also devel
ELSEVIER
Automation
An automated
in Construction
4 (1995) 139-146
environment for soils- and terrain-dependent applications * Amr A. Oloufa
a9*, Masaaki
Ikeda b
a Penn State Vnioersity, Department of Architectural Engineering, 104 Engineering Building “A”, University Park, PA 16802, USA b Fujita Corporation, Technical Research Institute, 74 Ohdana-Cho, Kohoko-ku, Yokohama 223, Japan
Abstract This paper explains the development of an integrated information environment that is designed specifically for applications dependent on information related to soil types and terrain of the project site. This covers a wide variety of applications such as shallow and deep foundations, trenching, earthmoving and tunneling. The design of this environment takes into consideration the typical requirements of the project team with an emphasis on integrating requirements for both design and construction. The environment reported here is comprised of three main modules, a relational database for the storage and display of soil borelog information, a geographic information system that displays the geographical locations of soil studies, and a module that is used to develop a three-dimensional profile of the soil layers between any number of borelogs. The user may also develop cross sections of soil layers in any direction. This paper reports on the hardware and software used and concludes with a discussion of future extensions to the system. Keywords: Soil database; dent applications
GIS; Three-dimensional
soil layers; Visualization;
1. Introduction The benefits of integrating design and construction have been covered extensively in the literature. The success of such efforts will be heavily dependent on the development of information systems that span across the engineering
*Discussion is open until December
1995 (please submit your discussion paper to the Editor on Construction Technologies,
M.J. Skibniewski).
* Corresponding
author.
Integrated
environment;
Terrain-depen-
and construction disciplines. The research reported here is related to the development of an integrated information management system to aid both engineering design and construction managers. In the majority of projects, information related to the types of soil and the project site terrain is extremely important for the planning, design and construction
phases
of the
project.
Information
related to soil types is important for the selection of foundation systems and types, and for the selection
0926-5805/95/$09.50 0 1995 Elsevier Science B.V. All rights reserved .SSDZ 0926.5805(94)00041-7
of earthmoving
and
excavation
machin-
140
A.A. Oloufa, M. Ikeda /Automation
ery. Soil types also have a significant impact on the duration of excavation and earthmoving and may lead to substantial delays if not properly accounted for. In some construction applications such as tunneling, the type of soil and level of water table is perhaps the major component affecting the final cost of a project. Soil data is normally stored in reports. The traditional approach to the assessment of the effect of soil types is by interpreting the soil reports which come in the form of boring logs, and correlating them to the surface locations of the corresponding boreholes on the set of plans. This manual approach is extremely time consuming and is seldom done thoroughly. Also, due to the space needed for the storage of these reports, several organizations have been investigating the benefits of storing this information on-line. Because it is important to retrieve soil information based on a specific geographic location, a tool is needed to store, manipulate, and display descriptive data about objects in real life as well as their relative geographic locations. Geographic Information Systems (GIST are computer tools that correlate data related to objects in real life to their respective geographical locations. A digital map is a model comprised of the combination of a topological model to represent object locations and topology, and the relational model to represent object attributes. Current GIS programs have serious limitations in their applicability to a large family of engineering problems. The term “spatial” in geographic information systems refers to land surface 2D and not 3D representation since the GIS technology was developed by specializations that are primarily interested in two-dimensional processing such as vegetation types, right of way, cloud coverage and political boundaries, etc. For the reason mentioned above, it is useful to develop a system that is capable of developing three-dimensional representations of soil layers in the site project. Such a system interpolates the terrain between the soil borelogs thereby allowing the designer to “visualize” the project site with its different soil types and layers.
in Construction
4 (1995) 139-146
2. Geographic
information
systems
GIS programs are needed since conventional database systems do not have any information related to the geographic location of the data in relation to data taken at different locations. Also, in engineering applications, a typical query might be “List all pockets with a sandy-clay soil that are enclosed within a particular boundary”. This query could be answered fast by storing the topological information explicitly in the data model. A major advantage of GIS software is the ability to maintain data associated with different entities in separate layers that are based on the same geographic referencing system which can be superimposed spatially to support data queries and analysis [l,lOl. Many applications use GIS to support decision making. For example, (1) In environmental engineering, GIS programs may be used for selecting the location of a waste site which is constrained by the locations of housing areas, the habitats of endangered species, production facilities, and highways. A GIS can be used to analyze a map of the city where the waste site is needed, and identity the possible locations which meet the criteria for the site. (2) In geotechnical engineering, the display of the locations of boreholes on a digital map on the computer screen helps the geotechnical engineer in selecting boreholes according to their proximity to the general location of a new investigation (refer to [6,71X (3) In construction engineering, GIS is used for site layout and the location of temporary facilities. The technology may also be used in conjunction with GPS (Global Positioning System) to identify locations of utility lines. (4) In transportation engineering, GIS is used to reach decisions about traffic planning. A GIS is used to display the densities of origin/destination, noise complaints, or trip generation rates. The topological capabilities of GIS are also used to answer queries about shortest routes between destinations, adjacency of
AA.
Oloufa, M. Ikeda /Automation
in Construction
highways to municipal boundaries, or the intersection of streets with a specific highway.
3. Requirements
for the integrated
environment
From the discussion in the previous section, the target requirements for a system capable of handling information needs are as follows: 1. Capable of storing both textual and graphical soil information. of being implemented in a 2. Capable client/server architecture to allow for data retrieval from multiple sites. 3. Users should be able to retrieve information related to the geographic vicinity of the project site. 4. Information has to be portable to allow for several types of databases and geographic information systems (GIS) to be used. 5. The user should be able to view the three-dimensional representation of the project site showing the various soil layers. between the various 6. Seamless integration modules of the system.
Fig. 1. Database
4 (1995) 139-146
141
7. Ease-of-use to allow the utilization of the system by various construction site personnel.
4. System design and implementation
(FIESTA)
From the reasons mentioned above, the authors developed the information system titled “Fujita Integrated Environment for Soils- and Terrain-Dependent Applications” (FIESTA). This en-
vironment is comprised of three modules, a geographic information system (GIS) module, a relational database module, and an elevation contouring and 3D soil layer development module. For this software project, an IBM-compatible 80486DX PC, 16 Meg. Ram, super VGA graphics was used. The software runs under the Microsoft Windows 3.1 operating environment. The software was assembled using Visual Basic Pro Version 3.0 along with other third party VBX controls. The GIS software used was MapInfo [41 and MapBasic Version 2.1. For contouring applications, the Geographix Exploration System (GES) [2] was used. The program starts with a screen allowing ac-
module.
142
A.A. Oloufa, ~$4.Ikeda /Automation
cess to three modules. The database module allows the entry and modification of soil borelog data. The GIS module correlates the soils information of borelogs to the actual locations of borelogs. The third module (Visualizer), is used to interpolate data from three or more borelogs into a three-dimensional representation of soil layers within the project area of interest. Below is a detailed description of these modules:
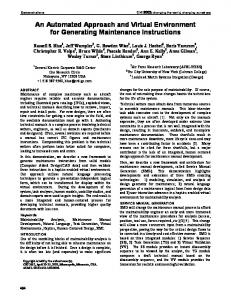
4.1. Module 1: database module The database module (see Fig. 1) is a relational database based on Microsoft Access. For the database to be accessed by different groups of users, access may be with read-only or full-editing privileges.
in Construction
4 (1995) 139-146
The data model contains three entities: Borelog, Layers and N values. The borelog entity has a one-to-many association with both the layers and N-values entities (see Fig. 2). The primary key for a borelog is a unique number that identifies that borelog. This number is also used to connect to the layers and N-values records. The borelog entity contains information related to the unique borelog number, water level, and its geographic location in latitude and longitude. This allows the database to be used with a number of GIS programs where geocoding of borelogs may be accomplished through the latitude and longitude database fields. Layers are stored with their initial and final elevations with no explicit layer numbers that need to be assigned by the user. This alows for
-L_ Ndklues Start End Value
Fig. 2. Data model for soils database.
A.A. Oloufa, M. Ikeda /Automation
easier modification of data in case a layer is added or deleted. In other words, the database keeps track of soil layers based on their start and end elevations. The program also includes overlap/gap checks to ensure that layers are entered correctly. Data entry of common soil types is facilitated through a combo-box within the layer entity grid as shown in Fig. 1. Currently, the database supports SQL searches on the borelog number. Users may search for one or more borelogs at a time, and “Like’‘-searches are also supported. The database module uses a grid control with in-place editing, which greatly simplifies viewing and editing operations. Referential integrity capabilities have been added where the deletion of a borelog automatically deletes all related layers and N-values. The same applies for changing the borelog number. The database module may transfer borelog numbers to/from the GIS and Visualizer modules via the Clipboard. The module has full graphing and printing capabilities. The user may view the representation of one or multiple borelogs and has control on all aspects of graphing such as scale, font size, screen proportion, maximum allowable values, etc. (see Fig. 3). The database module has been implemented using Microsoft Visual Basic Pro. In-place editing has been accomplished with a control from Sheridan software grid control, whereas graphing has been implemented with Pinnacle software charting control.
in Construction
143
4 (1995) 139-146
tion related to that borelog is retrieved as shown in Fig. 4. The user may also draw the borelog and multiple borelogs may be viewed simultaneously on the screen. If the user clicks on any layer within a borelog window, the database is updated with information related to the current borelog and an arrow points to the specific layer clicked on by the user. If the user wishes to edit a group of borelogs, the clipboard may be used to transfer the borelog numbers to the database module where the information may be modified. The GIS module is comprised of three submodules, MapInfo, a database module and a communications layer between the first two modules written using MapBasic. This capability allows for seamless integration between the various packages. The borelogs locations are kept on a separate layer from the streets layer of the city of Tokyo. This allows the separation of various features on the map, so for example there could be a layer
Update
print
Help
4.2. Module 2: GIS module The GIS module is comprised of MapInfo for Windows Version 2.1 and a read-only database module. Users can search for a specific borehole by its unique number or by its street address within a city. For the current implementation of FIESTA, the city of Tokyo was used to demonstrate the feasibility of this research. MapInfo (GIS software) is used to display the map of Tokyo where the stored borelogs appear as symbols. Using MapBasic (MapInfo Customization Language) and Dynamic Data Exchange (DDE) under M.S. Windows, the user may click on any borelog symbol and the informa-
Fig. 3. Borelog
with soil layers.
A.A. Oloufa, M. Ikeda /Automation
144
with utilities, and another for zoning regulations. A complex query may be easily developed within the GIS to show for example the location and depth of utilities in/and around a city zone. This information is extremely useful for construction planning to ensure that the correct location of utilities is relayed to all contractors and subcontractors using the project site.
in Construction 4 (1995) 139-146
enclosing the selected borelogs. The user may input the borelog numbers directly, or via the clipboard from the GIS, or database modules. The process starts with the user viewing soil borelogs and according to his judgment, assigning numbers to the different soil layers in the database module. Layer numbers are assigned in an “attribute” field belonging to the layers entity. The same number given to layers across multiple borelogs means that the soil layer is assumed to be continuous across multiple borelogs. A soil number given once for any layer in a borelog means that this layer is assumed to be a pocket of soil (see Fig. 5). In this case, the visualizer program assumes elevations of this layer at the remaining borelogs are at ground level.
4.3. Module 3: visualizer module This module starts by preparing an input file that is accessed by the Geographix Exploration System. GES is used to interpolate between three or more borelogs to develop a three-dimensional representation of the soil layers surrounding and
I .i 5
..hlc
Edit
Analyze
Iable
Style
Window
Map
Fig. 4. Integrated
!kIP
Fhh
GIS and soils database.
A.A. Oloufa, M. Ikeda /Automation
Fig. 5. Continuous
in Construction
4 (1995) 139-146
145
soil layers and soil pockets.
The visualizer program develops a single file with the elevations of the multiple layers. This file is read into the GES environment which interpolates the results, thus allowing the user to view the three-dimensional soil layers. The user may input multiple 3D soil layers and generate
Fig. 6. Cross sections
cross sections at all required locations. After the cross sections are generated, the user would then edit these cross sections to reflect the correct extents of these soil pockets (see Fig. 6). This step is needed only in the presence of soil pockets whose extents cannot be correctly interpolated.
of soil layers.
A.A. Oloufa, M. Ikeda /Automation
146 5.
Future extensions
databases The utilization of object-oriented here. extends the power of the system reported This allows the soil data retrieved to also contain the most appropriate methods for their excavation along with typical productivity and performance parameters. These improvements allow the seamless integration with simulation programs where multiple design and construction scenarios may be evaluated. For better visualization of the design and construction processes, a true three-dimensional CAD environment is preferable to the GES environment used here. The incorporation of some rules and AI techniques in the contouring and layer development module (Visualizer) is also an extremely useful and worthwhile extension of this work as it improves the quality and reliability of the developed cross sections. A powerful CAD environment is also extremely useful for visual reality applications especially in areas such as automated shield tunneling. Recently, large cities and metropolitan areas have witnessed an increased demand for the utilization of underground space. This space may be used for retail outlets, subway systems, other transportation systems, and for utilities and communications systems. Shield tunneling machines have been used successfully for a number of years [3,5,8,9]. Due to the relatively high cost of such machines, it would be useful for engineers and operators to “practice” in a virtual environment operating the tunneling machine in the various soil types the machine will encounter while moving through its designated route.
in Construction 4 (1995) 139-146
Acknowledgements The authors wish to thank the Fujita Corporation of Japan, and the Partnership for Achieving Construction Excellence (PACE) at Penn State University for supporting this research.
References [ll Antenucci,
J.C., K. Brown, P.L. Croswell and M.J. Kevany, Geographic Information Systems: A Guide to the Technology, Van Nostrand Reinhold, New York (1991). 121Geographix Exploration System (GES), Version 7.1, Geographix Inc., Denver, Colo., 1993. [31 Hashiba, S., Prospects for Applying Automation/Robotization of Shield Method Work, 9th Int. Symp. on Automation and Robotics in Construction, Tokyo, Japan, June 3-5, 1992. Maplnfo, Desktop Mapping SoftI41 MapInfo Corporation, ware for Windows, Troy, N.Y. (1993). Y., Ohnishi, T. and Kanno, M., [51 Mikami, T., Hanamori, An Automatic Direction Control System for Shield Tunneling, 8th Int. Symp. on Automation and Robotics in Construction, Stuttgart, Germany, June 3-5, 1991. A.A. and Papacostas, C.S., An [61 Oloufa, A.A., Eltahan Integrated GIS for Construction Site Investigation, J. Construction Engrg. Manag., ASCE (March 1994). C.S. and Hamada, H.S., Relat[71 Oloufa, A.A., Papacostas, ing Structural Failures to Subsurface Conditions Using GIS, Building and Enoironment J. (March 1991). System, 6th Int. [gl Sato, K., Shield Method Automation Symp. on Automation and Robotics in Construction, San Francisco, Calif. June 6-8, 1989. System [91 Sato, K., Sekiya, K. and Higaki, K., Hyper-Shield Achieves Automated Excavation, in: Watson and Tucker (Eds.), Automation and Robotics in Construction X, Elsevier, Amsterdam (1993). [lo] Star, J. and J. Estes, Geographic Information Systems: An Introduction, Prentice-Hall, Englewood Cliffs, N.J. (1990).