An Automatic Segmentation of T2-FLAIR Multiple Sclerosis Lesions Release 0.00
JC. Souplet1 , C. Lebrun2 , N. Ayache1 , G. Malandain1
July 15, 2008 1 INRIA,
Asclepios project-team, 2004 Route des Lucioles BP 93, Sophia-Antipolis, 06902 France 2 CHU Pasteur, Neurological department, 30 voie romaine BP 69, Nice, 06002 France Jean-Christophe
[email protected]
Abstract Multiple sclerosis diagnosis and patient follow-up can be helped by an evaluation of the lesion load in MRI sequences. A lot of automatic methods to segment these lesions are available in the literature. The MICCAI workshop Multiple Sclerosis (MS) lesion segmentation Challenge 08 allows to test and compare these algorithms. This paper presents a method designed to detect hyperintense signal area on T2-FLAIR sequence and its results on the Challenge test data. The proposed algorithm uses only three conventional MRI sequences: T1, T2 and T2-FLAIR. First, images are cropped, spatially unbiased and skull-stripped. A segmentation of the brain into its different compartments is performed on the T1 and the T2 sequences. From these segmentations, a threshold for the T2-FLAIR sequence is automatically computed. Then postprocessing operations select the most plausible lesions in the obtained hyperintense signals. Average global result on the test data (80/100) is close to the inter-expert variability (90/100).
Contents 1
Method 1.1 Preprocessing . . . . . . . . . . . . . . Image cropping . . . . . . . . . . . . . Skull-stripping . . . . . . . . . . . . . Intensity Normalization . . . . . . . . . 1.2 Segmentation of the brain . . . . . . . . 1.3 Lesion extraction from the T2-FLAIR . Segmentation from T2-FLAIR sequence Refinement using classification results . Limitation of the region of interest . . .
. . . . . . . . .
. . . . . . . . .
. . . . . . . . .
. . . . . . . . .
. . . . . . . . .
. . . . . . . . .
. . . . . . . . .
. . . . . . . . .
. . . . . . . . .
. . . . . . . . .
. . . . . . . . .
. . . . . . . . .
. . . . . . . . .
. . . . . . . . .
. . . . . . . . .
. . . . . . . . .
. . . . . . . . .
. . . . . . . . .
. . . . . . . . .
. . . . . . . . .
. . . . . . . . .
. . . . . . . . .
. . . . . . . . .
. . . . . . . . .
. . . . . . . . .
. . . . . . . . .
. . . . . . . . .
. . . . . . . . .
2 2 2 4 4 4 5 5 5 6
2
Results
7
3
Discussion and future work
9
2
Multiple Sclerosis (MS) is a chronic, inflammatory, demyelinating disease of the Central Nervous System (CNS). In people affected by MS, patches of damage called lesions appear in seemingly random areas of the CNS. An MRI exam is required to establish MS diagnosis using McDonald criteria [12]. In addition they are often used in patients follow-up and clinical studies [10]. MRI analysis uses currently Barkhof/Tintore criteria [1, 21] which include lesions number, location enhancement and are taking into account spinal cord lesions [15]. These lesions can appear as a hyperintense signal or as a hypointense signal depending on its properties and on the used MRI sequence. Lesions are hyperintense signals in T2 and proton density sequences. Active lesions are a piece of evidence of blood-brain barrier leakage and are the only lesion subtype in hyperintense signals in the T1 sequence with Gadolinium. Necrotic lesions are hypointense signal in T1 sequence. Except for necrotic lesions, T2-FLAIR sequence allows a better lesion-healthy tissue differentiation but bony artefacts and flow artefacts are present in the image. A binary segmentation of the lesions can help to the MS diagnosis and patient follow-up. Manual lesion segmentation is a fastidious task and depends on intra and inter-expert variabilities. For this reason, a lot of automatic lesion segmentation algorithms have been developed in the past 20 years [20]. The Multiple Sclerosis (MS) lesion segmentation Challenge 081 offers the possibility to compare these methods. First, a set of train data (with manual segmentation of expert) is available to optimize the different methods. Then, lesion segmentation has to be performed on a set of test data. Results are then compared with manual segmentation by an expert. The method which is proposed in this article segments automatically the hyperintense signal in the T2FLAIR sequence. First, the method is described. Then results on the test data of the workshop are given and discussed.
1
Method
The method proposed in this article segments T2-FLAIR lesions from three MRI sequences (T1, T2 and T2-FLAIR) and is divided in different steps. First, preprocessing steps allow to normalize images and to focus on a region of interest. Secondly, a classification of the brain is performed thanks to an expectationmaximization algorithm [4] applied on the T1 and T2 sequences. These steps are similar to [7]. In a third step, information given by the obtained segmentations and morphological operations allow to extract lesions. 1.1
Preprocessing
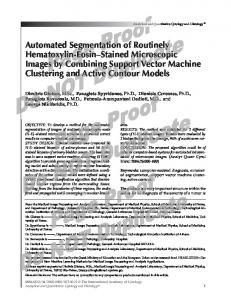
MRI sequences of the MS lesion segmentation Challenge 08 are already co-registered. This means that a same voxel in the different sequences represents the same location in the brain. However, different preprocessing steps have to be performed before segmenting the images (Figure 1). Image cropping
This step aims to decrease the number of voxels belonging to the background. It also improves the computation speed of following processes. It is performed using the MNI2 atlas [9, 8] and an affine registration algorithm [14]. First, the average T2 sequence of the atlas is registered on the T2 sequence. Then, the 1 http://www.ia.unc.edu/MSseg 2 http://www.mni.mcgill.ca/
1.1
Preprocessing
3
(a)
(b)
(c)
(d)
(e)
(f)
(g)
(h)
(i)
Figure 1: Preprocessing steps on CHB test1 Case01 test data: (a) given T2 sequence, (b) cropped T2 sequence, , (c) skull-stripped and unbiased T2 sequence, (d) given T1 sequence, (e) cropped T1 sequence, (f) skull-stripped and unbiased T1 sequence, (g) given T2-FLAIR sequence, (h) cropped T2-FLAIR sequence, (i) skull-stripped and unbiased T2-FLAIR sequence.
1.2
Segmentation of the brain
4
obtained transformation is applied on all the images of the atlas. The obtained information allow to crop the MRI sequences focussing on a region of interest. Skull-stripping
This step extracts the intracranial space from the image. Many methods such as [17, 18, 19, 23] are described in the literature. Our method is described in [7]. A first expectation-maximization algorithm is performed on the couple of sequences T1 and T2 and leads to a first segmentation of the brain. Morphological operations (detection of the largest connected component, holes filling ...) allow to get the brain mask. Intensity Normalization
The aim of this step is to correct the fact that two voxels with the same biological composition may not have the same intensity. This difference in intensity is called bias and is caused by RF acquisition field inhomogeneities [13] or biological tissues bias reflecting that the intensity of a same biological structure has a variability around a mean value [16]. In our case, we estimate and correct these inhomogeneities with the Expectation/Conditional Maximization algorithm proposed in [16]. 1.2
Segmentation of the brain
To segment the brain, the algorithm presented in [5] is applied on the T1 and T2 sequences. This algorithm uses the principle of the EM algorithm [4] to maximize the log-likelihood between the MRI data and a gaussian model of ten classes: white matter (WM), grey matter (GM), cerebro-spinal fluid (CSF), six GM/CSF partial volume classes (with different proportions), and an outlier class (additional class that corresponds mainly to the vessels). First, the probability of belonging to the different classes of each voxel is initialized thanks to the a priori information of the MNI registered atlas [9, 8]. Second two steps are iterated: • In the maximization step, the parameters (mean µk , covariance matrix Σk ) of each class, k, are computed from the voxels intensities and their probabilities of belonging to the different classes. • In the expectation step, the probability of belonging to the different classes of each voxel is updated depending on the classes parameters. Finally, outliers that do not follow the intensity gaussien model are detected thanks to the computation of the Mahalanobis distance (Equation 1) between the intensity vector, v, of each voxel and the mean vector of each class. dk = (v − µk )T Σ−1 k (v − µk )
(1)
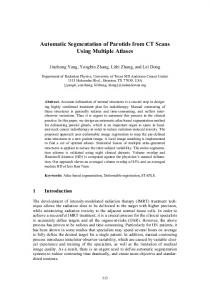
If this distance is greater than a threshold the voxel is considered as an outlier. The probability segmentations given by this algorithm are then binarize. Each voxel belongs to the class with the highest probability. At the end of this step 11 binary images (GM, WM, CSF, 6 partial volume classes, outliers corresponding to vessels, others outliers) are obtained (Figure 2).
1.3
Lesion extraction from the T2-FLAIR
(a)
5
(b)
(c)
(d)
(e)
Figure 2: Obtained classification on CHB test1 Case01 test data: (a) CSF, (b) GM, (c) WM, (d) all 6 partial volume classes, (e) all outliers.
1.3
Lesion extraction from the T2-FLAIR
Except for necrotic lesions, lesions are hyperintense signals on the T2-FLAIR. The following steps use this property to segment the lesions. Segmentation from T2-FLAIR sequence
The application of the binary segmentations of the brain (Section 1.2) on the T2-FLAIR sequence gives the properties (mean, µ, standard deviation, σ) of healthy compartments on this sequence. As lesions are hyperintense signals on the T2-FLAIR sequence, a sensitive threshold, T, which gives a preliminary segmentation of the lesions can be compute automatically from the properties of the GM class (Equation 2). T = µGM + 2σGM
(2)
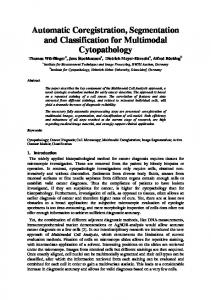
The application of this threshold on the T2-FLAIR sequence can help us to ”detect” lesions (most of the lesion have at least a voxel with an intensity higher than the threshold). However lesion voxel intensities are inhomogeneous and the ”delineation” of the lesion is not simple even if a voxel of this lesion is known. For this reason, we enhance the contrast in the T2-FLAIR sequence before applying the threshold T (Figure 3, a et b). This is realized with the algorithm 1. The application of T on the T2-FLAIR sequence with enhanced contrast gives a candidate lesion segmentation, S1 . Refinement using classification results
S1 contains lesions but also others hyperintense signals like bony artefacts and flow artefacts. To eliminate the voxels corresponding to these false positives, a region of interest is defined. Like in [11, 22], we are looking for lesions in the ”supposed WM”. This ”supposed brain compartment” correspond to the WM that we should observed if there was no lesion in the sequence. A segmentation of this class can be approximated by the mask of WM (given by the EM algorithm) in which cavities (holes in the segmentation) have been filled. This is realized thanks to morphological operations. The application of this mask on S1 gives a second preliminary lesion segmentation, S2 .
1.3
Lesion extraction from the T2-FLAIR
6
Algorithm 1 Enhancing contrast algorithm. Require: T2-FLAIR sequence, ima. Dima = a grey level dilation of ima Eima = a grey level erosion of ima Cima = an empty image of the same size of ima for all Voxel, i do if Dima(i) − ima(i) ≤ ima(i) − Eima(i) then Cima(i) = Dima(i) else if ima(i) − Eima(i) ≤ Dima(i) − ima(i) then Cima(i) = Eima(i) else Cima(i) = ima(i) end if end for Return Cima, the T2-FLAIR sequence with enhanced contrast. According to [6], lesions may be classified as outliers, GM/CSF partial volumes or ”pure” GM in the segmentations given by the EM algorithm. Consequently, they are not included in the WM mask or in the ”pure” CSF mask. Voxels belonging to one of these masks are removed from S2 . Finally, the holes that are present in the segmentation are filled thanks to morphological operations to improve lesion delineation (Figure 3, c).
(a)
(b)
(c)
Figure 3: Extraction of T2-FLAIR lesions: (a) T2-FLAIR sequence, (b) T2-FLAIR sequence with enhanced contrast, (c) Final segmentation of the lesions.
Limitation of the region of interest
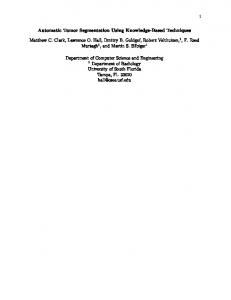
We used the property that lesions are hyperintense signals in the T2-FLAIR sequence. In fact, this is not correct for sub-tentorial lesions. In this case, lesion intensities are close to healthy tissues (GM, WM) intensities. Consequently, sub-tentorial lesions are not included in S1 and S2 in most of the cases. To avoid false positive in this region, all voxel of S2 included in the sub-tentorial region are removed. The mask of the sus-tentorial region is perform with a locally affine registration [3] of an atlas [2] on the data, followed by morphological operations (Figure 4).
7
Figure 4: Contours of the sus-tentorial mask on the T2-FLAIR sequence.
2
Results
Results of the method have been sent to the the Challenge managers. A comparison between the automatic segmentations and manual segmentation performed by two experts has been performed. Different criteria have been used to compare the different segmentations. This is a short description of them : • The volume difference captures the absolute percent volume difference to the expert rater segmentation. • The average distance captures the symmetric average surface distance to the expert rater segmentation. • The true positive rate corresponds to the number of lesions in the automatic segmentation that overlaps with a lesion in the expert segmentation divided by the number of overall lesions in the expert segmentation. • The false positive rate is the number of lesions in the automatic segmentation that DON’T overlap with any lesion in the expert segmentation divided by the number of overall lesions in the automatic segmentation. • The sensitivity is the ratio of true positives to the sum of true positives and false negatives. • The specificity is the ratio of true negatives to the sum of true negatives and false positives. • The positive predictive value is the ratio of true positives to the sum of true positives and false positives. For the true positive rate and the false positive rate criteria, the unity is the lesion (a connected region of the segmentation). For sensitivity, specificity and positive predictive value, the unity is the voxel. Table 1 gives the results of our method on the test data of the challenge. Figure 5 present the Total score of each patient repartition with a box-and-whisker plot. Figure 6 gives an example of execution time for the patient CHB test1 Case01.
UNC Rater CHB Rater STAPLE Volume Diff. Avg. Dist. True Pos. False Pos. Volume Diff. Avg. Dist. True Pos. False Pos. Total Specificity Sensitivity [%] Score [mm] Score [%] Score [%] Score [%] Score [mm] Score [%] Score [%] Score UNC test1 Case01 56.6 92 4.8 90 51.2 81 75.7 64 36.5 95 5.3 89 53.1 82 69.2 68 82 0.9936 0.3248 UNC test1 Case02 7.7 99 4.1 92 54.4 82 72.5 65 87.8 87 3.5 93 40.9 75 31.9 90 85 0.9949 0.1782 UNC test1 Case03 46.2 93 1.5 97 53.5 82 49.4 80 30.5 96 1.3 97 55.9 83 40.6 85 89 0.9947 0.6529 UNC test1 Case04 90.6 87 8.6 82 34.2 71 86.4 57 85.5 87 7.1 85 48.1 79 86.4 57 76 0.9955 0.0587 UNC test1 Case05 53.4 92 6.0 88 52.4 81 75.2 64 5.3 99 6.4 87 78.3 96 77.9 62 84 0.9906 0.3695 UNC test1 Case06 81.1 88 7.0 86 41.4 75 71.4 66 15.5 98 19.4 60 62.5 87 86.9 57 77 0.9932 0.1438 UNC test1 Case07 45.6 93 2.6 95 55.7 83 58.3 74 26.2 96 6.4 87 80.0 97 71.5 66 86 0.9883 0.5412 UNC test1 Case08 21.1 97 3.9 92 63.8 88 65.2 70 28.9 96 10.6 78 94.4 100 76.1 63 85 0.9865 0.5983 UNC test1 Case09 157.9 77 44.0 9 33.3 70 96.6 51 263.9 61 53.0 0 0.0 51 100.0 49 46 0.9733 0.1110 UNC test1 Case10 73.0 89 13.0 73 45.0 77 85.2 58 525.2 23 22.5 54 83.3 99 93.8 53 66 0.9847 0.6041 CHB test1 Case01 70.3 90 3.9 92 52.0 81 27.6 93 57.6 92 2.6 95 83.9 99 35.3 88 91 0.9990 0.2075 CHB test1 Case02 32.7 95 6.2 87 63.6 88 84.1 58 71.3 90 2.3 95 63.2 87 41.3 84 86 0.9965 0.2960 CHB test1 Case03 48.9 93 11.6 76 50.0 80 87.7 56 75.3 89 12.2 75 33.3 70 90.4 55 74 0.9958 0.2282 CHB test1 Case04 50.2 93 5.2 89 72.7 93 81.0 60 76.1 89 3.8 92 72.2 93 50.0 79 86 0.9992 0.1735 CHB test1 Case05 36.8 95 8.8 82 48.1 79 92.5 53 74.0 89 3.2 93 69.6 91 71.0 66 81 0.9940 0.1492 CHB test1 Case06 69.9 90 6.7 86 16.7 61 93.0 53 68.6 90 6.6 86 27.3 67 90.6 54 73 0.9819 0.0284 CHB test1 Case07 62.7 91 5.5 89 48.3 79 85.6 58 77.3 89 4.8 90 55.3 83 74.0 65 80 0.9913 0.1085 CHB test1 Case08 49.6 93 2.1 96 81.5 98 74.8 64 66.3 90 2.3 95 61.8 87 62.9 71 87 0.9964 0.3129 CHB test1 Case09 56.3 92 3.6 92 34.9 71 69.6 67 63.1 91 2.6 95 35.8 72 55.4 76 82 0.9949 0.2781 CHB test1 Case10 3.4 100 7.4 85 68.4 90 93.4 53 49.4 93 3.9 92 79.3 97 76.4 63 84 0.9908 0.1984 CHB test1 Case11 16.3 98 6.0 88 47.7 79 91.4 54 72.9 89 3.6 93 51.7 81 81.7 60 80 0.9920 0.1657 CHB test1 Case12 86.0 87 7.1 85 12.0 58 81.7 60 86.1 87 6.8 86 15.4 60 77.7 62 73 0.9872 0.0200 CHB test1 Case13 50.0 93 5.4 89 50.0 80 85.4 58 69.3 90 4.6 91 76.2 95 64.6 70 83 0.9938 0.3095 CHB test1 Case15 71.9 89 2.6 95 53.4 82 44.6 82 62.9 91 1.9 96 57.4 84 49.7 79 87 0.9965 0.2639 All Average 55.8 92 7.4 85 49.4 80 76.2 63 86.5 87 8.2 84 57.5 84 69.0 68 80 0.9919 0.2634 All UNC 63.3 91 9.5 80 48.5 79 73.6 65 110.5 84 13.5 73 59.7 85 73.4 65 78 0.9895 0.3583 All CHB 50.4 93 5.9 88 50.0 80 78.0 62 69.3 90 4.4 91 55.9 83 65.8 70 82 0.9935 0.1957
Ground Truth All Dataset
0.7049 0.8373 0.8708 0.5161 0.6164 0.5770 0.6463 0.5587 0.0873 0.5892 0.8462 0.8138 0.4562 0.9193 0.5690 0.1001 0.4856 0.8219 0.7949 0.5123 0.5317 0.1141 0.7506 0.8947 0.6089 0.6004 0.6150
PPV
8
Table 1: Results of this method on MS lesion Challenge 08 Test data
9
Step Atlas based image cropping Skull-stripping Intensity Normalization Segmentation of the brain Segmentation from T2-FLAIR Refinement using classification results Limitation of the region of interest Total
Figure 5: Box-and-whisker plot of the total score of the 24 patients: one outlier (with the value 46) is observed.
3
time (min) 24 2 30 16 3 3 12 96 (1h30)
Figure 6: Example of execution time on CHB test1 Case01.
Discussion and future work
The analysis of individual criteria is complex because of their interdependencies. For example, the true positive rate give the number of lesion correctly detected but its value does not take into consideration the volume of the missed lesions. For this reason, our discussion is only based on the global scores. The comparison of UNC rater and CHB rater is given to be around 90/100. Our method with a global result of 80/100 is near this inter-expert variability. The box-and-whisker plot (Figure 2) shows that the method scores are between 66 and 91 except for one outlier. Indeed, our method result is only 46 for the patient UNC test1 Case09. This can be explained by the fact that this patient seems to have necrotic lesions, a lesion subtype which is not detected by the proposed method. Indeed, necrotic lesions are hypointense signals in T1 but are not visible in T2-FLAIR. In addition, no lesion is observed on the T2-FLAIR and the WM appear ”dirty”. Consequently, the proposed method detects a lot of false positives. This is also observed for UNC test1 Case04, CHB test1 Case06 and CHB test1 Case12. In these three cases, the score of our method is under 80. Moreover, our method has a score under 80 for three other data sets: UNC test1 Case06, UNC test1 Case10 and CHB test1 Case03. Without the segmentation of reference, the best explanation seems to be that these data correspond to patients with few lesions. Therefore, any error of segmentation decreases dramatically the score. This assertion has to be further validated with a comparison between the automatic segmentation and the segmentation of reference. STAPLE results show that our method is more specific than sensitive. This show an undersegmentation of the lesions. This effect can also be observed in Figure 3. The proposed method needs around 1 hour 30 minutes to segment the lesion of the Challenge data (Figure 6). This is often less than manual segmentation. Moreover, the method algorithm has not been optimized. We have developed a method to detect T2-FLAIR lesions. This method is known to be unable to detect necrotic lesions and sub-tentorial lesions. Results on test data are close to inter-expert variability. Future work should segment necrotic and sub-tentorial lesions from information given by other sequences. This
References
10
method will also be included in SepINRIA3 (a software allowing analysis of MS MRI).
References [1] F Barkhof, M Filippi, D H Miller, P Scheltens, A Campi, C H Polman, G Comi, H J Ader, N Losseff, and J Valk. Comparison of MRI criteria at first presentation to predict conversion to clinically definite multiple sclerosis. Brain, 120 ( Pt 11):2059–69, November 1997. (document) [2] Pierre-Yves Bondiau, Gregoire Malandain, Stephane Chanalet, Pierre-Yves Marcy, Jean-Louis Habrand, Francois Fauchon, Philippe Paquis, Adel Courdi, Olivier Commowick, Isabelle Rutten, and Nicholas Ayache. Atlas-based automatic segmentation of MR images: validation study on the brainstem in radiotherapy context. Int J Radiat Oncol Biol Phys, 61(1):289–98, January 2005. 1.3 [3] Olivier Commowick, Vincent Arsigny, Aur´elie Isambert, Jimena Costa, Fr´ed´eric Dhermain, Franc¸ois Bidault, Pierre-Yves Bondiau, Nicholas Ayache, and Gr´egoire Malandain. An efficient locally affine framework for the smooth registration of anatomical structures. Medical Image Analysis, 12(4):427– 441, 2008. 1.3 [4] A. Dempster, N. Laird, and D. Rubin. Maximum likelihood for incomplete data via the EM algorithm. Journal of the Royal Statistical Society, 39(1):1–38, 1977. 1, 1.2 ´ [5] G. Dugas-Phocion, M. Angel G. Ballester, G. Malandain, C. Lebrun, and N. Ayache. Improved EMbased tissue segmentation and partial volume effect quantification in multi-sequence brain MRI. In Proc. of MICCAI’04. Springer LNCS 3216, 2004. 1.2 [6] Guillaume Dugas-Phocion. Segmentation d’IRM C´er´ebrales Multi-S´equences et Appli´ cation a` la Scl´erose en Plaques. Phd thesis, Ecole des Mines de Paris, 2006. http://www.inria.fr/sophia/asclepios/Publications/Misc/dugas-phd.pdf. 1.3 ´ [7] Guillaume Dugas-Phocion, Miguel Angel Gonz´alez Ballester, Christine Lebrun, St´ephane Chanalet, Caroline Bensa, Gr´egoire Malandain, and Nicholas Ayache. Hierarchical segmentation of multiple sclerosis lesions in multi-sequence MRI. In International Symposium on Biomedical Imaging: From Nano to Macro (ISBI’04), Arlington, VA, USA, April 2004. IEEE. 1, 1.1 [8] A. C. Evans, D. L. Collins, S. R. Mills, E. D. Brown, R. L. Kelly, and T. M. Peters. 3D statistical neuroanatomical models from 305 MRI volumes. In IEEE-Nuclear Science Symposium and Medical Imaging Conference, pages 1813–1817, 1993. 1.1, 1.2 [9] A. C. Evans, D. L. Collins, and B. Milner. An MRI-based stereotactic brain atlas from 250 young normal subjects. In 22nd Symposium of the Society for Neuroscience, page 408, Anaheim, 1992. 1.1, 1.2 [10] Massimo Filippi, Marco Rovaris, Matilde Inglese, Frederik Barkhof, Nicola De Stefano, Steve Smith, and Giancarlo Comi. Interferon beta-1a for brain tissue loss in patients at presentation with syndromes suggestive of multiple sclerosis: a randomised, double-blind, placebo-controlled trial. Lancet, 364(9444):1489–96, October 2004. (document) 3 http://www-sop.inria.fr/asclepios/software/SepINRIA
References
11
[11] Micheline Kamber, Rajjan Shinghal, D.L. Collins, Gordon S. Francis, and Alan C. Evans. Modelbased 3d segmentation of multiple sclerosis lesions in magnetic resonance brain images. IEEE Trans Med Imaging, 14(3):442–453, September 1995. 1.3 [12] W I McDonald, A Compston, G Edan, D Goodkin, H P Hartung, F D Lublin, H F McFarland, D W Paty, C H Polman, S C Reingold, M Sandberg-Wollheim, W Sibley, A Thompson, S van den Noort, B Y Weinshenker, and J S Wolinsky. Recommended diagnostic criteria for multiple sclerosis: guidelines from the international panel on the diagnosis of multiple sclerosis. Ann Neurol, 50(1):121–7, July 2001. (document) [13] P. A. Narayana, W. W. Brey, M. V. Kulkarni, and C. L. Sievenpiper. Compensation for surface coil sensitivity variation in magnetic resonance imaging. Magn Reson Imaging, 6(3):271–4, May-Jun 1988. 1.1 [14] S. Ourselin, A. Roche, S. Prima, and N. Ayache. Block matching: A general framework to improve robustness of rigid registration of medical images. In Proc. of MICCAI’00, pages 557–566. Springer, 2000. 1.1 [15] Chris H Polman, Stephen C Reingold, Gilles Edan, Massimo Filippi, Hans-Peter Hartung, Ludwig Kappos, Fred D Lublin, Luanne M Metz, Henry F McFarland, Paul W O’connor, Magnhild SandbergWollheim, Alan J Thompson, Brian G Weinshenker, and Jerry S Wolinsky. Diagnostic criteria for multiple sclerosis: 2005 revisions to the ”Mc Donald Criteria”. Ann Neurol, 58(6):840–6, December 2005. (document) [16] S. Prima, N. Ayache, Tom Barrick, and Neil Roberts. Maximum likelihood estimation of the bias field in MR brain images: Investigating different modelings of the imaging process. In Proc. of MICCAI’01, pages 811–819. Springer LNCS 2208, 2001. 1.1 [17] S Sandor and R Leahy. Surface-based labeling of cortical anatomy using a deformable atlas. IEEE Trans Med Imaging, 16(1):41–54, February 1997. 1.1 [18] D W Shattuck, S R Sandor-Leahy, K A Schaper, D A Rottenberg, and R M Leahy. Magnetic resonance image tissue classification using a partial volume model. Neuroimage, 13(5):856–76, May 2001. 1.1 [19] Stephen M Smith. Fast robust automated brain extraction. Hum Brain Mapp, 17(3):143–55, November 2002. 1.1 [20] Jean-Christophe Souplet, Christine Lebrun, St´ephane Chanalet, Nicholas Ayache, and Gr´egoire Malandain. Revue des approches de segmentation des l´esions de scl´erose en plaques dans les s´equences conventionnelles IRM. Revue Neurologique, 2008. doi:10.1016/j.neurol.2008.04.009. (document) [21] M Tintore, A Rovira, M J Martinez, J Rio, P Diaz-Villoslada, L Brieva, C Borras, E Grive, J Capellades, and X Montalban. Isolated demyelinating syndromes: comparison of different mr imaging criteria to predict conversion to clinically definite multiple sclerosis. AJNR Am J Neuroradiol, 21(4):702–6, April 2000. (document) [22] S Warfield, J Dengler, J Zaers, CRG Guttmann, WM Wells, GJ Ettinger, J Hiller, and R Kikinis. Automatic Identification of Grey Matter Structures from MRI to Improve the Segmentation of White matter Lesions. Jounal of Image Guided Surgery, 1(6):326–338, 1995. 1.3 [23] Audrey H Zhuang, Daniel J Valentino, and Arthur W Toga. Skull-stripping magnetic resonance brain images using a model-based level set. Neuroimage, 32(1):79–92, August 2006. 1.1