Such pre-analyses may not be affordable in. 229 .... Any optimization algorithm may be used as the search engine in the framework; however in this. 329 study ...
Razavi, S., and B. A. Tolson (2013), An efficient framework for hydrologic model calibration on long data periods, Water Resour. Res., 49, 8418–8431, doi:10.1002/2012WR013442.
An Efficient Framework for Hydrologic Model Calibration on Long Data Periods
1 2 3 4 5 6 7 8 9
Saman Razavi1 and Bryan A. Tolson2 1
Global Institute for Water Security, University of Saskatchewan, Saskatoon, Saskatchewan, Canada
2
Department of Civil and Environmental Engineering, University of Waterloo, Waterloo, Ontario, Canada
Abstract:
10
Long periods of hydrologic data records have become available in many watersheds around the
11
globe. Hydrologic model calibration on such long, full-length data periods is typically deemed
12
the most robust approach for calibration but at larger computational costs. Determination of a
13
representative short period as a “surrogate” of a long data period that sufficiently embeds its
14
information content is not trivial and is a challenging research question. The representativeness
15
of such a short period is not only a function of data characteristics but also model and calibration
16
error function dependent. Unlike previous studies, this study goes beyond identifying the best
17
surrogate data period to be used in model calibration and proposes an efficient framework that
18
calibrates the hydrologic model to full-length data while running the model only on a short
19
period for the majority of the candidate parameter sets. To this end, a mapping system is
20
developed to approximate the model performance on the full-length data period based on the
21
model performance for the short data period. The basic concepts and the promise of the
22
framework are demonstrated through a computationally expensive hydrologic model case study.
23
Three calibration approaches, namely calibration solely to a surrogate period, calibration to the
24
full period, and calibration through the proposed framework, are evaluated and compared.
25
Results show that within the same computational budget, the proposed framework leads to
26
improved or equal calibration performance compared to the two conventional approaches.
27
Results also indicate that model calibration solely to a short data period may lead to a range of
1
28
performances from poor to very well depending on the representativeness of the short data period
29
which is typically not known a priori.
30 31
Keywords: Automatic Calibration, Optimization, Hydrologic Model, Surrogate Modeling, Calibration data
32
1. Motivation and Objective
33
The appropriate length of observation data for effective calibration of continuous hydrologic
34
models has been a challenging research question [Andreassian et al., 2001; Gupta and
35
Sorooshian, 1985; Juston et al., 2009; Perrin et al., 2007; Singh and Bardossy, 2012; Vrugt et
36
al., 2006; Xia et al., 2004; Yapo et al., 1996]. In general, longer calibration periods are deemed
37
more robust and reliable in identifying the model parameters and quantifying their uncertainty
38
[Perrin et al., 2007]. However, longer periods would demand longer model run-times; given that
39
in the calibration process a hydrologic model is required to run a large number of times, utilizing
40
the full period of data available for model calibration and uncertainty estimation may sometimes
41
become computationally demanding or even infeasible. Such computational burdens may
42
become prohibitive for some modern high-fidelity hydrologic models which simulate detailed
43
representations and processes of the real-world system. As such, computational limit is typically
44
one motivation of seeking a representative “short period” out of longer available data for model
45
calibration in any watershed of interest. A representative short period needs to embed diverse
46
climatic and hydrologic conditions to adequately represent hydrologic variability in the
47
watershed of interest such that all simulated processes in the model are well-activated [Juston et
48
al., 2009; Perrin et al., 2007; Singh and Bardossy, 2012].
49
There have been research studies attempting to determine the minimum adequate length of
50
data for hydrologic model calibration. These studies typically calibrated and compared model 2
51
parameters for different sub-periods with different lengths of a long data period and concluded
52
that several years of data could be adequate but their proposed required lengths vary relatively
53
widely in the range of two to eight years [Juston et al., 2009]. Singh and Bardossy [2012]
54
pointed out that any of the proposed required lengths cannot be generalized as different models
55
have different complexity levels and different watersheds have different information content in
56
each year of data period. In addition, Xia et al. [2004] found that different model parameters may
57
require different lengths of data to achieve calibration results insensitive to the period selected.
58
Moreover, the information contained in observation data is not uniformly distributed along the
59
period, and certain sub-periods may contain information useful for identifying some specific
60
parameters while irrelevant for other parameters [Singh and Bardossy, 2012]. Singh and
61
Bardossy [2012] proposed a method based on the statistical concept of data depth to identify and
62
extract what they referred to as “unusual events” out of the full data period for hydrologic model
63
calibration. Their identified “unusual events” in a calibration data period, however, can be far
64
apart in time, and as such, it may not be possible to extract a contiguous sub-period containing
65
all the unusual events that is sufficiently shorter than the full calibration period. Given these,
66
there is a tendency among hydrologists to utilize the full period of available data for calibration
67
of hydrologic models despite possible computational burdens.
68
The other potential issue with model calibration on a short period is the possible instability of
69
some model parameters with time due to climate and/or environmental changes. In this regard,
70
Merz et al. [2011] showed that some hydrologic model parameters may consistently vary with
71
time and such variations can be related to climate fluctuations. Zhang et al. [2011] developed a
72
framework for multi-period calibration of hydrologic models based on hydroclimatic clustering,
73
which identifies and utilizes different calibrated parameter sets for different hydroclimatic
3
74
conditions. Merz et al. [2011], however, argued that explicitly accounting for non-stationary
75
model parameters by predicting them based on climate condition may not be consistent with the
76
“usual philosophy of dynamic models” which is “to use time-dependent boundary conditions
77
(such as rainfall) and non-time-dependent model parameters to make the model directly
78
applicable to predictions using future (or different) boundary conditions”. Wagener [2007]
79
pointed out that to ensure credible modelling of environmental change impact, significant
80
correlations between model parameters and watershed characteristics should be demonstrated
81
and established. Wagener [2007] continued that such a priori knowledge is not currently very
82
accurate, and as such, it will likely lead to very uncertain parameter distributions and
83
consequently very uncertain model predictions. Instead of incorporating different parameter
84
values for different time periods in model predictions, Gharari et al. [2013] presented an
85
approach that tests the model performance on different sub-periods and selects a parameter set
86
that is as close as possible to the optimum parameter values of each individual sub-period.
87
Razavi and Araghinejad [2009] utilized a forgetting factor approach in order to account for
88
environmental change in model calibration, in particular to address the potential non-stationarity
89
problems in time-series modelling, such that older observations have less influence on calibrated
90
parameter values.
91
This study develops a computationally efficient framework for hydrologic model
92
automatic calibration for watersheds with long periods of available data. This framework aims to
93
utilize full-length data periods in model calibration (called “full period” hereafter) while
94
reducing computational burdens by using representative short periods for most of the model runs
95
and running the model over the full period only for selected candidate parameter sets. Most of
96
these candidates are identified to be promising solutions based on the information obtained from
4
97
model runs on a short period. Like the majority of hydrologic model calibration approaches, this
98
framework aims at finding a single set of parameter values that is optimal considering the full
99
calibration period. The proposed framework has roots in surrogate modelling which is concerned
100
with developing and utilizing more efficient but lower-fidelity models as surrogates of
101
computationally intensive high-fidelity (original) models [Razavi et al., 2012]. There are two
102
general families of surrogate modelling strategies: 1- response surface surrogates which utilize
103
statistical or data-driven function approximation methods such as kriging and neural networks to
104
emulate one (or multiple) response(s) of an original model [Broad et al., 2010; Johnson and
105
Rogers, 2000; Regis and Shoemaker, 2007; Yan and Minsker, 2011], and 2- lower-fidelity
106
physically-based surrogates which are simplified models of the original system of interest and
107
conceptually or directly preserve its governing physics [Forrester et al., 2007; Mondal et al.,
108
2010; Robinson et al., 2008]. The proposed framework in this study shares some features with
109
lower-fidelity physically-based surrogate modelling when used for model calibration. However,
110
a major difference is that instead of using surrogate models, the proposed framework solely
111
works with original high-fidelity models but defines and uses “surrogate data” (i.e., short period
112
data).
113
The framework developed in this study enables the more efficient navigation through the
114
parameter space of computationally intensive hydrologic models being calibrated on long data
115
periods and identify the parameter sets of interest (i.e., optimal values over full-length calibration
116
periods) within limited computational timeframes. Like some benchmark studies in the field
117
[e.g., Duan et al., 1992; Tang et al., 2006; Vrugt et al., 2003], this paper focuses on efficient and
118
effective calibration of hydrologic models, and addressing the common issues with model
119
validation with optimized parameters are beyond the scope of this paper. In practice, hydrologic
5
120
model calibration should be followed by a validation step to test the credibility of the calibrated
121
model for the purpose. Therefore, like any other calibration framework, the optimal parameter
122
sets found may need to be validated over an independent set of data (not used for calibration)
123
measured at the gauge used for calibration or other gauges depending on the specific modelling
124
objectives. Interested readers are referred to the work of Klemes [1986] and Refsgaard and
125
Knudsen [1996] who developed and formalized different validation methods for hydrologic
126
simulation models for different purposes.
127
2. Basic Concepts
128
The proposed framework is based on the principle that the performances of a hydrologic model
129
on different data periods are correlated. The magnitude of such correlations varies for different
130
pairs of data periods from very low (perhaps even negligible) for periods with distinctly different
131
hydrologic conditions to very high for periods experiencing similar conditions. Assuming the
132
performance of a hydrologic model is measured by an error function (e.g., mean squared errors),
133
Figure 1 compares the true error function of a hydrologic model (i.e., running on a full
134
calibration period) with three possible surrogate error functions of the same model when running
135
on three different short periods. Figure 1a represents a case where the short period is a good
136
(almost ideal) representative of the full period such that there is a high level of correlation
137
(agreement) between the model performance over the full and short periods. Figure 1b shows a
138
moderate level of correlation where the model performance over the short period almost captures
139
both modes (local and global optima) of the model performance over the full period but the
140
global optimum in the short period performance corresponds to the local optimum of the
141
performance on the full period. The short periods represented in Figure 1a and Figure 1b can be
6
142
very helpful in calibrating the hydrologic model. Conversely, Figure 1c represents a case where
143
the short period is quite misleading as there is a large level of discrepancy between the two
144
functions. This case may happen when the surrogate data period is unreasonably short and/or
145
when it does not include information that can activate most of the simulated processes that are
146
active in the full period.
147
Figure 2 hypothetically depicts possible relationships between the performance of a
148
hydrologic model on a full data period (i.e., full-period error function) versus the performance of
149
the same model on a short data period (i.e., short-period error function). In general, the full-
150
period error function value is monotonically increasing (linearly or non-linearly) with the short-
151
period error function value (the global relationship – see Figure 2a). Such a relationship can be
152
very useful in predicting the performance of a model on the full period using the results of a
153
model simulation over a short period and is the basis of the framework developed in the study.
154
However, there is some level of uncertainty (i.e., discrepancy from the global relationship)
155
associated with such relationships; this uncertainty becomes larger for less representative short
156
periods. Figure 2b demonstrates a case where the short period is very poor such that no clear
157
global relationship between the full-period and short-period error functions is identifiable – the
158
uncertainty level is excessively large. Conceptually, Figure 2a corresponds to the cases depicted
159
in Figure 1a and Figure 1b, while Figure 2b corresponds to the case demonstrated through Figure
160
1c.
161
Figure 3 depicts a conceptual (but presumably typical) example of the convergence trend of
162
an automatic calibration experiment when the optimization objective function to be minimized is
163
the short-period error function. The corresponding full-period error function is also shown in this
164
figure - the parameter sets found on the optimization convergence trajectory are also evaluated 7
165
by running the model over the full period. Early on in the search, reducing the short-period error
166
function would result in reducing the full-period error function as well; however, after some
167
point in the search, further reduction in the short-period error function would result in increasing
168
the full-period error function. This behaviour, which is analogous to “over-fitting” in statistics
169
and curve-fitting, indicates that solely relying on a representative short period may be efficient to
170
initially guide a calibration algorithm to the vicinity of the promising regions in the parameter
171
space, but it may become ineffective or even misleading in extracting near optimal parameter
172
sets. Note that if a short period is a perfect surrogate of a full period, solely calibrating a
173
hydrologic model to the short period would be accurate.
174
3. Methodology and Demonstration of Key Components
175
The framework developed in this study links a search engine with an interface to a hydrologic
176
simulation model which is set up to run over a full period of data and a representative short
177
period of data. A main component of this framework is a performance mapping system which is
178
on the basis of the concepts illustrated in Section 2. The performance mapping system was
179
designed such that it could minimize the uncertainties associated with the predictions of full-
180
period model performance based on representative short periods. As this framework also
181
evaluates select parameter sets over full calibration periods, the over-fitting issue raised in
182
Section 2 could be avoided. In this section, an example case study is used for demonstration of
183
the performance mapping system.
184
3.1. An Example Case Study
185
To illustrate the framework proposed, a SWAT2000 (Soil and Water Assessment Tool, version
186
2000) [Neitsch et al., 2001] hydrologic model calibration case study, originally developed by 8
187
Tolson and Shoemaker [2007a] to simulate streamflows into the Cannonsville Reservoir in New
188
York, was used. This automatic calibration case study seeks to calibrate 14 SWAT2000 model
189
parameters, subject to various range constraints, to measured flow at the Walton gauging station
190
(drainage area of 860 km2) by maximizing the Nash‐Sutcliffe coefficient for daily flow. In this
191
calibration case study, a total of nine years of data from January 1987 to December 1995 are
192
used in simulations such that the first three years are used as the initialization period and the
193
remaining six years are used as the calibration period (see Figure 4). In this case study, a single
194
model run over the nine-year period requires about 1.8 minutes on average to execute on a
195
2.8GHz Intel Pentium processor with 2 GB of RAM running the 32-bit Windows XP operating
196
system.
197
3.2. What is a representative short period?
198
Ideally, a short period of the full data period is deemed “representative” if the information
199
contained in the short period is sufficiently complete and diverse such that model calibration
200
experiments using the short period and the full period would yield almost identical results. Such
201
an ideal representative period with a short duration (reasonably shorter than the full data period)
202
may not necessarily exist in any watershed. In this study, “representative short period” refers to a
203
reasonably short sub-period (contiguous in time) of the full period of data over which the model
204
performance is reasonably well correlated with the model performance over the full period. For
205
demonstration, two different parts of the full period of data available for our case study were
206
selected as representative short periods (see Figure 4).
207
The representative short period (a) was selected arbitrarily without any prior
208
knowledge/analysis of the system to represent a case when the framework user cannot identify
209
the most appropriate representative short period. The only considerations in choosing this period 9
210
were to begin from a dry period for better model initialization and to finish at the end of a flow
211
recession period. The representative short period (a) was nine months preceded by four months
212
used for model initialization. The initialization part used was considerably shorter that the
213
initialization part of the original calibration problem with full calibration period for the sake of
214
efficiency. Generally, having a shorter initialization period in calibration may reduce the
215
credibility of calibrated parameter values, however, this does not matter as the proposed
216
framework uses such surrogate data only as a guide and the final calibrated parameter values will
217
be selected based on the model performance on full calibration data with long initialization
218
periods. A preliminary analysis was conducted to evaluate the correlation of the hydrologic
219
model performance over the representative short period (a) with the performance of the same
220
model over the full period. A total of 1000 (uniformly) random parameter sets were generated in
221
their specified ranges and evaluated through running the hydrologic model over the full period.
222
Values of mean squared errors (deviations of the simulated flows from observations, MSE) were
223
calculated over the full calibration period (i.e., six years) and the representative short period (a)
224
and plotted in Figure 5. According to this figure, the linear correlation between the MSE values
225
over the two periods is not very significant and the linear regression has an R2 value of 0.64. The
226
low correlation implies that the error function surfaces for the two periods are somewhat
227
dissimilar and the minimizer of one may not be close to the minimizer of the other.
228
Identifying the best representative short period requires prior analysis of the hydrologic
229
model performance over the full calibration data. Such pre-analyses may not be affordable in
230
practice with computationally intensive hydrologic models. However, for demonstration
231
purposes, we attempted to identify and use the best one-year period (preceded by an initialization
232
period) of the full data utilizing the full-period simulation results of 1000 random parameter sets.
10
233
To this end, the second representative short period was selected such that the linear correlation
234
between the short-period MSE values and the full-period MSE values was maximized (see
235
Figure 5) - a 12-month window was moved along the six years of data to find a linear regression
236
with maximum R2 value. The preceding six months (starting from a dry season) were used for
237
initialization. In general, higher correlations indicate higher degrees of similarity between the
238
short-period and full-period error function surfaces. When the two surfaces are very similar,
239
model calibration on the short period would be almost equivalent to calibration on the full
240
period. As explained in Section 3.3, the performance mapping system attempts to address and
241
formulate the dissimilarities between the two surfaces such that any short period demonstrating
242
at least a moderate level of correlation with the full period, such as representative short period
243
(a), can be used in the proposed framework. Note that the correlation analysis throughout Section
244
3 is on the basis of MSE for the sake of consistency. Similar results for calibration error
245
functions that are monotonic transformations of MSE, such as sum of squared errors, root mean
246
squared errors, and Nash-Sutcliffe coefficient of efficiency, can be directly derived from the
247
MSE-based analysis. Other calibration error functions including mean absolute error (MAE) and
248
mean log squared error (MLSE) are discussed in Section 4.
249
3.3. Performance Mapping
250
The performance mapping system developed in this study is on the basis of the relationships
251
conceptualized in Figure 2 and numerically derived for our case study in Figure 5. However,
252
instead of considering the short-period error function (e.g., MSE value over the short period) as
253
one single predictor, the mapping system disaggregates this function value into multiple values
254
corresponding to different sub-periods of the representative short period in order to reduce the
255
prediction errors. Each sub-period is to represent a distinct hydrologic behavior/aspect of the 11
256
data, for example, flood events, recession periods, dry periods, etc. This disaggregation enables
257
the mapping system to extract the most of the information contained in a representative short
258
period. Figure 6 shows the sub-periods used in the representative short periods of our case study.
259
The performance mapping system is to relate the performance of the model over all these sub-
260
periods to the performance of the model over the full period of data. The performance mapping
261
system consists of a regression model enhanced by a localized Gaussian deviation model, ( ),
262
based on the kriging concept in the form of:
263
( )
264
where
265
periods j,
266
∑
( )
(
( )
( ))
is the ith candidate parameter set,
(1)
( ) is the model error function value for sub-
is the regression coefficient for sub-period j,
( ) is the full-period error function. We considered
is the number of sub-periods, and ( )
(
) where
is the
267
mean squared of model errors over the sub-period j and ̂
268
predicted MSE value over the full period. The logarithmic transformation is used mainly to
269
generate a mapping system more sensitive and accurate for smaller MSE values. In automatic
270
calibration, accuracy of the mapping system becomes more important when the search
271
approaches the main regions of attractions (regions containing parameter sets with reasonably
272
small error functions). Moreover, the distribution of MSE values collected in the course of
273
calibration is typically skewed to the right mainly due to optimization algorithm search
274
strategies. As such, the logarithmic transformation transforms the inputs and outputs of the
275
mapping function in Equation (1) into a more normally distributed variable space. Other
276
transformations may also be used.
12
( ( )) where ̂ is the
277
The regression-Gaussian model in equation (1) was adopted from Sacks et al. [1989] and
278
implemented with the software package developed by Lophaven et al. [2002]. Best linear
279
unbiased predictor (BLUP) methodology was used to determine the coefficients of Equation (1).
280
This mapping function represents the global relationships by the regression component, while the
281
Gaussian component attempts to represent the residuals in the regression and also the non-linear
282
local relationships. The minimum number of input-output data sets that is mathematically
283
required to develop the mapping function and provide confidence intervals is n+2 (n is the
284
dimension of the function input space). Interested readers are referred to Sacks et al. [1989] and
285
Lophaven et al. [2002] for details on how to develop and fit the model. Notably, unlike
286
regression models, the mapping system developed is an exact interpolator for the input-output
287
sets used for developing/updating the system – the system would generate the exact model
288
performance (i.e., full-period MSE values) for the parameter sets that have been already
289
evaluated over the full data period and included in the input-output sets for the fitting of the
290
mapping system.
291
A representative short period may be disaggregated into multiple sub-periods in different
292
ways based on the hydrologist’s understanding of the processes in a case study or some
293
numerical analyses. The key is each sub-period should ideally represent a distinct hydrologic
294
behavior. For example, each flood event (from the beginning of rainfall or the associated flow
295
rising limb to the end of the flow recession curve) may be considered as a distinct sub-period.
296
Alternatively, rising limbs, falling limbs, recession parts, or long dry periods may constitute
297
different sub-periods. Similar events may be deemed as one sub-period. In this study, the sub-
298
periods of each representative short period shown in Figure 6 were objectively selected through
299
some numerical analyses of the residual time series generated for 1000 random parameter sets in
13
300
Section 3.2 were used. All possible configurations of division points in time for different
301
numbers of sub-periods ranging from two to six were evaluated for both representative short
302
periods by fitting the mapping system with only the regression component ( ( ) was assumed to
303
be zero). The sub-period configurations that maximized the regression R2 value were selected.
304
For example, for the case of having two sub-periods (i.e., one division point) in the
305
representative short period (a), the first sub-period starts on January 1,1990 (the beginning of the
306
representative short period) and ends at the division point where the second sub-period starts
307
from and continues to the end of the period (i.e., September 30, 1991). Assuming a sub-period
308
could not be shorter than a week, the division point varied from January 8, 1990 to September
309
23, 1991 resulting in 263 configurations to be tested. In our case study, the representative short
310
periods (a) and (b) were disaggregated into five and four sub-periods, respectively. Notably, all
311
the division points of the configurations for sub-periods which generated high R2 values coincide
312
with either the lowest or peak flows. We noticed that for a given representative short period,
313
there are many configurations for sub-periods starting or ending at peaks or lowest flows that can
314
generate a reasonably reliable regression model (i.e., with high R2).
315
To demonstrate the accuracy of the developed mapping system, 1000 new parameter sets
316
were generated randomly in their specified ranges and then the model was run for each
317
parameter set over the full period and the representative short periods (a) and (b) independently.
318
For each representative short period, the mapping system was developed using 100 of these
319
generated input-output sets (selected randomly) and then tested over the remaining 900 input-
320
output sets. Figure 7 shows the scatter plots of the actual full-period mean squared errors (MSE)
321
versus the predicted full-period MSE values for the 900 testing parameter sets. As can be seen,
322
the results of the mapping system are almost unbiased as the linear regressions plotted on this
14
323
figure are very close to the ideal (1:1) line. The dispersity of the points around the ideal line is
324
also reasonably low for both representative short periods as the R2 values are 0.92 and 0.96 for
325
the representative short periods (a) and (b), respectively. Replicating this analysis by different
326
100 randomly selected input-output sets of the 1000 generated sets yielded similar performance
327
mapping accuracies (results not reported here).
328
3.4. Search Engine
329
Any optimization algorithm may be used as the search engine in the framework; however in this
330
study, the covariance matrix adaptation-evolution strategy (CMA-ES) [Hansen and Ostermeier,
331
2001] was used. CMA-ES is a stochastic, derivative-free optimization algorithm that generates
332
candidate solutions according to an adaptive multivariate normal distribution. The covariance
333
matrix of this distribution which represents pairwise dependencies between variables is updated
334
iteratively in the course of optimization. Notably, CMA-ES does not need the actual objective
335
function values of the candidate solutions, and instead it only uses their rankings to learn the
336
specifications of the multivariate normal distribution. The algorithm has the form of (μ, λ)-CMA-
337
ES where μ and λ are the parent number and population size, respectively. At each iteration, λ
338
new candidate solutions are generated following the multivariate normal distribution, and then a
339
weighted combination of the μ best out of λ solutions is used to adapt the parameters of the
340
distribution (i.e., mean and covariance matrix) such that the likelihood of previously successful
341
candidate solutions and search steps is maximized/increased. Following the recommendations of
342
Hansen and Ostermeier [2001] for algorithm parameters, (5, 11)-CMA-ES was used for our case
343
study.
15
344
3.5. Calibration Framework using Surrogate Data
345
The framework developed in this study consists of two phases (see Figure 8). Phase 1 is basically
346
a conventional automatic calibration procedure which simply links the optimization algorithm to
347
the hydrologic model but running over the representative short period. As such, the optimization
348
algorithm generates candidate parameter sets, xi, for the hydrologic model with the objective of
349
minimizing the short-period error function, fs(xi). In phase 1, only the parameter sets that
350
improve the current best short-period error function value (i.e., fsbest) are also evaluated through
351
the hydrologic model over the full period of data. Phase 1 continues until a sufficient number of
352
parameter sets are evaluated over both short and full periods; the simulation results of these
353
parameter sets are then used to develop the performance mapping system. The performance
354
mapping system enables the framework to map the performance of new candidate parameter sets
355
on the short period (short-period error function) to their corresponding performance on the full
356
period (i.e., full-period error function). Notably, phase 1 is only active early in the search when
357
minimizing the short-period error function mainly corresponds to minimizing the full-period
358
error function (falling part of the full-period error function in Figure 3).
359
In phase 2, the optimization algorithm seeks the minimum of a new response surface
360
which is a surrogate of the full-period error function such that the majority of candidate
361
parameter sets are still only evaluated by the hydrologic model over the short period, but the
362
approximated full-period error function values, ̂ ( ), are returned to the optimizer. If the
363
approximated full-period error function value for a candidate parameter set is better than the
364
current best full-period error function value (i.e., ffbest), the parameter set is also evaluated by
365
running the hydrologic model over the full period.
16
366
Phase 2 can begin by re-starting the optimization algorithm from the best parameter set
367
found in phase 1 (e.g., by keeping the best parameter set of phase 1 in the initial population).
368
Alternatively, the optimization trial of phase 1 can continue through phase 2. However,
369
switching from one response surface to a different one potentially with a different response scale
370
when moving from phase 1 to phase 2 may corrupt some of the information the optimization
371
algorithm has collected and as such degrade the optimizer performance. For example, the mean
372
and covariance matrix of the multivariate normal distribution, which have evolved in the course
373
of a CMA-ES run in phase 1, may change abruptly at the beginning of phase 2. Defining the
374
“correction factor” at the end of phase 1 is intended to align the two surfaces in the vicinity of
375
the parameter sets in the last generation of the optimization algorithm in phase 1. The correction
376
factor, CF, is calculated as:
377
̅ ⁄̅
(2)
378
where ̅ is the best short-period error function and ̅ is its corresponding full-period error
379
function in the last population of the optimization algorithm in phase 1. At the end of phase 1,
380
the correction function is calculated, and since then (in phase 2) it acts as a constant multiplier
381
for all the error function values when returning to the optimization algorithm (See Figure 6).
382
Notably, the defined correction factor in Equation (2) is only one simple way out of many
383
possible ways to handle the scale differences. In case that the optimization algorithm re-starts at
384
the beginning of phase 2, CF can be ignored (CF=1). Moreover, depending on the optimization
385
algorithm used, there may be other conditions to account for in order to better preserve the
386
optimization algorithm behaviour. For example, in population-based optimization algorithms like
387
CMA-ES, it is advisable to evaluate all the individuals in a generation by the same function. To
17
388
this end, the framework developed only proceeds to phase 2 at the beginning of a new a CMA-
389
ES generation.
390
Both phase 1 and phase 2 reserve a small chance for any candidate parameter set to be
391
evaluated over the full period regardless of its performance over the short period. This chance is
392
controlled by a framework parameter, α, varying in the range of zero and one, zero indicating no
393
chance and one indicating all parameter sets are to be also evaluated over the full period. As
394
shown in Figure 8, after each model run over the short period, a uniform random number in the
395
range of zero and one (i.e., rnd) is generated; if rnd is smaller than α, the candidate parameter set
396
is also evaluated through running the model over the full period. This capability intends to
397
minimize the bias of the performance mapping system by providing and training the system to a
398
range of possible performances. In addition, this capability diminishes the risk of possible
399
framework failures in case the short period selected is not very informative. Larger α values
400
would increase the sample size of data used for developing the mapping system and make the
401
framework more robust, but this would come at the expense of increasing the overall
402
computational burden. The preliminary experiments with our case study demonstrated that the
403
proposed framework with α values being slightly greater than zero (e.g., 0.05-0.1) would be a
404
proper compromise between the framework efficiency and robustness. The optimal α value is
405
problem-specific and not known without extensive experimentation. The default α value for the
406
experiments in this study was set to 0.05.
18
407
4. Results and Discussion
408
4.1. Comparative Assessment
409
The three different approaches to model calibration, namely calibration solely on a representative
410
short period, calibration on the full period of data, and calibration through the proposed
411
framework, were evaluated and compared. Seven independent calibration experiments were run
412
for each approach with seven different random seeds and random starting points. The
413
comparisons were made within four different computational budget scenarios. Computational
414
budget was quantified by the total number of years that were simulated by the hydrologic model
415
over the course of each automatic calibration experiment and budgets of 450, 900, 1800, and
416
2250 years were considered. The smallest computational budget is equivalent to 50, 415, and 300
417
hydrologic model runs (optimization function evaluations) over the full period, representative
418
short period (a), and representative short period (b), respectively. The computational budget of
419
2250 years of simulation is equivalent to 250 (2250 years / 9 years), 2075 (2250 years / 1.083
420
years), and 1500 (2250 years / 1.5 years) objective function evaluations with full period,
421
representative short period (a), and representative short period (b), respectively.
422
Figure 9 shows the results of the numerical experiments. To be more interpretable, the
423
best MSE values found in the calibration experiments were transformed to their associated Nash-
424
Sutcliffe (N-S) coefficient values. The maximum Nash-Sutcliffe coefficient value (referred to as
425
“global optimum” in this figure) for this case study that has been previously identified through
426
extensive optimization is 0.85. As can be seen, model calibration on the full period improves
427
with the increase in the computational budget. However, model calibration solely on
428
representative short period (a) is not as robust, since the performance results of the calibrated
429
model when tested over the full period are more variable, and more importantly, do not improve 19
430
(may even degrade) with the increase in computational budget. Such degradations are obvious
431
between the computational budgets of 900 and 1800 years of simulation as the average N-S
432
value degrades from 0.68 to 0.63. This degradation is the result of over-fitting as illustrated in
433
Section 2 and Figure 3. Moreover, in one experiment, model calibration on representative short
434
period (a) failed to even find a parameter set with an N-S value of greater than 0.4. The proposed
435
framework with representative short period (a) performed consistently well in all the
436
computational budgets and outperformed the other two approaches in terms of the average
437
performance over the seven calibration experiments. At the largest computational budget
438
considered, the proposed framework with representative short period (a) was able to find a
439
parameter set close to the global optimum.
440
Figure 9 also demonstrates that representative short period (b) is a near perfect surrogate
441
of the full period as model calibration solely on this short period performed consistently well and
442
better than calibration on full period in all computational budgets. The proposed framework with
443
representative short period (b) also performed very well. In terms of the average N-S values over
444
the seven calibration experiments, the proposed performance worked better or almost equally
445
well at all computational budgets compared to the short-period calibration performance.
446
Moreover, the range of N-S values obtained by the proposed framework is smaller than the
447
corresponding ranges obtained by the two other approaches in all the computational budgets
448
except the smallest one.
449
The highest computational budget considered was not sufficient to enable the
450
conventional full-period calibration to approach the global optimum (the maximum N-S value
451
found with this approach is 0.75). Therefore, to further evaluate and compare the performance of
452
this framework, its seven calibration experiments were continued with a total budget of 1000 20
453
objective function evaluations (i.e., equivalent to 9,000 years of simulation). The average, best,
454
and worst N-S values found in these seven calibration experiments were 0.79, 0.83, and 0.76,
455
respectively. Whereas, the proposed framework with representative short period (b) at the
456
computational budget of 2,250 years of simulation attained the average, best, and worst N-S
457
values of 0.80, 0.84, and 0.77. As such, one may conclude that model calibration on the full
458
period with the budget of 9,000 years of simulation and the proposed framework with the budget
459
of 2,250 years of simulation performed comparably.
460
4.2. Impact of the parameter α
461
To evaluate the impact of the framework parameter α on the calibration results, the seven
462
replicates of the experiment with the proposed framework on the representative short period (a)
463
were repeated using an α value of zero. Figure 10 compares the average calibration results with α
464
values of 0, 0.05, and 1 for different computational budgets. Note that for α=1, the results shown
465
are the results of the calibration experiment directly on the full period. For the computational
466
budget of 450 years of simulation, the α value of zero helped the framework make the most of
467
this very limited computational budget as it outperformed the framework performance with the α
468
value of 0.05. However, for larger computational budgets, the framework with the α value of
469
0.05 is more effective. This demonstrates that the optimal α value for any given case study also
470
depends on the available computational budget. Obtaining the optimal α value for a case study
471
may not be computationally plausible; however, any small non-zero α value (say in the range of
472
0.05 and 0.1) seems to be an appropriate compromise between the framework efficiency and
473
robustness.
21
474
4.3. Impact of Calibration Error Functions
475
As demonstrated, the proposed framework is on the basis of the correlations between the model
476
performance on the full period and the performance of the same model on a representative short
477
period. As the model performance may be evaluated through different calibration error functions,
478
the significance of correlations and representativeness of a given short period may vary for
479
different error functions. Figure 11 shows such variations for three inherently different
480
calibration error functions, mean squared error (MSE), mean absolute error (MAE), and mean
481
log squared error (MLSE). Using the 1,000 randomly sampled parameter sets generated in
482
Section 3.2, linear regression models were fitted to map the performance of the hydrologic model
483
on the possible short periods to the model performance on the full period. For Figure 11a, a
484
window of nine months was moved along the full period to evaluate all possible nine-month
485
short periods. The length of the moving window in Figure 11b was 12 months. As can be seen,
486
the R2 value (i.e, the representativeness) of any given short period differs significantly for
487
different error functions. However, Figure 11b suggests that these differences are reduced for
488
longer representative short periods. The MLSE error function which focuses on low flows
489
demonstrates a totally different behavior than MSE and MAE, due to the fact that the model
490
performance on high flow periods may not be a representative of the model performance in
491
reproducing low flows on the full periods.
492
Further calibration experiments were conducted to evaluate the proposed framework with the
493
MAE error function. To be consistent with the previous experiments, the representative short
494
period (a) with the same sub-periods as shown in Figure 6a was used. Similar to Figure 9, Figure
495
12 compares the calibration results of seven randomly seeded replicates for the three approaches
496
under different computational budgets when the calibration error function is MAE. As shown,
22
497
calibration solely on representative short period (a) may fail to identify optimal parameter sets in
498
terms of MAE on the full period. However, the proposed framework enabled with this short
499
period is quite effective and is able to converge more efficiently to the optimal parameter sets
500
than the calibration directly on the full period is.
501
4.4. Implications for Parameter Instabilities
502
Figure 13 shows the final parameter sets optimized with respect to the MAE error function on the
503
representative short period (a) and the full period (through the proposed framework). The
504
parameter values shown are those obtained in the seven replicates at the highest computational
505
budget considered. The parameter ranges are scaled in the range of zero and one. As can be seen,
506
the issue of “non-uniqueness” is significant for the majority of the parameters in this case study
507
(this is consistent with our previous work with this case study). The parameters SFTMP,
508
SMTMP, and AWC_f seem to be most sensitive to the calibration period. On the other hand, the
509
parameters GW_DELAY and CN2_f seem to be the most stable parameters. The details of the
510
parameters and their actual ranges can be found in Tolson and Shoemaker (2007b).
511
5. Relations to Surrogate Modelling
512
The framework proposed in this work shares certain features with strategies for lower-fidelity
513
physically based surrogate modelling. Lower fidelity surrogates are simplified models which
514
directly or conceptually preserve the physical processes in the real-world system. In general,
515
there are many different ways with multiple subjective decisions to develop a lower-fidelity
516
surrogate model for a given case study. For example in the hydrologic modelling context, a fully-
517
distributed hydrologic model may be deemed the highest-fidelity model, while a semi-distributed
518
model or a lumped model may be considered as lower-fidelity models. A low-fidelity hydrologic 23
519
model may also ignore some physical processes simulated in a high-fidelity hydrologic model.
520
One common challenge with any surrogate modelling strategy is the identification of the best
521
way to develop a surrogate model for a given case study. The other challenge in developing and
522
utilizing some (not all) lower-fidelity surrogate models is how to map their parameter space to
523
the original model parameter space [Bandler et al., 2004; Robinson et al., 2008]. Such a mapping
524
is not always trivial and may introduce a great deal of uncertainty in a calibration experiment.
525
The proposed framework parallels the primary objective of surrogate modelling which is
526
to circumvent the computational burden of optimization attempts involving computationally
527
demanding models. However, instead of a lower-fidelity model as the surrogate, the proposed
528
framework utilizes the original, high-fidelity model but runs it over a surrogate calibration period
529
which is a representative short period of the full available data period. As such, the proposed
530
framework evades the two aforementioned challenges as it preserves the original model
531
parameters, complexity and processes simulated.
532
As outlined in Razavi et al. [2012], there are various methodologies in the literature to
533
make use of surrogate models in model calibration and optimization. In some studies, surrogate
534
models after being developed are treated as if they are high-fidelity representations of the real-
535
world systems of interest and fully replace the original models [e.g., McPhee and Yeh, 2008;
536
Siade et al., 2010; Vermeulen et al., 2005; Vermeulen et al., 2006]. Such a strategy can be
537
deemed analogous to the strategy for hydrologic model calibration which identifies and solely
538
relies on a representative short data period. There are some other studies addressing the
539
discrepancies between surrogate and original models [e.g., Bandler et al., 2004; Cui et al., 2011;
540
Forrester et al., 2007; Robinson et al., 2006]. Similar to the proposed framework, these studies
541
develop strategies to predict the response (e.g., a performance metric) of a high-fidelity model as 24
542
a function of parameter values and the corresponding response of a surrogate model. However,
543
the performance mapping system developed in the proposed framework is unique in two ways.
544
Unlike common surrogate modelling strategies, 1- model parameters are not directly involved in
545
the mapping system as predictors, and 2- the response of the faster-to-run model is disaggregated
546
into multiple factors (i.e., performance over independent events) inputting into the mapping
547
system to extract the most out of the available response. Importantly, since the mapping system
548
does not involve the model parameters in the approximation procedure (as inputs to the mapping
549
function), the limitations of common surrogate modeling strategies associated with high-
550
dimensional problems (e.g., calibration problems with large numbers of model parameters – see
551
Razavi et al. [2012] for surrogate modelling limitations) may be reduced or diminished.
552
Unlike the proposed framework, most strategies for surrogate modelling use Design of
553
Experiments (DoE) at the beginning of the search to empirically capture the general form of the
554
underlying function, e.g., a “correction function” representing the difference between the
555
responses of lower-fidelity and original models [Razavi et al., 2012]. DoE is an essential part of
556
many surrogate modelling strategies and is very helpful to generate an unbiased estimate of the
557
general form of the function, but at some relatively large computational costs (e.g., 10-20% of
558
the total computational budget). The proposed framework does not fundamentally need such
559
computationally demanding experiments since unlike the common correction function
560
approaches used in lower-fidelity surrogate modelling which are purely empirical [see Razavi et
561
al. 2012 for details], the developed performance mapping system make use of the hydrological
562
and statistical characteristics of the model responses to establish the relationships.
25
563
6. Conclusions
564
This study proposed a framework for efficient hydrologic model calibration on long data periods.
565
This framework becomes appealing when a hydrologic model of interest is computationally
566
expensive and its run-time on such long periods is a few minutes or more. The framework is
567
based on the fact that there are certain relationships between a hydrologic model performance on
568
the full-length data and its corresponding performance on a representative short period of data
569
(i.e., surrogate data). By extracting such relationships, a mapping system was developed to
570
approximate the full-period model performance given the model performance on the surrogate
571
data. A calibration framework utilizing this mapping system was proposed in which the majority
572
of candidate parameter sets are evaluated by running the model on the surrogate data, and the
573
full-length data are only used to evaluate select candidate parameter sets in the course of
574
calibration. Numerical experiments showed that this framework can increase calibration
575
efficiency while being robust, as within a smaller computational budget, it can lead to calibration
576
solutions close to the optimal solution of the full-period calibration problem. Results also
577
demonstrated that the framework can work very well when the selected surrogate data period has
578
only a moderate level of representativeness (i.e., not the best representative sub-period of a full-
579
length data period) which is typically identifiable by experts’ knowledge. In general, experts'
580
knowledge is necessary to select an appropriate representative sub-period of a full-length data
581
period.
582
The proposed framework may be categorized under the large umbrella of surrogate
583
modeling with the major distinction that unlike common surrogate modeling strategies which
584
utilize a fast-to-run surrogate model of an original high-fidelity model, this framework defines
585
surrogate data and only uses the original high-fidelity model. Future extensions to the proposed 26
586
framework may incorporate the approximation uncertainty estimate for model performance
587
predictions (i.e., the variance of errors associated with each prediction) that the developed
588
mapping system is capable of producing [see Sacks et al., 1989]. Moreover, the proposed
589
framework can be extended and modified to be used in conjunction with uncertainty-based
590
approaches to hydrologic model calibration such as GLUE or different Markov-chain Monte
591
Carlo techniques. Such extensions may also involve the approximation uncertainty of
592
performance mapping.
593
Acknowledgements
594
The authors would like to thank the four anonymous reviewers whose comments significantly
595
helped in improving this paper. The first author was financially supported by Ontario Graduate
596
Scholarship, which is hereby acknowledged.
597
References:
598 599
Alexandrov, N. M., and R. M. Lewis (2001), An overview of first-order approximation and model management in optimization, Optimization and Engineering, 2, 413–430.
600 601 602
Andreassian, V., C. Perrin, C. Michel, I. Usart-Sanchez, and J. Lavabre (2001), Impact of imperfect rainfall knowledge on the efficiency and the parameters of watershed models, Journal of Hydrology, 250(1-4), 206-223.
603 604 605
Bandler, J. W., Q. S. S. Cheng, S. A. Dakroury, A. S. Mohamed, M. H. Bakr, K. Madsen, and J. Sondergaard (2004), Space mapping: The state of the art, Ieee Transactions on Microwave Theory and Techniques, 52(1), 337-361.
606 607 608
Broad, D. R., H. R. Maier, and G. C. Dandy (2010), Optimal Operation of Complex Water Distribution Systems Using Metamodels, Journal of Water Resources Planning and Management-Asce, 136(4), 433-443.
609 610 611
Cui, T., Fox, C. , and M. J. O'Sullivan (2011), Bayesian calibration of a large scale geothermal reservoir model by a new adaptive delayed acceptance Metropolis Hastings algorithm, Water Resour. Res., doi:10.1029/2010WR010352, in press.
612 613
Duan, Q. Y., S. Sorooshian, and V. Gupta (1992), Effective and efficient global optimization for conceptual rainfall-runoff models, Water Resources Research, 28(4), 1015-1031.
614 615 616
Forrester, A. I. J., A. Sobester, and A. J. Keane (2007), Multi-fidelity optimization via surrogate modelling, Proceedings of the Royal Society a-Mathematical Physical and Engineering Sciences, 463(2088), 3251-3269.
27
617 618 619
Gharari, S., M. Hrachowitz, F. Fenicia, and H. H. G. Savenije (2013), An approach to identify time consistent model parameters: sub-period calibration, Hydrology and Earth System Sciences, 17(1), 149-161.
620 621
Gupta, V. K., and S. Sorooshian (1985), The relationship between data and the precision of parameter estimates of hydrologic-models, Journal of Hydrology, 81(1-2), 57-77.
622 623
Hansen, N., and A. Ostermeier (2001), Completely derandomized self-adaptation in evolution strategies, Evolutionary Computation, 9(2), 159-195.
624 625
Johnson, V. M., and L. L. Rogers (2000), Accuracy of neural network approximators in simulationoptimization, Journal of Water Resources Planning and Management-Asce, 126(2), 48-56.
626 627 628
Juston, J., J. Seibert, and P.-O. Johansson (2009), Temporal sampling strategies and uncertainty in calibrating a conceptual hydrological model for a small boreal catchment, Hydrological Processes, 23(21), 3093-3109.
629 630
Klemes, V. (1986), Operational testing of hydrological simulation-models, Hydrological Sciences Journal-Journal Des Sciences Hydrologiques, 31(1), 13-24.
631 632
Lophaven, S. N., H. B. Nielsen, and J. Sondergaard (2002), DACE: AMATLAB Kriging toolbox version 2.0,Technical Report IMM-TR-2002-12, Technical University of Denmark, Copenhagen.Rep.
633 634 635
McPhee, J., and W. W. G. Yeh (2008), Groundwater management using model reduction via empirical orthogonal functions, Journal of Water Resources Planning and Management-Asce, 134(2), 161170.
636 637
Merz, R., J. Parajka, and G. Bloeschl (2011), Time stability of catchment model parameters: Implications for climate impact analyses, Water Resources Research, 47.
638 639 640
Mondal, A., Y. Efendiev, B. Mallick, and A. Datta-Gupta (2010), Bayesian uncertainty quantification for flows in heterogeneous porous media using reversible jump Markov chain Monte Carlo methods, Advances in Water Resources, 33(3), 241-256.
641 642 643
Neitsch, S. L., J. G. Arnold, J. R. Kiniry, and J. R. Williams (2001), Soil and Water Assessment Tool theoretical documentation version 2000: Draft–April 2001, 506 pp., Agric. Res. Serv., U.S. Dep. of Agric., Temple, Tex.Rep.
644 645 646
Perrin, C., L. Oudin, V. Andreassian, C. Rojas-Serna, C. Michel, and T. Mathevet (2007), Impact of limited streamflow data on the efficiency and the parameters of rainfall-runoff models, Hydrological Sciences Journal-Journal Des Sciences Hydrologiques, 52(1), 131-151.
647 648
Razavi, S., and S. Araghinejad (2009), Reservoir Inflow Modeling Using Temporal Neural Networks with Forgetting Factor Approach, Water Resources Management, 23(1), 39-55.
649 650
Razavi, S., B. A. Tolson, and D. H. Burn (2012), Review of surrogate modeling in water resources, Water Resources Research, 48.
651 652
Refsgaard, J. C., and J. Knudsen (1996), Operational validation and intercomparison of different types of hydrological models, Water Resources Research, 32(7), 2189-2202.
653 654
Regis, R. G., and C. A. Shoemaker (2007), A stochastic radial basis function method for the global optimization of expensive functions, Informs Journal on Computing, 19(4), 497-509.
655 656 657 658
Robinson, T. D., M. S. Eldred, K. E. Willcox, and R. Haimes (2006), Strategies for Multifidelity Optimization with Variable Dimensional Hierarchical Models, in In: 47th AIAA/ASME/ASCE/AHS/ASC Structures, Structural Dynamics, and Materials Conference, AIAA Paper 2006-1819, edited, Newport, Rhode Island, May 1-4
28
659 660 661
Robinson, T. D., M. S. Eldred, K. E. Willcox, and R. Haimes (2008), Surrogate-Based Optimization Using Multifidelity Models with Variable Parameterization and Corrected Space Mapping, Aiaa Journal, 46(11), 2814-2822.
662 663
Sacks, J., W. J. Welch, T. J. Mitchell, and H. P. Wynn (1989), Design and analysis of computer experiments Statistical Science, 4(4), 409-435.
664 665
Siade, A. J., M. Putti, and W. W. G. Yeh (2010), Snapshot selection for groundwater model reduction using proper orthogonal decomposition, water resources research, 46.
666 667
Singh, S. K., and A. Bardossy (2012), Calibration of hydrological models on hydrologically unusual events, Advances in Water Resources, 38, 81-91.
668 669
Tang, Y., P. Reed, and T. Wagener (2006), How effective and efficient are multiobjective evolutionary algorithms at hydrologic model calibration?, Hydrology and Earth System Sciences, 10(2), 289-307.
670 671
Thokala, P., and J. R. R. A. Martins (2007), Variable-complexity optimization applied to airfoil design, Engineering Optimization, 39(3), 271-286.
672 673
Tolson, B. A., and C. A. Shoemaker (2007a), Cannonsville Reservoir Watershed SWAT2000 model development, calibration and validation, Journal of Hydrology, 337(1-2), 68-86.
674 675
Tolson, B. A., and C. A. Shoemaker (2007b), Dynamically dimensioned search algorithm for computationally efficient watershed model calibration, Water Resources Research, 43(1).
676 677
Vermeulen, P. T. M., A. W. Heemink, and J. R. Valstar (2005), Inverse modeling of groundwater flow using model reduction, water resources research, 41(6).
678 679
Vermeulen, P. T. M., C. B. M. t. Stroet, and A. W. Heemink (2006), Model inversion of transient nonlinear groundwater flow models using model reduction, water resources research, 42(9).
680 681
Vrugt, J. A., H. V. Gupta, L. A. Bastidas, W. Bouten, and S. Sorooshian (2003), Effective and efficient algorithm for multiobjective optimization of hydrologic models, Water Resources Research, 39(8).
682 683 684
Vrugt, J. A., H. V. Gupta, S. C. Dekker, S. Sorooshian, T. Wagener, and W. Bouten (2006), Application of stochastic parameter optimization to the Sacramento Soil Moisture Accounting Model, Journal of Hydrology, 325(1-4), 288-307.
685 686
Wagener, T. (2007), Can we model the hydrological impacts of environmental change?, Hydrological Processes, 21(23), 3233-3236.
687 688 689
Xia, Y. L., Z. L. Yang, C. Jackson, P. L. Stoffa, and M. K. Sen (2004), Impacts of data length on optimal parameter and uncertainty estimation of a land surface model, Journal of Geophysical ResearchAtmospheres, 109(D7).
690 691 692
Yan, S., and B. Minsker (2011), Applying Dynamic Surrogate Models in Noisy Genetic Algorithms to Optimize Groundwater Remediation Designs, Journal of Water Resources Planning and Management-Asce, 137(3), 284-292.
693 694
Yapo, P. O., H. V. Gupta, and S. Sorooshian (1996), Automatic calibration of conceptual rainfall-runoff models: Sensitivity to calibration data, Journal of Hydrology, 181(1-4), 23-48.
695 696 697
Zhang, H., G. H. Huang, D. Wang, and X. Zhang (2011), Multi-period calibration of a semi-distributed hydrological model based on hydroclimatic clustering, Advances in Water Resources, 34(10), 12921303.
698 699
29
700
30
Model Error Function
Full period
Short period
(a) Parameter
701
Model Error Function
Full period Short period
(b) Parameter
702
Model Error Function
Full period Short period
(c)
703
Parameter
704
Figure 1 – Conceptual examples of the performance of a hydrologic model with one parameter
705
running over different short calibration periods out of a long data period (full period) along with
706
the model performance over the full period: (a) a well representative short period, (b) a
707
moderately representative short period, and (c) a poor (misleading) short period
708 709
31
Error Function over full period
710
(a)
Extent of Discrepancy (Uncertainty) between Model Performances
Error Function over short period
Error Function over full period
711 (b)
712
Error Function over short period
713
Figure 2- Hypothetical relationship examples between the performance of a hydrologic model
714
over a full period and the performance of the same model over (1) a representative and (2) a poor
715
short periods – each point in the scatter plots represents a random parameter set that is evaluated
716
by the model over the different periods
717 718 719 720 721
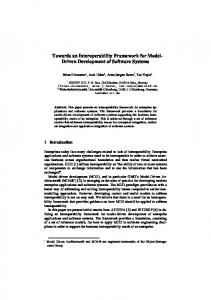
32
Model Error Function
Full period Short period
Optimization Progress (e.g., Iteration Number)
722 723
Figure 3- A hypotetical example of optimization convergence trend when minimizing the model
724
error function over a short period of data along with the coresponding error function values
725
calculated over the full period
726 727 728 729 730 731 732 733 734 735 736 737
33
400
Initialization Period (3 years)
Daily Flow (cms)
350
Calibration Period (6 years)
300 250
Initialization Period
Initialization Period
Representative Short Period (a) (9 months)
(4 months)
Representative Short Period (b)
(6 months)
(12 months)
200
150 100 50 0
1
01-Jan-1987 9 8 7
738
11 99 88 88
11 99 88 99
11
01-Jan-1990 99 99 00
11 99 99 11
Time Month-Year
11 99 99 22
11 99 99 33
11 99 99 44
11 9931-Dec-1995 99 55
739
Figure 4- Streamflow time series at Walton gauging station in Cannonsville Reservoir watershed
740
over a nine-year period used for SWAT model calibration
741
34
MSE on Full Period
2000
1500
1000
500
y = 0.86x + 185 R² = 0.64 0 0
500
1000
1500
2000
MSE on Representative Short Period (a)
742 2000
MSE on Full Period
1500
1000
500
y = 0.98x - 52.7 R² = 0.94 0 0
500
1000
1500
2000
MSE on Representative Short Period (b)
743 744
Figure 5- Scatter plots of the mean squared errors (MSE) calculated over the full period versus
745
the MSE calculated over the representative short periods for 1000 randomly generated parameter
746
sets
747 748 749
35
100
Sub-period 4
Sub-period 3
Daily Flow (cms)
120
Representative Short Period (a) Sub-period 2
Initialization Period
140
Sub-period 1
160
Sub-period 5
80 60 40
20 0
1 13 25 37 49 61 73 85 97 109121133145157169181193205217229241253265277289301313325337349361373385
01-Sep-1989
01-Jan-1990
30-Sep-1990
Time 180
Sub-period 1
Daily Flow (cms)
140 120 100
Sub-period 3
Sub-period 4
Representative Short Period (b)
Initialization Period
160
Sub-period 2
750
80 60 40 20 0
1 18 35 52 69 86 103120137154171188205222239256273290307324341358375392409426443460477494511528
06-Sep-1993
06-Mar-1994
05-March-1995
Time
751 752
Figure 6- Two different representative short periods of the full period of data and the sub-periods
753
used for performance mapping
36
2000
Actual MSE on Full Period
Prediction based on Representative Short Period (a) 1500
1000
y = 1.02x - 8.57 R² = 0.92
500
0 0
500
1000
1500
2000
Predicted MSE on Full Period
754
Actual MSE on Full Period
2000
Prediction based on Representative Short Period (b) 1500
1000
y = 0.99x - 0.88 R² = 0.96
500
0 0
755
500
1000
1500
2000
Predicted MSE on Full Period
756
Figure 7- Scatter plots of the actual sum of squared errors (SSE) values over the full period
757
versus the predicted SSE values for the same data period for 900 randomly generated parameter
758
sets – the mapping (prediction) system is developed based on the model performance results over
759
100 randomly generated parameter sets (independent of the 900 parameter sets)
760 761
37
Phase 1
Phase 2
Optimization Algorithm
Optimization Algorithm ^
xi
Hydrologic Model over Short Period
fs(xi)
Hydrologic Model over Full Period k=k+1
CF. ff (xi)
xi
rnd