An Efficient GPU-based Time Domain Solver for the Acoustic Wave Equation Ravish Mehraa,1 , Nikunj Raghuvanshib , Lauri Saviojac , Ming C. Lina , Dinesh Manochaa a Department
of Computer Science, 201 South Columbia Street, University of North Carolina at Chapel Hill, NC 27599-3175 USA b Microsoft Research, One Microsoft Way, Redmond WA 98052-6399 USA c Department of Computer Science, Aalto University School of Science and Technology, P.O. Box 5400 FIN-02015 HUT Finland
Abstract An efficient algorithm for time-domain solution of the acoustic wave equation for the purpose of room acoustics is presented. It is based on adaptive rectangular decomposition of the scene and uses analytical solutions within the partitions that rely on spatially invariant speed of sound. This technique is suitable for auralizations and sound field visualizations, even on coarse meshes approaching the Nyquist limit. It is demonstrated that by carefully mapping all components of the algorithm to match the parallel processing capabilities of graphics processors (GPUs), significant improvement in performance is gained compared to the corresponding CPU-based solver, while maintaining the numerical accuracy. Substantial performance gain over a high-order finite-difference time-domain method is observed. Using this technique, a 1 second long simulation can be performed on scenes of air volume 7500 m3 till 1650 Hz within 18 minutes compared to the corresponding CPU-based solver that takes around 5 hours and a high-order finite-difference time-domain solver that could take up to three weeks on a desktop computer. To the best of the authors’ knowledge, this is the fastest time-domain solver for modeling the room acoustics of large, complex-shaped 3D scenes that generates accurate results for both auralization and visualization. Keywords: Time-domain wave equation solver, Room acoustics, GPU-based algorithms.
1. Introduction Computational methods in room acoustics have been an active area of research and developed in conjunction with diverse fields, such as seismology, geophysics, meteorology, for almost half a century. The goal of computational acoustic methods in games and interactive applications, in room acoustics computation, is auralization: generating audio that, when played, mimics the aural experience of actually being in the space. Nevertheless, achieving good acoustics in large complex structures remains a major computational challenge [1]. Since numerical acoustic computations are usually not possible in real-time, especially for frequencies in the kilohertz range, auralization is usually a two-stage process: precomputation of impulse responses from the space and real-time convolution of the impulse responses with dry (i.e. anechoically recorded or synthetically generated) source signals. The impulse response computation requires an accurate calculation of wave propagation for modeling the time-varying spatial sound field. Another important goal in room acoustic modeling is visualization of this sound field. The ability to visualize and animate transient acoustic phenomena is extremely helpful in intuitively understanding physically complex acoustic effects such as diffraction, scattering and interference [2] and forms an effective tool for educational purposes. In future, it could even be used for practical engineering applications like noise control and architectural acoustics, by helping engineers to quickly locate the geometric features responsible for acoustical defects. 1.1. Acoustic wave equation The physics of room acoustics, as well as many other areas, is described by the well known time-domain formulation of the 1 Author to whom correspondence should be addressed. Electronic mail:
[email protected], Phone : +1 919-962-1923, Fax: +1 (919) 962-1799.
Preprint submitted to Applied Acoustics
wave equation – ∂2 p − c2 ∇2 p = f (x, t) . ∂t2
(1)
The wave equation models sound waves as a time-varying pressure field, p (x, t). While the speed of sound in air (denoted c) exhibits slight fluctuations within a room due to variations in temperature and humidity, we ignore the acoustic effects of such small fluctuations in this paper i.e. we assume uniform media. We chose a value of c = 340ms−1 corresponding to dry air at 20 degrees centigrade. Volume sound sources in the scene are modeled by the forcing field denoted f (x, t) on the right ∂2 ∂2 ∂2 hand side in the Equation 1. The operator ∇2 = ∂x 2 + ∂y2 + ∂z2 is the Laplacian in 3D. The wave equation succinctly captures wave phenomena such as interference and diffraction that are observed in reality. Both the goals of acoustic auralization and visualization, can be fulfilled by time-domain solvers for the acoustic wave equation. 1.2. Computational challenges One of the key challenges in time-domain wave-based acoustic simulation is the computational and memory requirements of an accurate solver. Finite difference solvers, in order to maintain low errors, require the spatial discretization to contain 6−10 samples per wavelength for the highest usable frequency of interest [3, 4, 5]. Errors manifest themselves as numerical dispersion, where higher frequencies travel slower on the numerical grid than lower frequencies, leading to phase errors [5]. To give a quick example of the resulting requirements, if the entire frequency range of human hearing needs be simulated (i.e. up to 22 kHz), then the spacing between the nodes would have to be 1.5 − 2.5 mm. As a result, a cubic meter of acoustic space June 22, 2011
needs to be filled with 64 − 300 million grid cells, and the complexity increases proportionally with the volume of the acoustic space. Due to this, prior numerical solvers for the acoustic wave equation have very high computational demands, especially for broadband simulations extending into the kilohertz range, requiring a cluster of machines for execution. Thus, traditional room acoustic simulation systems have largely relied on geometric acoustic techniques. But these techniques are accurate only for higher frequencies and early reflections, and face considerable difficulties for modeling wave diffraction effects. Our formulation is based on the adaptive rectangular decomposition (ARD) technique proposed by Raghuvanshi et al. [6]. ARD results in little numerical dispersion error as compared to finite difference methods, allowing for execution on a very coarse grid, approaching the Nyquist limit. This leads to substantial speedups [6]. The ARD technique assumes an isotropic, homogeneous, dissipation-free medium. The assumptions of isotropy and homogeneity are critical for the speedup and accuracy of the technique. It has been demonstrated recently that impulse responses computed using ARD can be used for perceptually plausible auralizations in interactive applications such as computer games [7]. These reasons, along with the fact that it has been demonstrated to work for both auralization [7, 8] and visualization purposes [6], motivated our choice of this technique. For auralization and visualization videos, please checkout the supplementary materials or the link [9].
current GPU architectures and exploit the computational power of the high number of GPU processors. Running on current generation GPUs, our algorithm can yield a speedup of up to 25 times over the optimized CPU-based ARD solver. Our GPUbased solver is more than three orders of magnitude faster compared to a high-order CPU-based finite-difference time-domain (FDTD) solver. We show that the performance of our technique scales linearly with the number of GPU processors. In particular, ours is the first solver that can run a 1 second long bandlimited simulation of 1650 Hz for both auralization and visualization purposes, on scenes with realistically complex geometry and air volume in the range of 7, 500 m3 within 18 minutes on a desktop computer. The single-threaded optimized CPU-based ARD solver presented by Raghuvanshi et al. [6] takes 4 hours 40 minutes and the CPU-based high-order FDTD solver based upon Sakamoto et al. [4] takes 20 days to run the same simulation on a desktop machine2 . 2. Related Work 2.1. Numerical solvers for the wave equation Accurate high-frequency wave propagation is a very challenging computational problem because the smallest wavelength governs the grid resolution of the numerical methods and the scene can be thousands of wavelengths long in each dimension. There is a large body of existing work on solving the wave equation developed over the past few decades. These methods may be roughly classified into finite element method (FEM) [10], boundary element method (BEM) [11], finite-difference time-domain (FDTD) [5] and spectral methods [12]. Finite element method (FEM) solves for the pressure field on a volumetric mesh composed of discrete simplical cells. One of the strengths of FEM is the capability of using unstructured meshes with cells of different shapes, thus allowing the (potentially complex) boundary of the domain to be represented with much more accuracy. However, “skinny” cells can lead to inaccurate and/or unstable simulations. Generating good quality meshes in 3D for arbitrary domains is a tough problem and a central concern for FEM methods. Boundary element method (BEM) utilizes a boundary integral formulation that assumes a homogeneous medium and expresses field values throughout the domain in terms of values only on the boundary. Thus, BEM only requires a discretization of the boundary of the domain. Unfortunately, the resultant linear system is dense as all the surface values interact strongly with all the others. Both FEM and BEM are usually employed mainly for the steady-state wave (Helmholtz) equation, as opposed to the full time-domain wave equation, with FEM applied mainly to interior and BEM to exterior scattering problems. Recent work on the fast multipole accelerated frequencydomain BEM [13] has obtained very promising results, showing that an asymptotic performance gain can be achieved for
1.3. GPU computing Over the last decade, Graphics Processing Units or GPUs or graphics processors have evolved from fixed-function processors specialized for 3D graphics operations to a fully programmable computing platform for a wide variety of computationally demanding applications. Current GPUs are massively data-parallel throughput-oriented many-core processors capable of providing teraFLOPS of computing power and extremely high memory bandwidth compared to a high-end CPU. On the other hand, due to their distinctive and peculiar architecture, developing a fast and efficient algorithm that extracts the maximum performance from the GPU, is a challenging task. Traditional algorithms designed for scalar architectures (e.g. CPU) do not translate naturally to parallel architectures (e.g. GPU). In this paper, we present a fast and efficient parallel algorithm based on ARD for numerically solving the acoustic wave equation in the time-domain, entirely on the GPU. 1.4. Main results Our main contribution is the utilization of GPU architecture in combination with an efficient parallel technique, to allow for numerical wave simulation in the medium to high frequency range that was earlier extremely slow on a desktop computer. We exploit different levels of parallelism exhibited by ARD, prevent any host-device data transfer bottleneck in our algorithm design and perform a novel computationally optimal rectangular decomposition, resulting in an extremely fast and efficient solver for the wave equation. We demonstrate that it is possible to effectively parallelize all steps of our simulator on
2 We use NVIDIA GTX 480 as the GPU and Intel Xeon X5560 (8M Cache, 2.80 GHz) as the CPU.
2
frequency domain solution of acoustic problems, yielding performance that scales linearly with the surface area of the scene, instead of its volume, as in FEM/FDTD. The combination of BEM and Fast Multipole Method (FMM), represented as BEMFMM, is an attractive research direction, since it would allow handling acoustic spaces or models that are much larger than those handled by the current approaches [13]. Assuming that further research makes BEM-FMM applicable for large, complex scenes, applying this frequency-domain method for timedomain acoustics still requires a large number of frequencydomain simulations. The Finite Difference Time Domain (FDTD) method was explicitly designed for solving the time-domain wave equation by Yee [14], although in the context of electromagnetic simulation [5]. The FDTD method for room acoustics solves for the time-dependent pressure field on a Cartesian grid by making discrete approximations of the spatial derivative operators and using an explicit time-stepping scheme. Assume that the space has been discretized into a uniform Cartesian grid with spatial spacing h and the time-step is ∆t. We denote the pressure value p (ih, jh, kh) at time n∆t by p(n) i, j,k . In the absence of a superscript, it is assumed to be n . The spatial derivative is approximated in finite-difference approaches by applying a constant linear stencil, β, for some chosen integral value of d as – ∇2 p =
d ∑
( ) βl pi+l, j,k + pi, j+l,k + pi, j,k+l + O(h2d )
the computational expenditure low. This results in schemes that can run on spatial sampling as low as with ARD, thus allowing for competitive performance as presented here. However, the results presented in Savioja’s work [15] assume a high numerical dispersion threshold of 10%, for reducing computation times. Whether this numerical dispersion is tolerable for auralization and computation of room acoustic parameters is an open research problem. Once such thresholds have been established through listening tests, a direct comparison between IWB-FDTD, FDTD based upon work of Sakamoto et al. [4] and ARD, would become possible. For this paper, our comparisons are restricted to FDTD based upon Sakamoto et al. [4] and ARD. Spectral techniques achieve much higher accuracy than FEM/BEM/FDTD by expanding the field in terms of global basis functions. Typically, the basis set is chosen to be the Fourier basis or Chebyshev polynomials [12] as the fast fourier transform (FFT) can be employed for the basis transformation. The Fourier Pseudo-Spectral Time Domain (PSTD) method is a spectral method proposed by Liu [17] for underwater acoustics as an alternative to FDTD to control its numerical dispersion artifacts. The key difference in PSTD compared to FDTD is to utilize spectral approximations for the spatial derivative [17] – 2 ( ) i j2 k2 2 −1 2 2 2 ∇ p≈F −k F (p) , ki, j,k = 4π 2 + 2 + 2 (4) l x ly lz
(2)
where Discrete Fourier Transform is denoted by F . The spatial error shows geometric convergence ϵ s = O(hn ), ∀n > 0, n ∈ Z. This allows meshes with samples per wavelength approaching 2, the Nyquist limit, and still allowing vanishingly small dispersion errors in the spatial derivative. However, this holds only if the pressure field is periodic which is not commonly the case. Errors in ensuring periodicity appear as wrap-around effects where waves exiting from one end of the domain enter from the opposite end. Time update is done using a secondorder explicit scheme, as in Equation (3). Therefore, although spatial errors are controlled in PSTD, errors due to temporal derivative approximation are still present and are of a similar magnitude as FDTD.
l=−d
The spatial differentiation error is ϵ s = O(h2d ). The stencil has a compact support of 2d + 1. For most FDTD implementations, d = 1, yielding second-order spatial accuracy, with β = h12 {1, −2, 1}. The same analysis can be applied for the time derivative as well. It is typical in time-domain solvers to use second-order accurate time-stepping – ∂2 p ∂t2
(n)
=
) 1 ( (n+1) (n) (n−1) p − 2p + p + O(h2 ). h2
(3)
Standard von Neumann analysis can be used to show that the spatio-temporal errors in FDTD appears as frequencydependent phase velocity, known as numerical dispersion – as waves propagate, their shape is gradually destroyed due to loss of phase-coherence. For comparison in this paper, we have chosen a sixth-order accurate solver with d = 3 and β = 1 {2, −27, 270, −490, 270, −27, 2}, since it has smaller nu180h2 merical dispersion error than a second-order accurate scheme. Recently, FDTD has been applied to medium-sized scenes in 3D for room acoustic computations by Sakamoto et al. [3, 4]. The authors calculated typical room acoustic parameters and compared the calculated parameters with the actual measured values in the scene. The implementation can take days of computation on a small cluster. A very recent technique proposed by Savioja [15] can allow for real-time auralizations till a usable frequency of roughly 500 Hz on geometries with large volume using the Interpolated Wideband (IWB) FDTD scheme running on GPUs. The IWB-FDTD scheme [16] uses optimized compact stencils for reducing numerical dispersion while keeping
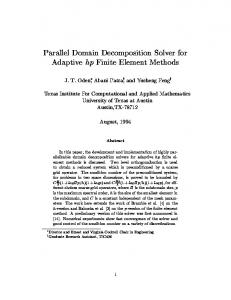
2.2. Geometric methods for the wave equation In the limit of infinite frequency, the wave equation reduces to the geometric approximation – expressing wave propagation as rays of energy quanta. The history of geometric methods for acoustics goes back roughly four decades [18]. Most present-day room acoustics software packages use geometric methods [19]. Recent work such as AD-FRUSTA [20], edgediffraction [21], beam tracing [22, 23], are able to accelerate these methods using ray and volume tracing. There has also been work on accelerating geometric techniques on the GPU [24, 25] 2.3. GPU architecture GPU architecture (see Figure 2) consists of a scalable array of streaming multiprocessors (SMs), each of which consists of a group of streaming processors (SPs), a fast (but small) 3
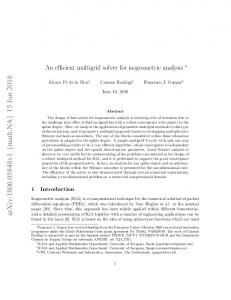
(a) Preprocessing
(b) Simulation
Figure 1: Stages of ARD: a) In the preprocessing stage, the input domain is voxelized into grid cells and adaptively decomposed into rectangular partitions. Artificial interfaces and PML absorbing layers are created between neighboring partitions and on the scene boundary respectively. b) During the simulation stage, we start with the current field and perform interface handling between neighboring partitions to compute forcing terms. We then transform the forcing terms to the cosine spectral basis through DCT. These are then used to update the spectral coefficients to propagate waves within each partition. Lastly, the field is transformed back from spectral to spatial domain using IDCT to yield the updated field.
on-chip shared memory and a SIMT control unit. All the multiprocessors are connected to a large off-chip global memory via a interconnection network. In order to effectively solve a problem on a GPU, first it has to be partitioned into coarse subproblems that can be solved independently in parallel by blocks of threads. These thread blocks are enumerated and distributed to the available SMs. Each sub-problem is further partitioned in smaller sub-sub-problems that can be solved on SPs cooperatively in parallel by all the threads within the block. The SM schedules and executes these threads in groups of parallel threads (typically 32) called warps. All the threads of a warp execute a single common instruction at a time. The first or the second half of a warp is called a half-warp. GPU memory access pattern is based on half-warps. A parallel task is executed on the GPU by writing functions called kernels which are launched by the host-CPU and execute in parallel on the GPU. GPU API provides the ability to create local and global thread barriers. In a local thread barrier, all the threads in a block must wait until every thread of the block has finished execution whereas in a global thread barrier all the threads on the GPU must wait until every thread has finished execution. The use of these barriers to synchronize the threads is called as thread synchronization [26]. For more details on parallel computing on GPUs, please read [27, 28, 29].
3. Adaptive Rectangular Decomposition In this section, we give an overview of adaptive rectangular decomposition (ARD) solver [6] and highlight its benefits over prior solvers for the acoustic wave equation for uniform medium. Our GPU-based wave equation solver is built upon the ARD solver. 3.1. ARD Computation Pipeline ARD has two primary stages, Preprocessing and Simulation. In the preprocessing stage, the input scene is voxelized into grid cells at grid resolution h determined by the relation h = λmin /s = c/νmax s where λmin is the minimum simulation wavelength, s is number of samples per wavelength, c is the speed of sound and νmax is the maximum usable simulation frequency3 . This is followed by a rectangular decomposition step in which grid cells generated during voxelization are grouped into rectangles (see Figure 1(a)). We call these rectangles air partitions. Partitions created for the perfectly matched layer (PML) absorbing layer are referred to as PML partitions. PML absorbing layers are created to model both partially absorbing surfaces as well as complete absorption in open scenes. Both air and PML partitions have the same grid resolution h. Next, we create artificial interfaces between adjacent air-air and air-PML partitions. This one-time pre-computation step takes 1-2 minutes for most scenes. During the simulation stage, the global acoustic field is computed with a time-marching scheme. The computation at each time-step is as follows (see Figure 1(b)): 1. For all interfaces: Interface handling to compute force f within each partition (Equation 12). 2. For all air partitions: (a) Discrete Cosine Transform (DCT) of force f to spectral domain f˜ (Equation 7). (b) Mode update for spectral coefficients p˜ (Equation 9).
c Figure 2: The graphics processing unit (GPU) architecture (image ⃝ Savioja [15]): Current generation GPUs have many streaming multiprocessors(SMs), each containing several streaming processors(SPs), a fast on-chip shared memory and a single-instruction multiple-thread (SIMT) control unit. All the multiprocessors are connected to each other and to a larger off-chip global memory via a fast interconnection network.
3 By maximum usable frequency of X Hz, we mean that our simulation results have no dispersion error and minimal other numerical errors till X Hz. Therefore, they can be directly used to compute impulse response for auralization and produce sound field visualization. So νmax = X kHz means that the useful range of the result is from 0 Hz till X kHz and the excitation is broadband, containing frequencies from 0 to X kHz
4
each) = 4N log2 N, mode update = 9N, interface handling = (300 × 6N 2/3 ) and PML boundary treatment = (390 × 6N 2/3 ) (the 6N 2/3 term approximates the surface area of the scene by that of a cube with equivalent volume. Due to the cartesian grid, this estimate is the lower bound of the surface area). PML boundary treatment cost per cell is the same for both FDTD and ARD. As can be seen in the table, theoretically ARD is nearly 100 times more compute efficient and 50 times more memory efficient than FDTD. In practice, the CPU-based ARD is 50−75 times faster than FDTD implementation, as discussed in detail in Section 5. Since ARD is highly memory efficient, an order of magnitude more than FDTD, this makes it possible to perform simulations on much larger scenes than FDTD without overflowing main memory or GPU memory. GPUs can easily become memory-bound, in which case the performance is dictated by memory bandwidth rather than the FLOP numbers. In these cases as well, ARD, on account of being more memory efficient, is more suitable for the GPUs.
(c) Inverse Discrete Cosine Transform (IDCT) of p˜ to pressure p (Equation 7). (d) Normalize pressure p by multiplying it with a normalization constant. 3. For all PML partitions: Update pressure field. During step 1, the coupling between adjacent partitions (airair and air-PML) is computed to produce forcing values. In steps 2 and 3, these forcing values are used to update the pressure fields within the air and PML partitions respectively. While air partitions are updated in the spectral domain, transforming to and from spatial domain using IDCT and DCT, PML partitions employ a finite-difference implementation of a fictitious, highly dissipative wave equation [30] to perform absorption. DCT and IDCT steps are implemented using a generalized 3D FFT. 3.2. Accuracy and computational aspects A direct performance comparison of FDTD and ARD for the same amount of error is difficult since both techniques introduce different kinds of errors. Since the final goal in room acoustics is to auralize the sounds to a human listener, it is natural to set these error tolerances based on their auditory perceivability. This is complicated by the absence of systematic listening tests for perceivable errors with both, FDTD and ARD. However, it is possible to compare them by assuming conservatively low errors with both the techniques. We briefly discuss how we set the parameters in both techniques for keeping the errors conservatively low and then present a theoretical comparison to motivate why ARD is more compute and memory efficient than FDTD. In recent work, Sakamoto et al. [4] show that FDTD calculations of room-acoustic impulse responses on a grid with s = 6 − 10 agree well with measured values on a real hall in terms of room acoustic parameters such as reverberation time. Remember that grid size h = λmin /s. This mesh resolution is also commonly used with the finite difference method applied to electromagnetic wave propagation to control phase errors resulting from numerical dispersion [5] . Motivated from these applications, we set the mesh resolution conservatively at s = 10 for FDTD throughout this paper, assuming that this safely ensures that numerical dispersion errors are inaudible in auralizations. ARD results in fictitious reflection errors at the artificial interfaces. As shown by Raghuvanshi et al. [6], using s = 2.6 with ARD, the fictitious reflection errors can be kept at a low level of −40 dB average over the whole usable frequency range by employing a sixth-order finite difference transmission operator. This means that for a complex scene with many interfaces, the global errors stay 40 dB below the level of the ambient sound field, rendering them imperceptible as demonstrated in the auralizations [6, 8, 7]. Therefore, we assume sampling of s = 2.6 for ARD. Table 1 shows the performance and memory comparison of FDTD and ARD. The update cost for sixth-order accurate FDTD in 3D is about 55 FLOP per cell per step including the cost of PML boundary treatment for a stencil width of 7. The total cost for ARD per step can be broken down as: DCT and IDCT (assuming a DCT and IDCT take 2N log2 N FLOP count
3.3. Mathematical Background ARD achieves high accuracy for both spatial and temporal derivatives within rectangular volumes, nearly eliminating numerical dispersion. This is done by employing the eigendecomposition for the wave equation on rectangular domains, which, assuming spatially constant speed of sound, can be computed analytically, incurring no numerical computation or error, as follows – ∇2 Φi, j,k
=
Φi, j,k
=
ki,2 j,k
=
−ki,2 j,k Φi, j,k , ( ) ( ) ( ) cos π lix x cos π ljy y cos π lkz z , ( ) 2 2 2 π2 li2 + lj2 + kl2 . x
y
(5)
z
Note that the eigen-functions, Φi, j,k , coincide with the basis functions for the 3D Discrete Cosine Transform. This follows from assuming sound-hard boundary conditions for the volume. The result is that to transform to and from the spectral basis, one can leverage memory and compute-efficient Discrete Cosine Transform (DCT) and inverse Discrete Cosine Transform (iDCT) implementations. The pressure and forcing fields are expressed in this basis as – ∑ p (x, y, z, t) = p˜ i, j,k (t) Φi, j,k (x, y, z) , i, j,k ∑ ˜ (6) f (x, y, z, t) = fi, j,k (t) Φi, j,k (x, y, z) . i, j,k
The above equations are equivalent to – p˜ i, j,k (t) f˜i, j,k (t) p (x, y, z, t) f (x, y, z, t)
= = = =
DCT (p (x, y, z, t)), DCT ( f (x, y, z, t)), IDCT ( p˜ i, j,k (t)), IDCT ( f˜i, j,k (t)).
(7)
Substituting equation (6) into the wave equation (1) leads to a independent set of Ordinary Differential Equations – d2 p˜ i, j,k + ω2i, j,k p˜ i, j,k = f˜i, j,k , where ωi, j,k = cki, j,k . dt2 5
(8)
FDTD ARD
s
# cells N = V/h3
# steps S = t/∆t
FLOP count (TeraFLOP)
10 2.6
254 M 4.5 M
17000 4500
FDTD : 221.55, PML : 15.95 Interface : 0.22, DCT+IDCT : 1.79, Mode update : 0.18, PML : 0.29
Total FLOP count (TeraFLOP) ∼237 ∼2.5
FLOP per cell per step 55 120
Table 1: Floating-point operation (FLOP) count comparison of FDTD vs ARD on a scene of volume V = 10, 000m3 with maximum usable frequency νmax = 1 kHz (minimum wavelength λmin = c/νmax = 34cm) for the simulation of duration t = 1 sec. The number of cells (in Millions M) with either technique is given √ by N = V/h3 where h = λmin /s is the grid size and s is number of samples per wavelength. The simulation time-step is restricted by the CFL condition ∆t ≤ h/c 3 with smaller cell sizes requiring proportionally smaller time-steps. Theoretically, ARD which uses s = 2.6 is nearly hundred times more compute efficient and 50 times more memory efficient than FDTD (s = 10) on account of using a much coarser grid. “FLOP per cell per step” is defined as the ratio of the total FLOP count and the total number of cells N times the number of steps S .
By recognizing that the above is the equation of a forced simple harmonic oscillator having solutions of the form, p(t) ˜ = αeiωt + αe ¯ −iωt and assuming f is constant over a time-step, the following update rule is obtained (subscripts have been suppressed and are (i,j,k) for all terms) – 2 f˜(n) p˜ (n+1) = 2 p˜ (n) cos (ω∆t) − p˜ (n−1) + 2 (1 − cos (ω∆t)) . (9) ω The above update rule is derived from the analytical solution by requiring time-symmetry and reversibility. In the absence of forcing terms, this scheme incurs no numerical errors. Interface Handling: For handling non-rectangular scenes with ARD, the scene’s air volume is decomposed into a disjoint set of coordinate axis-aligned rectangular partitions that touch each other at artificial interfaces, as illustrated in Figure 1. Interface handling is used to ensure sound propagation between the partitions. Although we don’t present the detailed mathematical derivation here, we highlight the conceptual motivation behind interface handling, as well as the interface operator we use. For more details, please refer to [6, 31]. Consider two partitions in 1D, [−∞, 0] and [0, ∞], with an interface lying on the origin. This analysis extends straightforwardly to 3D since all the partition boundaries, and thus interfaces, are axis aligned. The boundary condition assumed for the internal solution within each partition is ∂p ∂x x=0 = 0 (soundhard boundary condition assumption), which results in full reflections from the origin. Consider the right partition: the local solution corresponds to a discrete differential operator, ∇2local , that satisfies the mentioned boundary condition. Representing the global (correct) operator by ∇2global , equation (1) can be rewritten as – ∂2 p ∂t2 ∂2 p ∂t2
− c2 ∇2global p
−c fI (x, t)
2
∇2local p
=
f (x, t) ,
= =
f (x, ( t) + fI (x, t) , ) c2 ∇2global − ∇2local p = c2 ∇2res p.
the cell size for the Cartesian grid, the forcing terms (denote fI (x j , t) with fI (x j )) for the right partition for perfect, error-free interfacing is given by – fI (x j ) =
−1 ∑ i=−∞
p(xi )s[ j − i] −
∞ ∑ i=0
p(xi )s[ j + i + 1]
where j ∈ [0, { ∞), −π2
3 s[i] = sinc′′ (ih) = h12 × (−1)i−1 i22 sin π x ( ) x,0 ( π hx) sinc(x) = 1 h x=0
i=0 i , 0, i ∈ Z
(11)
This exact operator is highly compute-intensive owing to its non-compact support. For partitions with N cells, its computational complexity is O(N 2 ). Therefore, approximate interface handling is performed by using the following stencil derived by assuming that the discrete operator ∇2global corresponds to a sixth-order accurate finite-difference scheme. This leads to a compact operator, thus allowing faster computation, which is given as follows – fI (x j ) =
−1 ∑ i= j−3
p(xi )s[ j − i] −
2− ∑j i=0
p(xi )s[i + j + 1]
where j ∈ [0, 1, 2], fI (x j ) = 0, j > 2, 1 s[−3...3] = 180h 2 {2, −27, 270, −490, 270, −27, 2}.
(12)
Its computational complexity depends on the number of cells lying on the interface a) 1D : O(1) b) 2D : O(N 1/2 ) c) 3D : O(N 2/3 ) (as discussed in Section 3.2). This approximate operator results in low-amplitude fictitious reflections from the interface. However, these errors are roughly 40 dB below the incident sound-field, thus making them inaudible [6]. Lower errors could be obtained by optimized compact finite difference schemes, or even directly using the exact operator described above. The ARD technique is quite similar to PSTD in that it allows similar spectral accuracy and thus, similarly coarse mesh while calculating the spatial derivatives. The crucial difference lies in how temporal derivatives are handled. PSTD uses a secondorder accurate explicit time-stepping scheme. This means that numerical dispersion errors are still introduced due to errors in the time derivative. On the other hand, ARD which is based on partitioning the domain into rectangles and assuming soundhard walls for the partitions, handles the temporal derivative with spectral accuracy by using the analytical solution to the
(10) In this way, the actual global operator ∇2global is expressed as the 2 sum of an operator ( local to the) partition ∇local and a residual operator ∇2res = ∇2global − ∇2local . The latter is accounted for in the forcing term on the RHS. At each step, the forcing term is computed as in the equation above as the sum of source terms f (x, t) and interface contributions fI (x, t), and the remaining computation is identical to what was described in equations (5) through (9). All that remains is the form( of the ) interface op1 erator discussed above. Denoting xi = i + 2 h, where h is 6
wave equation for rectangular spaces. Thus, numerical dispersion is completely eliminated with ARD for propagation within rectangular partitions. Some dispersive error is still introduced for waves propagating across partition interfaces, but this error is much smaller than with FDTD or even PSTD, where waves accumulate dispersive errors of similar magnitude at each timestep.
of simulation on a spatial grid subsampled by retaining every fourth, eighth or sixteenth sample, can be used for convincing auralizations for moving sources and listener, after careful interpolation [7]. This results in a memory reduction by a factor of 1/43 , 1/83 , 1/163 of the original size respectively, resulting in negligible overall cost for transferring the simulation results from GPU to CPU. To provide an intuition of host-device data transfer, consider a room of air volume 10, 000m3 for which we solve the wave equation at νmax = 2 kHz. We consider a hybrid CPU-GPU system of Raghuvanshi et al. [8] where only the DCT/IDCT steps of the technique are parallelized on GPU. In this case, at each time-step the grid f is transferred from CPU to GPU for DCT, f˜ is returned back by the GPU, p˜ is transferred from CPU to GPU for IDCT and the final pressure p is returned to the CPU. An important point to note here is that the p, f, p, ˜ f˜ grids cannot be subsampled and transferred in this hybrid CPU-GPU system because the steps of the algorithm that reside on the CPU and GPU require the values on the complete grid to solve wave equation. Since the size of p, f, p, ˜ f˜ is equal to number of grid cells, the total data transfer cost per time-step is 4 x # grid cells ( )3 ( )3 x sizeof(float) = 4V sνcmax x 4 bytes = 4x10000x 2.6x2000 x 340 4 bytes = 145 MB. On the other hand, in our technique since all the computational steps are performed on the GPU, we do not need to transfer the p, f, p, ˜ f˜ grids to the CPU for the purpose of the simulation. The only transfer that is required is of the subsampled pressure grid p from GPU to CPU for storage on the disk, perhaps for auralization later. For visualization applications, one might not need to perform any transfer at all because the data is already present on the GPU and can be displayed directly to the screen. As explained above, for the purpose of auralization, the subsampling of pressure grid is usually done at a lower resolution (1/83 ). Thus our data transfer per time-step = 1/83 x # grid cells x 4 bytes = 3 kB. For such a small size, data-transfer is almost immediate(< 1 msec).
4. GPU-based acoustic solver In previous sections, we discussed the computational efficiency and mathematical background of ARD. In this section, we describe our parallel GPU-based acoustic wave equation solver built on top of ARD. We discuss key features of our approach and some of the issues that arise in parallelizing it on many-core GPU architecture. 4.1. Our GPU approach Two levels of parallelism. The ARD technique exhibits two levels of parallelism (a) a coarse-grained and (b) a fine-grained. Coarse grained parallelism is due to the fact that each of the partitions (air or PML) solves the wave equation independently of each other. Therefore, each partition can be solved in parallel at the same time. Fine grained parallelism is achieved because within each partition all the grid cells are independent of each other with regards to solving the wave equation at a particular time-step. For solving the wave equation at the current timestep, a grid cell may use p, f, p, ˜ f˜ values of its neighboring cells computed at previous time-step but is completely independent of their p, f, p, ˜ f˜ values at the current time-step. In other words, because ARD uses explicit time-stepping, there is no need for solving a linear system. Therefore within each partition, all the grid cells can run in parallel exhibiting fine grained parallelism. Our GPU-based acoustic solver exploits both these levels of parallelism. We launch as many tasks in parallel as there are partitions. Each task is responsible for solving the wave equation for a particular partition. Within each task, each grid cell corresponds to a thread and we create as many threads as the number of grid cells in that partition. All these threads are grouped into blocks and scheduled by the runtime environment on the GPU.
Computationally optimal decomposition. Rectangular decomposition proposed by Raghuvanshi et al. [6] uses a greedy heuristic to decompose the voxelized scene into rectangular partitions. Specifically, they place a random seed in the scene and try to find the largest fitting rectangle that can be grown from that location. This is repeated until all the free cells of the scene are exhausted. The cost of DCT and IDCT steps implemented using FFT depends on the number of grid cells in each partition. FFT operations are known to be extremely efficient if the number of grid cells are powers of 2. The proposed heuristic may produce partitions with irregular number of grid cells (not necessarily powers of 2) significantly increasing the cost of the DCT and IDCT operations. We propose a new approach to perform the rectangular decomposition that takes into account the computational expenditure of FFTs and its efficiency with powers of 2. Specifically, while performing rectangular decomposition, we impose the constraint that the number of grid cells in each partition should be a power of 2. Similar to the original approach, we try to fill the largest possible rectangle that could fit within the remaining air volume of the scene. But instead of directly using
Avoiding host-device data transfer bottleneck. The hostdevice data link between CPU and GPU via PCI express or Infiniband, is a precious resource that has a limited bandwidth. Many prior GPU-based numerical solvers were based upon the hybrid CPU-GPU design. This design suffers from datatransfer bottleneck as it has to transfer large amounts of data between host (CPU) and device (GPU) at each simulation step. We have designed our GPU-based solver to ensure that the datatransfer between the CPU-host and GPU-device is minimal. In our case, we avoid the hybrid CPU-GPU approach and instead parallelize the entire ARD technique on the GPU. The only host-device data transfer that is required is to store the pressure grid p after each simulation step. Recent work on interactive auralization has shown that storing and processing the results 7
it we shrink its size in each dimension to the nearest power of 2 and declare the remaining cells as free. We repeat this step until all the free cells of the scene are exhausted. This increases the efficiency of the FFT computations and results in a speedup of 3 times in the running time of DCT and IDCT steps. For typical scenes, our rectangular decomposition approach produces higher number (2 − 3 times) of rectangular partitions, but since the total number of grid cells in the entire volume of domain remains constant (N = V/h3 ), it does not increase the total FLOP count except the interface handling step. Since more partitions result in larger interface area, the interface handling cost increases by 25-30%. But since on the CPU, DCT and IDCT are the most time-consuming steps of the ARD technique compared to the cost of interface handling (Figure 5(a) : CPU time), the gain achieved by faster powers-of-two DCT and IDCT far outweighs this increased interface handling cost.
in the hatched region (marked “Collision”) are updated by both interfaces 1 and 2. These corner cases need to be addressed to avoid race conditions and concurrent memory writes. The GPU and its runtime environment places the burden of avoiding concurrent write (CW) hazards on the programmer. Fortunately, collisions can be avoided completely by using a conceptually simple technique. All interfaces are grouped into 3 batches consisting of interfaces with their normals in the X, Y and Z directions respectively. Since all partitions are axis-aligned rectangles, every interface has to fall into one of these batches. By processing all interfaces within each batch in parallel and separating batches by a synchronization across all threads, all collisions in the corners are avoided completely. Our approach is more general and well-supported on all GPUs. DCT( f ) . The DCT step converts the force f from the spatial domain to the spectral domain f˜. DCTs are efficiently computed using FFTs. Typical FFT libraries running on GPU are an order of magnitude faster than optimized CPU implementations [32]. Since DCT and IDCT steps are among the slowest steps of the ARD technique (see Figure 5(a)), parallelization of these steps results in a great improvement in the performance of the entire technique.
4.2. Details Among ARD’s two main stages, the pre-processing is performed only once in the beginning and its contribution to the total running time is negligible (1 − 2 minutes) compared to the cost of the simulation step. Therefore, we keep this stage on the CPU itself and parallelize the simulation stage on the GPU. Thus, the voxelization and rectangular decomposition is performed on the CPU. Once we have the rectangular partitions, we create the pressure p, force f , spectral pressure p˜ and spectral force f˜ data-structures on the GPU. The simulation stage has 6 main steps (see Section 3.1) and each of them is performed in sequential order. We now discuss the parallelization of all these steps on the GPU in detail.
Mode update p˜ . The Mode update step uses the pressure and force in the spectral domain p, ˜ f˜ of the previous time-step to calculate p˜ at the current time-step. This step consists of linear combinations of p, ˜ f˜ terms (see Equation 9) and is highly parallelizable4 . Pressure normalize p. This step multiplies a constant value to the pressure p, which is also highly parallelizable.
Interface handling. This step is responsible for computing forcing terms f at the artificial interfaces between air-air and air-PML partitions. These forces account for the sound propagation between partitions by applying a finite-difference stencil given in Equation 12. The overall procedure consists of iterating over all interfaces, applying the finite difference stencils to compute forcing values and additively accumulating them at the affected cells. This step is data parallel – to compute the forcing term at a cell, only values in its spatial neighborhood are read. Thus, all interfaces could potentially be processed in parallel as long as there are no collisions and no two interfaces update the forcing value at the same cell. This can happen at corners (as shown below).
IDCT( p). ˜ This step converts the pressure in the spectral domain p˜ back to pressure in spatial domain p. Similar to DCTs, the IDCTs are also efficiently computed using FFTs on GPU. PML absorption layer. The PML absorbing layer is responsible for sound wave absorption by the surfaces and walls of the 3D environment. It is applied on a 5-10 cell thick partition depending on the desired accuracy [30, 6]. We use a 4th order finite-difference stencil (5 cell thickness) for PML computation (see Equation 2). Based upon the distance of the grid cell from the interface, PML performs different computations for different grid cells. Due to this, there are a lot of inherent conditionals in the algorithm. An efficient implementation of PML depends on minimizing the effect of these conditionals, as discussed in the next section. 4.3. Optimization The performance of the GPU-based ARD algorithm described above can be improved by means of following optimizations.
Figure 3: (Color online) Interfaces 1 and 2 update forcing values of cells lying in their neighboring partitions. There is a Concurrent Write (CW) hazard in the hatched corner region (labeled “Collision ”).
4 By highly parallelizable, we mean that there should be no dependence between the threads, each thread has a very local and small memory access pattern and all of them can be computed in parallel.
Interfaces 1 and 2 both update the forcing values 3-cells deep of their shared partitions. However, for partition P, cells lying 8
Scene
Batch processing. Interface handling, DCT, IDCT, Mode update and Pressure normalize steps form the main components of our GPU-based solver, where each step corresponds to a GPUfunction called kernel. Kernels are functions that are executed in parallel on the GPU (see Section 2.3). To run these steps on all the partitions and interfaces, one possible way is to launch a new kernel for each individual air partition, PML partition and interface. In typical scenes, there are thousands of partitions and interfaces (see Table 2). Since each kernel launch has an associated overhead, launching thousands of kernels can have a drastic impact on the overall runtime. To avoid this overhead, we group together partitions and interfaces into independent groups (also called batches) and launch a kernel for each batch. We call this batch processing. Therefore, instead of launching P + I kernels where P is the number of partitions and I is the number of interfaces, we launch as many kernels as there are the number of batches. This grouping of partitions into batches depends on the number of independent groups that can be formed. If all the partitions are independent, they can grouped into a single batch. For DCT and IDCT kernels, partitions are grouped into batches by using the BATCH FFT scheme of the GPU-FFT library [32]. Mode update and Pressure normalize steps have no dependency between different partitions, and are grouped in a single batch resulting in just one kernel launch each. For PML step also, we can group all the PML partitions into a single batch and launch a single kernel. But to minimize the effect of conditionals, we launch more than one kernel, as discussed later. For interface handling, we group the interfaces into 3 separate independent batches as discussed in Section 4.2. A kernel launch for each batch is followed by a call to synchronize all the threads.
L-shaped room Cathedral Walkway Train station Living room Small room
Air/Total Volume (m3 ) 6998/13520 7381/15120 6411/9000 15000/83640 5684/7392 124/162
νmax Hz 1875 1650 1875 1350 1875 7000
# partitions (air+pml) 424+352 6130+12110 937+882 3824+4945 3228+4518 3778+5245
# cells (air+pml) (22+5)M (16+6)M (20+6)M (17+8)M (18+5)M (20+5)M
Table 2: “Total volume” is volume of the bounding box of the scene whereas “Air volume” is volume of the air medium in which we perform the simulation. νmax is the maximum usable simulation frequency. Number of partitions counted are generated using our computationally optimal decomposition. Number of pressure values updated at each time-step is equal to the number of grid cells (in millions M).
conditional branching. Instead of launching a single kernel with conditional branching, we launch separate small kernels corresponding to different execution paths of the code. The number of different execution paths is limited and can be reformatted in 2-3 unique paths. Thus, the increase in the number of kernel launches is minimal (2 or 3). These additional kernel launches do not adversely impact the performance.
5. Implementation and Results The original CPU-based ARD solver used a serial version of FFTW library for computing DCT and IDCT steps. The CPU code uses two separate threads - one for air partitions and other for PML partitions, and performs both these computations in parallel. For simplicity of comparison with our GPU-based implementation, we measure the sequential performance of the CPU-based solver by using only a single thread. The CPUbased ARD code has been demonstrated to be sufficiently accurate in single precision [8, 6]. Since the calculations performed in our GPU-based approach are the same as the CPU-based approach, the results of the GPU-based solver match the CPUbased solver up to single-precision accuracy. We implemented our GPU-based wave equation solver using NVIDIA’s parallel computing API, CUDA 3.0 with minimum compute capability 1.0. The following compiler and optimization options are used for our GPU code –
Maximizing coalesced memory access. The global memory access pattern of the GPU can have a significant impact on its bandwidth. GPU accesses memory in group of threads called a half-warp (see Section 2.3). Global memory accesses are most efficient when memory accesses of all the threads of a half-warp can be coalesced in a single memory access. Our p, f, p, ˜ f˜ data-structures and their memory access patterns for the Mode update and Pressure normalize kernels are organized in a way such that each thread of index i accesses these datastructures at position i itself. Thus the memory access pattern of a half-warp is perfectly coalesced. DCT and IDCT kernels based upon FFT library [32] use memory coalescing as well. Our PML handling kernel for thread i accesses memory at locations α + i where α is constant. This type of access results in a coalesced memory access on current generation GPUs [27]. The interface handling step can access p, f from many partitions and therefore achieving coalesced memory access for this kernel is difficult.
nvcc CUDA v3.0 :
Maximize Speed (/O2).
Our DCT and IDCT kernels are based upon the FFT library developed by Govindaraju et al. [32]. We use CUDA routine cudaThreadSynchronize() for synchronizing threads. We compare our GPU-based acoustic wave equation solver with the well-optimized CPU implementation provided by the authors of ARD [6]. We use NVIDIA Geforce GTX 480 graphics card with a core clock speed of 700 MHz, graphics memory of 1.5 GB with 480 CUDA processors (also called cores). CPU timings are reported for an Intel Xeon X5560 (8M Cache, 2.80 GHz) machine. We employ only a single core for the CPUbased implementation. Timings are reported by running the simulation over 100 time-steps and taking the average. We use 5 benchmark scenes varying in both size and complexity (see
Minimizing path divergence . The impact of conditionals (if/else statements) on the performance of a GPU kernel can be very severe. The PML absorbing layer steps have conditionals that are based upon the distance of the grid cells from the interface and special cases like outer edges and corners. In our implementation, we take specific care in minimizing the effect of 9
(a)
(b)
(c)
(d)
Figure 4: We investigate the performance of ARD solver on varying νmax and scene volume. a) Simulation time per time-step of CPU-based and GPU-based ARD solver with varying νmax for the L-shaped room scene. Note that the GPU-based solver is 24 times faster at highest νmax . b) Speedup (=CPU time/GPU time) achieved by our GPU-based ARD solver over the CPU-based solver with varying νmax for the different test scenes. For higher νmax , we achieve a speedup of 15 − 25 times. c) Simulation time per time-step of both ARD solvers with varying scene volume for L-shaped room scene. We scale the original volume of the test scenes by the Scaling Factor. Note that the GPU-based solver is 25 times faster at highest scaling factor. d) Speedup (=CPU time/GPU time) achieved by our GPU-based ARD solver over the CPU-based solver with varying scene volume for the different test scenes. As the scene volume increases, we achieve a higher speedup. For 64 times the original volume, the speedup becomes 12 − 25 times.
Table 2 and Figure 6). Please listen to the videos in the supplementary materials or at the link [9] for auralization results on these benchmarks. In Figure 4(a), we compare the performance of the CPUbased solver with our GPU-based solver on L-shaped room benchmark with varying νmax . Figure 4(b) shows the speedup achieved by our GPU-based solver on different benchmarks. For smaller frequencies, the amount of work available is considerably less resulting in under-utilization of GPU and nominal speedup. But for higher frequencies5 , all the cores of the GPU are fully utilized. Our GPU-based solver becomes a lot faster and outperforms its CPU counterpart by a factor of 15 − 25 times on different scenes. We also analyze the performance of our solver with varying scene volume. We take our benchmark scenes and scale their volume uniformly in the range of 1 − 64 times. In Figure 4(c), we observe again that as the amount of work increases with increasing scene volume, the performance of GPU-based solver scales better. Speedup achieved by our GPU-based solver for varying scene volume also shows a similar behavior (see Figure 4(d)). As the scaling factor reaches 64 times, we achieve a speedup of 12−25 times on different scenes.
For simple scenes like L-shaped room, rectangular decomposition gives fewer air partitions (see Table 2 column 4) resulting in fewer DCT and IDCT batches. Since each batch corresponds to a kernel call, fewer batches mean fewer kernel calls reducing the total overhead of kernel launches. Fewer batches also mean that individual batch is of larger size. For each batch, the GPU gets fully utiliized and the DCT and IDCT kernels based on GPU-FFT are much more efficient resulting in higher speedups for simpler scenes. Figure 5(a) shows the breakdown of the time spent on various steps of the simulation stage. In the original CPU-based ARD solver, the DCT/IDCT and the PML steps heavily dominate the computation time. But for the GPU-based solver, as can be seen, all the steps of the simulator are more or less balanced except Mode update, Pressure normalize and PML, whose costs become negligible compared to other steps. Our DCT and IDCT kernels implemented using FFT library [32], give us a speedup of 14 times on the GPU. PML boundary treatment, Mode update and Pressure normalize achieve a higher speedup of 30 times, 28 times and 16 times respectively. The last stage of ARD, interface handling, involves a lots of uncoalesced memory accesses resulting in a nominal speedup of 3 times. But since the contribution of interface handling to the overall running time is far less than DCT/IDCT steps, it does
5 The amount of work increases with increasing frequency (number of grid cells N ∝ νmax 3 ).
10
(a)
(b)
(c)
(d)
Figure 5: a) Simulation steps - Interface handling, DCT, Mode update, IDCT, Pressure normalize and PML, and the corresponding time spent in the CPU-based and GPU-based ARD solver for the Walkway scene. Speedups achieved by individual steps of the GPU-based ARD over the CPU-based simulator - PML(30 times), Mode update(28 times), Pressure normalize(16 times), DCT(14 times), IDCT(14 times) and interface handling(3 times). b) We plot speedup achieved by CPU-based and our GPU-based ARD solver over CPU-based finite-difference time-domain (FDTD) solver with varying νmax for the small room benchmark scene. Our CPU-based FDTD solver is based upon the work proposed by Sakamoto et al. [4]. The CPU-based ARD solver achieves a maximum speedup of 75 times over CPU-based FDTD whereas our GPU-based ARD solver achieves a maximum speedup of 1100 times. c & d) We run simulations on 4 different NVIDIA GPU’s with different number of CUDA processors (also called cores) - GeForce 9600M GT (32 cores), GeForce 8800GTX (128 cores), Quadro FX 5800 (240 cores) and Geforce GTX 480 (480 cores). Speedup on GPU with X cores = (Simulation time on 32-cores GPU)/(Simulation time on X-cores GPU). We achieve linear scaling in performance at higher values of νmax .
not become a bottleneck.
is based upon the FDTD work proposed by Sakamoto et al. [4]. As can be seen in Figure 5(b), CPU-based ARD-solver achieves a maximum speedup of 50 − 75 times over the CPU-based FDTD solver. Our GPU-based ARD solver achieves a speedup of over 1100 times over CPU-based FDTD solver for the same scene. Since FDTD runs out of memory for νmax > 3750Hz, we use the timings below 3750Hz and the fact that simulation time varies as fourth power of νmax , to calculate the projected timings for FDTD above 3750Hz.
We performed scalability analysis of our solver on four different NVIDIA GPUs with different number of CUDA cores : GeForce 9600M GT, GeForce 8800GTX, Quadro FX 5800 and Geforce GTX 480, each with 32, 128, 240 and 480 CUDA cores respectively. Figure 5(c) and 5(d) shows the performance of our solver on the cathedral and the small room scene as the number of CUDA cores increase. As can be seen, our GPUbased solver scales linearly with the number of cores. Increasing the number of CUDA cores 4 times from 32 to 128 results in a speedup of 3 − 4 times, from 32 cores to 240 cores (7.5 times) gives 7 − 7.5 times speedup and from 32 to 480 cores (15 times) we get a speedup of 14 − 15 times. As the amount of work increases with increasing νmax , the performance scaling becomes perfectly linear. This shows that our GPU-based ARD solver is compute-bound rather than limited by memory bandwidth. In future, as GPU’s continue their super-Moore’s law growth [33, 34], our GPU-based solver will exhibit superexponential performance improvement.
6. Conclusion and Future Work In this paper, we have presented an efficient GPU-based timedomain solver for the acoustic wave equation. We observe more than three orders of magnitude improvement over prior solvers based on FDTD. Moreover, the use of GPUs can accelerate the computation by more than an order of magnitude as compared to the CPU-based ARD solver. We also show that our technique scales linearly with the number of GPU processors. Our approach has some limitations. Our current implementation assumes that the entire spatial decomposition fits into GPU memory and is based on single precision arithmetic. In terms
We also perform a performance comparison of CPU-based FDTD solver, CPU-based ARD solver and our GPU-based ARD solver with varying νmax . Our CPU-based FDTD solver 11
of future work, given a reformulation of the BEM-FMM solution technique in time-domain, a very interesting possibility would be to combine our ARD approach with BEM-FMM – utilizing FMM based solutions for partitions with large volume and our current domain-based ARD method for smaller partitions. Comparing detailed impulse response measurements of full-sized 3D concert halls against wave-based numerical simulation is a very new and exciting method of investigation, which has opened up because of the increased computational power and memory on today’s computers. Our present work opens up the possibility of doing such detailed comparisons on a desktop computer in the mid-high frequency range(1 − 4 kHz) in the near future, along with visualizations of the propagating wavefronts. It would also be interesting to apply our approach to more complex acoustic spaces such as CAD models and large outdoor scenes, and extend it to multi-GPU clusters as well.
12. Boyd, J.P.. Chebyshev and Fourier Spectral Methods: Second Revised Edition; chap. 2. NY, USA: Dover Publications; 2 revised ed. ISBN 0486411834; 2001:. 13. Gumerov, N.A., Duraiswami, R.. A broadband fast multipole accelerated boundary element method for the three dimensional Helmholtz equation. The Journal of the Acoustical Society of America 2009;125(1):191–205. 14. Yee, K.. Numerical solution of initial boundary value problems involving maxwell’s equations in isotropic media. IEEE Transactions on Antennas and Propagation 1966;14(3):302–307. doi:10.1109/TAP.1966.1138693. 15. Savioja, L.. Real-Time 3D Finite-Difference Time-Domain Simulation of Low and Mid-Frequency Room Acoustics. In: 13th International Conference on Digital Audio Effects (DAFx-10). 2010:. 16. Kowalczyk, K., van Walstijn, M.. Room acoustics simulation using 3-D compact explicit FDTD schemes. IEEE Transactions on Audio, Speech and Language Processing 2010;. 17. Liu, Q.H.. The PSTD algorithm: A time-domain method combining the pseudospectral technique and perfectly matched layers. The Journal of the Acoustical Society of America 1997;101(5):3182. doi:10.1121/1.419176. 18. Funkhouser, T., Tsingos, N., Jot, J.M.. Survey of methods for modeling sound propagation in interactive virtual environment systems. Presence and Teleoperation 2003;URL http://www-sop.inria.fr/reves/Basilic/2003/FTJ03. 19. Siltanen, S., Lokki, T., Kiminki, S., Savioja, L.. The room acoustic rendering equation. The Journal of the Acoustical Society of America 2007;122(3):1624–1635. doi:10.1121/1.2766781. 20. Chandak, A., Lauterbach, C., Taylor, M., Ren, Z., Manocha, D.. AD-Frustum: Adaptive Frustum Tracing for Interactive Sound Propagation. IEEE Transactions on Visualization and Computer Graphics 2008;14(6):1707–1722. doi:10.1109/TVCG.2008.111. 21. Taylor, M., Chandak, A., Ren, Z., Lauterbach, C., Manocha, D.. Fast edge-diffraction for sound propagation in complex virtual environments. In: EAA Auralization Symposium. 2009:. 22. Funkhouser, T., Tsingos, N., Carlbom, I., Elko, G., Sondhi, M., West, J., Pingali, G., Min, P., Ngan, A.. A beam tracing method for interactive architectural acoustics. Journal of the Acoustical Society of America 2004;115(2):739–756. 23. Laine, S., Siltanen, S., Lokki, T., Savioja, L.. Accelerated beam tracing algorithm. Applied Acoustics 2009;70(1):172 – 181. doi:DOI: 10.1016/j.apacoust.2007.11.011. 24. Tsingos, N., Dachsbacher, C., Lefebvre, S., Dellepiane, M.. Instant Sound Scattering. In: Rendering Techniques (Proceedings of the Eurographics Symposium on Rendering). 2007:. 25. Taylor, M., Mo, Q., Chandak, A., Lauterbach, C., Schissler, C., Manocha, D.. i-sound: Interactive gpu-based sound auralization in dynamic scenes. Tech. Rep. TR10-006; Department of Computer Science, UNC Chapel Hill; 2010. 26. Nickolls, J., Buck, I., Garland, M., Skadron, K.. Scalable parallel programming with cuda. Queue 2008;6(2):40–53. doi: http://doi.acm.org/10.1145/1365490.1365500. 27. NVIDIA, . CUDA Programming Guide (date last viewed 09/01/2010). http://developerdownloadnvidiacom/compute/cuda/3 1/toolkit/docs/ NVIDIA CUDA C ProgrammingGuide 31pdf 2010;:114–116. 28. Kirk, D.B., Hwu, W.m.W.. Programming Massively Parallel Processors: A Hands-on Approach. 1st ed.; San Francisco, CA, USA: Morgan Kaufmann Publishers Inc.; 2010. ISBN 0123814723, 9780123814722. 29. Savioja, L., Manocha, D., Lin, M.. Use of GPUs in room acoustic modeling and auralization. In: Proc. Int. Symposium on Room Acoustics. Melbourne, Australia; 2010:. 30. Rickard, Y.S., Georgieva, N.K., Huang, W.P.. Application and optimization of PML ABC for the 3-D wave equation in the time domain. IEEE Transactions on Antennas and Propagation 2003;51(2):286–295. doi:10.1109/TAP.2003.809093. 31. Raghuvanshi, N., Mehra, R., Savioja, L., Lin, M.C., Manocha, D.. ”An efficient time-domain solver for the acoustic wave equation based on adaptive rectangular decomposition”. (under submission) 2010;. 32. Govindaraju, N.K., Lloyd, B., Dotsenko, Y., Smith, B., Manferdelli, J.. High performance discrete Fourier transforms on graphics processors. In: SC ’08: ACM/IEEE conference on Supercomputing. Piscataway, NJ, USA: IEEE Press. ISBN 978-1-4244-2835-9; 2008:1–12. doi: 10.1145/1413370.1413373. 33. Owens, J.D., Luebke, D., Govindaraju, N., Harris, M., Krger, J.,
Acknowledgements This work was supported in part by ARO Contract W911NF10-1-0506, NSF awards 0917040, 0904990 and 1000579, and RDECOM Contract WR91CRB-08-C-0137. We thank the anonymous reviewers for their suggestions and comments that helped to improve the paper. We would also like to thank Rahul Narain and Stephen J. Guy for proofreading the paper. References 1. Crocker, M.J.. Handbook of Acoustics; chap. 3,6,9. USA: Wiley-IEEE; 1998:. 2. Yokota, T., Sakamoto, S., Tachibana, H.. Visualization of sound propagation and scattering in rooms. Acoustical Science and Technology 2002;23(1):40–46. 3. Sakamoto, S., Ushiyama, A., Nagatomo, H.. Numerical analysis of sound propagation in rooms using the finite difference time domain method. The Journal of the Acoustical Society of America 2006;120(5):3008. 4. Sakamoto, S., Nagatomo, H., Ushiyama, A., Tachibana, H.. Calculation of impulse responses and acoustic parameters in a hall by the finite-difference time-domain method. Acoustical Science and Technology 2008;29(4). 5. Taflove, A., Hagness, S.C.. Computational Electrodynamics: The FiniteDifference Time-Domain Method, Third Edition; chap. 1,4. London, UK and Boston, USA: Artech House Publishers; 3rd ed. ISBN 1580538320; 2005:. 6. Raghuvanshi, N., Narain, R., Lin, M.C.. Efficient and Accurate Sound Propagation Using Adaptive Rectangular Decomposition. IEEE Transactions on Visualization and Computer Graphics 2009;15(5):789–801. doi: 10.1109/TVCG.2009.28. 7. Raghuvanshi, N., Snyder, J., Mehra, R., Lin, M.C., Govindaraju, N.K.. Precomputed Wave Simulation for Real-Time Sound Propagation of Dynamic Sources in Complex Scenes. ACM Transactions on Graphics (proceedings of SIGGRAPH 2010) 2010;29(3). 8. Raghuvanshi, N., Lloyd, B., Govindaraju, N.K., Lin, M.C.. Efficient Numerical Acoustic Simulation on Graphics Processors using Adaptive Rectangular Decomposition. In: EAA Symposium on Auralization. 2009:. 9. BENCHMARKS, . Benchmark scenes, visualizations and auralizations (date last viewed 09/01/2010). 2010;URL http://gamma.cs.unc.edu/GPUSOUND/benchmark.html. 10. Thompson, L.L.. A review of finite-element methods for timeharmonic acoustics. The Journal of the Acoustical Society of America 2006;119(3):1315–1330. doi:10.1121/1.2164987. 11. Brebbia, C.A.. Boundary Element Methods in Acoustics; chap. Complete book. NY, USA: Springer; 1 ed. ISBN 1851666796; 1991:.
12
Lefohn, A.E., Purcell, T.J.. A Survey of General-Purpose Computation on Graphics Hardware. Computer Graphics Forum 2007;26(1):80–113. 34. Govindaraju, N., Gray, J., Kumar, R., Manocha, D.. GPUTeraSort: high performance graphics co-processor sorting for large database management. In: ACM SIGMOD ’06. New York, NY, USA: ACM. ISBN 1-59593-434-0; 2006:325–336.
(a) Cathedral (35m x 16m x 27 m)
(b) Walkway (30m x 30m x 10m)
(c) Train station (34m x82m x 30m)
(d) Living room (22m x 28m x 12m) Figure 6: Benchmark scenes, videos and more pictures available in the supplementary materials or at the link [9].
13