Preprints of the 19th World Congress The International Federation of Automatic Control Cape Town, South Africa. August 24-29, 2014
An Embedded Classifier of Lung Sounds based on the Wavelet Packet Transform and ANN M.A. Tocchetto ∗,1 A.S. Bazanella ∗∗ L. Guimaraes ∗ J. L. Fragoso ∗ A. Parraga ∗ ∗
Computer Engineering, Universidade Estadual do Rio Grande do Sul, Guaíba-RS, Brazil. marco-tocchetto, leticia-guimaraes, joao-fragoso,
[email protected], ∗∗ Electrical Engineering Department, Universidade Federal do Rio Grande do Sul, Porto Alegre-RS, Brazil.
[email protected] Abstract: Electronic auscultation is an efficient technique for capturing lung sounds and analysis of these sounds permits to evaluate the health condition of the respiratory system. Since the lung sound signals are non-stationary, the conventional method of frequency analysis is not highly successful in diagnostic classification. This paper presents a method of analysis of lung sound signals using the Wavelet Packet Transform (WPT), and classification using artificial neural network (ANN). Lung sound signals were decomposed into the frequency sub-bands using the WPT and a set of statistical features was extracted from the sub-bands to represent the distribution of wavelet coefficients. An ANN is trained and then applied to classify the lung sounds into one of three categories: normal, wheeze or crackle. This classifier was embedded in a microcontroller to provide an automated and portable device that will provide support for research and diagnosis in the evaluation of the respiratory function. Keywords: Bio-Signal Processing, Embedded Systems, Neural Networks, Pattern Recognition 1. INTRODUCTION
quite effective for classifying lung sounds in two categories: normal vs. adventitious.
Pulmonary auscultation via a stethoscope is an inexpensive and noninvasive method widely used by clinicians for the evaluation of respiratory disorders. However, application of the stethoscope in research studies has been limited due to the inherent inter-observer variability and subjectivity in the interpretation of lung sounds. The diagnostic value of auscultation in detecting abnormal lung sounds in clinical research could be much improved if implemented using an objective and standardized method of interpretation.
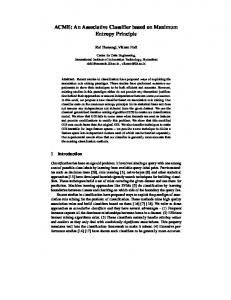
In this paper we propose the use of Wavelet Packet Transform (WPT) for feature extraction, combined with ANN’s for classification based on these features. We present a system that classifies lung sounds in three classes: normal, wheeze and crackle. The system was implemented in a microcontroller for real-time lung-sound monitoring and classification. The main purpose of embedding the classifier in a microcontroller is to provide a portable device for clinical support, to be applied as shown in Figure 1. In this schema, one microphone is placed on the patient’s chest, so the sounds can be captured, processed and then sent to a working station or via internet to the doctor. The best design choices for this system were determined by means of extensive studies comparing the different choices for various design parameters - Wavelet function, number of hidden neurons, activation function, etc. This comparison took into account both the classification performance and the adequacy to the practical limitations imposed by the embedded implementation.
Computerized analysis of recorded lung sounds may offer a systematic approach to the diagnosis of different respiratory conditions via automated classification of acoustic patterns. Adventitious sounds can be generally classified in Crackles and Wheeze sounds. Crackles are discontinuous, adventitious non-musical respiratory sounds which are attributed to sudden bursts of air within bronchioles. Their duration is less than 20 ms and their frequency range is between 100 to 2kHz. Wheezes are described as relatively "continuous" sounds as compared to crackles; they usually last for more than 200 milliseconds and have a musical quality - Serbes et al. (2011). Significant efforts have been directed toward the application of signal processing techniques and artificial intelligence in attempting to classify lung sounds - Kandaswamy and Kumar (2004), Charleston-Villalobos et al. (2011) and Matsunaga et al. (2009), among others. Some of these works combine the Wavelet Transform and Artificial Neural Networks (ANNs), with promising results: Kandaswamy and Kumar (2004), Matsunaga et al. (2009). This combination has been shown to be 1
The paper is organized as follows. In the next Section we briefly describe the Wavelet Packet Transform and ANNs used in this work. The Database is also presented in this section, as well as the implementation features. The numerical results are presented in Section 3, along with a comparative analysis of these results for different design choices and their implications. Finally, Section 4 presents concluding remarks, also pointing out future work.
Work supported by CAPES
Copyright © 2014 IFAC
2975
19th IFAC World Congress Cape Town, South Africa. August 24-29, 2014
Fig. 1. System scheme: sensors are placed on the patient to capture lung sounds and process them using a microcontroller. The results are transmitted by a radio-frequency module to a work station. 2. MATERIALS AND METHODS 2.1 Wavelet Packet Transform The Wavelet Transform has become a major tool in signal processing along the past decades, with applications for feature extraction as well as to its analogue problem of data compression, even for 2-D signals, as in Mallat (1989), Coifman and Wickerhauser (1995), Parraga et al. (2002). The Wavelet Packet Transform is a generalization of the Discrete Wavelet Transform which is defined by the inner product of a signal x(t) with the Wavelet function ωsf p (t): Z∞
def
λsf (p) = hx, ωsf p i =
−s/2
x(t)2
−s
ωf (2
t − p)dt (1)
t=−∞
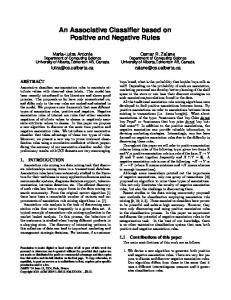
In equation (1), λsf (p) are the coefficients of the signal expanded into the dilated and normalized Wavelet Packet functions ωsf p (t) = ωf (2−s t − p), s ∈ Z is the scale index (or dilatation), p ∈ Z is the translation index and f ∈ R is the frequency index related to the oscillations, with s > 0, p > 0, f > 0. Figure 2 shows a Wavelet Packet Transform (WPT) until the third level of decomposition.
Feature Extraction In order to quantify the information content in each subband, a function must be defined that represents concisely the information at each node. The use of such a function reduces dimension, at the same time that it represents efficiently the contents of the signal decomposition. Among the most commonly used functions for such information measurement are the Shannon entropy and the energy log - Coifman and Wickerhauser (1992). In this paper we present results using these two functions for feature extraction, besides mean and standard deviation. Wavelet Bases A wide variety of different Wavelet basis functions are available in the literature and the performance of the classification obviously depends on the basis function chosen. The choice and order of the wavelet to be used must depend on the dominant features of the signal being analysed. The basis functions should match the signal as closely as possible. Nine different basis functions have been tested in this paper: Daubechies (DB) 1, 5, 8 and 12, Digital Meyer (Dmey), Symlet (Sym) 4 and 10, Coiflet (Coif) 2 and 4. More details on Wavelets Basis can be found at Daubechies (1992). The performance of the classifier has been assessed for each basis function, and a detailed comparison is presented later on. For each Wavelet basis the signal will be decomposed down to the fifth level of the Wavelet tree, which corresponds to a decomposition into 32 frequency sub-bands. The bandwidth of each node of the Wavelet tree is 172Hz. Since the lung sounds don’t carry relevant information at frequencies above 2.5kHz, as seen in the spectrograms of Figure 3, we used only the first 16 nodes of the wavelet decomposition. After the last level of decomposition, a feature extraction function will be applied to each node in order to reduce dimensionality, creating a 16thorder vector to feed the input layer of the Artificial Neural Network. 2.2 Artificial Neural Network
Fig. 2. Wavelet Packet Transform - multiresolution decomposition. The WPT can be efficiently implemented by means of digital filters using multi-resolution analysis, which is a method that represents signals in multiple frequency bands. These digital filters are called Quadrature Mirror Filters (QMF), which filter and then decimate the signal - Mallat (1989). The Wavelet Packet decomposition can be calculated from the QMFs, H and G, on the coefficients λsf (p) , according to: X λs+1,2f (p) = h(j)λsf (2p − j) = Hλsf (p) (2) j∈Z
λs+1,2f +1 (p) =
X
g(j)λsf (2p − j) = Gλsf (p)
(3)
j∈Z
where H and G consist in a low-pass and a high-pass filter, respectively.
Artificial Neural Networks (ANNs) are conceived to mimic the behavior of biological neural networks. ANNs are composed of devices capable of capturing, transforming, storing and exchanging data, in such a way that they can learn to recognize data or to make decisions in the same way as a biological neural network. The main abilities of an ANN, which are explored in our implementation, are pattern recognition, decision making and extrapolation. These are consequences of the ANN’s massive and parallel structure that allows it to learn by experience Acharya et al. (2003). The learning process is finished when an ANN reaches a general solution to a class of problems. Like the human being, ANNs learn from input (training) data. Learning algorithms are divided into two classes: supervised learning, when an external agent tells the network the correct output corresponding to a certain input data, and unsupervised learning, where there is no such external agent. The knowledge obtained by the ANN is stored in weights of the connections among the neurons. Once the training is completed, the ANN should be able to extrapolate its recognition and decision making ability to new input data (different front the training data), in other words, new situations of the real world. There are three important decisions to make when constructing an ANN for a given application: (1) the network topology,
2976
19th IFAC World Congress Cape Town, South Africa. August 24-29, 2014
(2) the learning algorithm and, (3) the activation function. These decisions have to be taken according to the available input data and the nature of the final classification. Many learning algorithms are found in the literature, as well as in practical applications, the most commonly favored being the Backpropagation, described in Hasson (1995). The process to determine the appropriated topology, learning algorithm and activation function for this work is described in the following. ANN Classification and Feature Extraction The artificial neural networks are widely used in biomedical signal analysis, for modelling and diagnosis, as in Arbib (2003). An ANN has to be trained to adjust the weights, to find the correct mapping from the entries to the outputs.
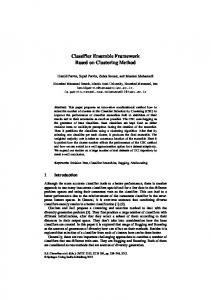
no more than 20ms. We can see in Figure 3(b) that crackles have long and high lines in the spectrogram (red colour). Wheeze sounds, on the other hand, are continuous sounds and have a visible signature in the spectrogram, presenting continuous frequencies with high magnitudes, as shown in Figure 3(c). We also confirmed that the frequencies of interest lie in the range 40Hz to 2.5kHz, as reported in Gurung et al. (2011). These spectrograms indicate that there are indeed feature differences among the various lung sounds classes, suggesting that these features could be used to automatically distinguish these classes from one another. The extraction of these features will be performed by Wavelets since it can represent the signal in frequency subbands in a concise way.
All the nine Wavelet bases cited in Section 2.1 will be tested using the following four feature extraction functions for each node of the wavelet decomposition: Shannon entropy, absolute mean values, mean power and standard deviation. The output of the ANN will be coded as: " # " # " # 0 0 1 vNormal = 0 , vCrackles = 1 , vWheeze = 0 . 1 0 0 The ANN used in this work is also the most commonly applied for classification: the Backpropagation network. There are various kinds of implementation of Backpropagation algorithms, so we have performed tests with four different algorithms: Resilient Backpropagation (RP) (which, according to Kandaswamy and Kumar (2004), is the best), LevenbergMarquardt Backpropagation (LM), Scaled Conjugate Gradient Backpropagation (SCG) and the Gradient Descent with Adaptive Learning Rate backpropagation (GDA). For error function we used mean squared error (MSE) and the activation functions we tested: log-sigmoid (logsig), Hyperbolic tangent sigmoid (tansig) and step.
(a)
(b)
(c)
The database we used contains 92 lung sounds (see 2.3), of which 60 sounds will be used for training the ANN, 7 for test and 7 for validation as part of training process. The remaining 18 sounds in the database will be used to assess the performance of the trained ANN.
Fig. 3. Spectrogram of 3 breathing Lung Sounds: (a) normal (b) crackles (c) wheeze.
2.3 Database and Preliminary Lung sounds Analysis
The signals must be normalized in amplitude in order to account for variability in the data collecting process and this normalization can be performed in different ways. The influence of the normalization procedure on the performance of classification has also been analyzed. We compared the results of the sound without normalization, and also using normalization by L1 norm, L2 -norm and L∞ -norm.
For this work, we used a Database provided by Lehrer (2002). The database has 92 lung sounds recorded and diagnosed by a doctor, 27 of which are normal and the remaining recordings have been diagnosed as pathological, featuring two types of abnormality: crackles (31 cases) and wheezes (34 cases). Each sound has a single respiratory cycle and duration of about 3 seconds. These sounds have the sampling frequency of 44.1kHz. The whole database was downsampled by 4 in order to reduce the number of samples and consequently the memory and signal processing requirements. The anti-alias filter used previously to downsampling was a Chebyshev of order 8 with cutoff frequency of 5.5kHz. To illustrate the spectral difference between these 3 classes of lung sounds, a spectrogram was found for each sound, as seen in Figure 3. These spectrograms were calculated using 512 FFT-points with a 50% overlap hamming window. The adventitious lung sounds can be divided in continuous and discontinuous. Crackles, for instance, are discontinuous adventitious sounds, which present a short explosion, usually lasting
2.4 Signal Normalization
2.5 Embedding the Algorithm The microcontroller chosen to implement the system is the Atmel ARM Cortex-M3 CPU. This is a low-cost microcontroller with a core of 32-bit. Its clock is at 84 MHz, with a one clock per instruction for 4 byte instructions. It has two DAC (digital to analog conversion) with 12 bits, a SRAM memory of 96 KBytes, a 512 KBytes flash memory for code, and a SPI interface to save data in the SD card. It can also manipulate floating pointing instructions with 32 bits. Before embedding the ANN, we first found the best design parameters using Matlab (MATLAB (2010)). Training of the ANN has also been performed in Matlab. After the ANN was
2977
19th IFAC World Congress Cape Town, South Africa. August 24-29, 2014
designed, trained and validated, its weights and Bias were exported to the Microcontroller. The Wavelet Packet Transform were implemented in the microcontroller using convolution operation. 3. RESULTS This section presents the results of design choices for the classification of lung sounds in 3 different classes: normal, crackles and wheeze. The design choices comprise normalization function, Wavelet basis, feature extraction function, number of neurons at the hidden layer and activation functions. Normalization of the signal is an important factor as a preliminary signal treatment. Table 1 shows the performance of the classification with three normalizations: normalization by L1 norm, L2 -norm and L∞ -norm and without normalization. The assessments were done for 3 Wavelet Basis, using a ANN with 19 neurons. L2 -norm L1 -norm L∞ -norm None
Sym10 98,89% 87,41% 82,96% 75,56%
DB5 97,41% 89,63% 84,81% 79,26%
Coif2 96,30% 84,44% 80,00% 73,70%
The importance of using normalization is clear in Table 1, since the results obtained without normalization are significantly poorer than with any kind of normalization. Moreover, the best results are obtained with the L2 -norm, which for this reason we’ll be used from now on. The presentation of the results is divided into two sections. Section 3.1 presents how the ANN was generated. Section 3.2 verify the reliability of the results obtained with the microcontroller and also a discussion about the parameters that impact the classifier performance. 3.1 Analysis of Parameters Effect on the classification Activation Function A parameter that has a major effect on the classification performance is the choice of activation function for both layers of the ANN. To study this effect we fix the remaining design parameters of the ANN as follows: 19 neurons in the hidden layer, Shannon entropy as the feature extraction function, the Resilient Backpropagation algorithm, and MSE for the error. Table 2 shows the results of the combinations of log-sigmoid, Hyperbolic tangent sigmoid and step for both the hidden and the output layers. The best results have been obtained using logsigmoid (logsig) for the hidden layer and Hyperbolic tangent sigmoid (tansig) for the output layer, hence this combination of activation functions will be the choice kept in all further results.
The classification performance of the ANNs with each one of the basis functions is shown in Table 3. This table shows, for the data which were left out from the training process (unbiased data), the percentage of mean classification success for several number of neurons at the hidden Layer of the ANN for all Wavelet Bases used in this work. Observing these results, it is seen that Symlet was the Wavelet Basis that provided the highest accuracy for almost all the numbers of neurons, so this will be the basis of choice to proceed. Between Symlet 4 and Symlet10 we adopt the first one because of its smaller complexity, which is an important factor since the filters will be implemented in a microcontroller.
In the results presented thus far in this paper, the Shannon entropy was used as the feature extraction function. Other feature extraction functions were also analyzed and compared, namely mean absolute value, mean power and standard deviation. For this comparative analysis, we fixed randomly 10 different number of neurons. Figure 4 shows the performance for each feature extraction function associated with Symlet 4. The standard deviation presented the best results for all number of neurons tested. Similar experiments were done with all Wavelet Bases and have driven to a similar conclusion. The final result of the analysis of the effect of the design parameters on the ANN performance led to the following choices: the wavelet Basis Symlet 4, standard deviation as the feature extraction function, log-sigmoid and tangent-sigmoid as the activation functions of the hidden and output layers respectively, and 74 neurons in the hidden layer. The ANN so configured, corresponding to the highest bar in Figure 4, provided a correct classification of 99.26%.
Output
H Layer Hidden HH HH Layer
step tansig logsig
There is not a magic number of how many neurons will yield the best results, but it is possible to find a good compromise. An ANN with little or too many neurons can lead to a wrong mapping, because of the underfitting and overfitting, according to Guyon and feng Yao (1999), respectively. Moreover, we would like to keep the number of neurons to a minimum in order to facilitate its embedding in a low cost microprocessor board.
Feature Extraction
Table 1: Classification results for different normalization functions.
HH
Number of Neurons
step
tansig
logsig
0.00% 33.33% 0,00%
33.33% 89.26% 98.89%
33.33% 57.04% 47.41%
Table 2: Classification results for different activation functions for output and hidden layers.
Fig. 4. Performance results using four different feature extraction functions for 10 different number of neurons.
2978
19th IFAC World Congress Cape Town, South Africa. August 24-29, 2014
Num. of Neurons 6 9 11 19 25 28 29 33 35 42 45 50 54 60 64 67 69 70 74 77 83 85 89 90 96 104 111
Coif2 89.26% 91.48% 94.44% 95.18% 96.30% 94.81% 95.93% 97.04% 94.44% 96.30% 95.93% 95.56% 97.78% 97.04% 95.19% 96.30% 96.30% 95.56% 96.30% 96.67% 97.41% 94.44% 94.44% 97.41% 96.67% 95.56% 18.52%
Coif4 86.67% 91.11% 94.81% 96.30% 91.48% 95.19% 95.93% 94.07% 95.19% 95.56% 92.22% 93.70% 92.59% 97.78% 97.04% 96.67% 95.56% 94.81% 97.41% 97.04% 96.30% 95.19% 97.41% 96.67% 97.41% 92.96% 18.89%
DB1 81.11% 89.63% 89.63% 92.97% 88.52% 91.11% 94.81% 91.11% 86.30% 85.93% 93.33% 92.22% 90.37% 90.74% 91.85% 87.78% 88.52% 88.89% 90.74% 87.78% 93.33% 91.85% 93.70% 89.26% 92.22% 92.96% 17.78%
DB5 88.15% 89.63% 92.59% 91.85% 91.48% 95.19% 91.11% 95.93% 94.07% 95.93% 92.22% 94.81% 96.67% 92.22% 96.30% 97.41% 94.81% 95.93% 96.67% 96.67% 97.78% 97.41% 94.44% 96.30% 96.67% 91.48% 18.89%
DB8 84.81% 90.00% 96.30% 91.85% 95.19% 95.93% 95.93% 96.30% 95.56% 91.85% 94.81% 96.30% 96.30% 92.96% 97.04% 94.07% 94.81% 96.30% 96.67% 91.85% 95.93% 95.56% 95.19% 92.22% 95.93% 97.41% 19.63%
DB12 91.48% 88.89% 92.96% 95.56% 95.19% 95.93% 94.07% 94.81% 95.93% 95.56% 95.19% 95.56% 95.19% 97.78% 96.67% 95.56% 94.07% 94.81% 98.15% 96.30% 94.81% 97.78% 95.93% 94.44% 96.67% 92.96% 19.63%
Dmey 82.59% 84.07% 85.56% 90.71% 91.85% 90.00% 87.41% 90.74% 88.89% 92.96% 91.48% 91.11% 90.74% 90.74% 92.59% 91.85% 94.81% 92.22% 90.00% 92.59% 91.11% 89.26% 88.52% 91.85% 90.00% 91.85% 17.78%
Sym4 91.85% 92.59% 96.67% 95.93% 96.67% 94.07% 97.04% 94.81% 95.19% 94.44% 94.81% 94.44% 96.30% 97.04% 94.44% 95.56% 95.19% 96.67% 96.67% 96.67% 94.81% 96.67% 92.96% 96.67% 96.67% 95.56% 19.26%
Sym10 90.00% 96.30% 95.56% 93.33% 95.93% 97.04% 95.56% 94.81% 96.67% 92.96% 97.04% 93.33% 97.78% 94.81% 97.04% 98.89% 96.67% 96.67% 97.41% 98.52% 95.56% 95.56% 94.81% 98.52% 96.30% 97.04% 19.63%
Table 3: Mean Average percentage of correct classification with nine wavelet Basis and several number of neurons at the hidden Layer. Numbers in bold indicate the best results achieved for each number of neurons. Data used for training were not included in these measurement. 3.2 Embedding the system in a ARM Microcontroller The WPT was implemented in the microcontroller using the convolution equations (2) and (3). The memory capacity of the microcontroller is not enough to store all the Wavelet Tree decomposition, so a SD memory card has been used as an auxiliary memory. At each decomposition level the results are saved as a new file in the SD card. As we move along the tree, like in Figure 2, this file is opened, convolution is performed and its result is written back to SD memory. To validate the microcontroller implementation, we have compared its results with the results obtained using Matlab, which is considered as the gold standard. This comparison was performed using the first 3 values and the last 3 values of the fifth level of decomposition. The highest error found between the results of the signal decomposition using Matlab and the microcontroller was 0.000046%, showing the correctness and the numerical robustness of the embedded implementation. Classification Results The ANN was trained and generated using Matlab and the weights and biases of the layers were exported to the microcontroller board. Figure 5 illustrates the functions implemented in the microcontroller. The variables R,S,b,f refer to the size of the input vector, the number of the neurons, bias and the activation function, respectively. IW (Initial Weights) and LW(Layer Weights) refer to the weights for both layers, where each one is connected to the inputs, accordingly to the Figure 6. The classification results were then compared to those obtained with Matlab, taken again as gold standard. The results matched up to five significant digits, as illustrated by the example below, which refers to the classification for Wavelet Symlet 4 with 50 neurons.
Fig. 5. ANN used (Figure from Neural Network toolbox users guide MATLAB (2010) ). "
#
"
#
0.072628095746040 0.072628596201170 vMatlab = 0.716207817578748 , vMicrocontroller = 0.716208159923553 . 0.188396885991096 0.188396990642668
Processing Time We have performed the analysis of the impact on the number of neurons on the processing time. The embedded ANN was tested with six different numbers of neurons in the hidden layer: 10, 30, 50, 70, 80 and 90. The difference in processing time between the classification using 10 and 90 neurons is only 7.3 miliseconds, which leads to the conclusion that the number of neurons does not impact significantly the processing time, even though it does critically impact the allocated memory. The classifier takes 20 to 50 seconds to perform the whole classification, including all stages of the process: opening the signal file in the SD card, calculating the WPT decomposition, writing to the SD card and finally entering the ANN. The use of the SD card is the dominant block regarding processing time, which depends strongly on the signal size. The writing and reading rate at the card is around 500KBytes/s.
2979
19th IFAC World Congress Cape Town, South Africa. August 24-29, 2014
REFERENCES
Fig. 6. A detail of one layer of the ANN (Figure from Neural Network toolbox users guide MATLAB (2010) ).
4. CONCLUSIONS The sounds coming from the lungs can provide important information about the respiratory system of a patient. The electronic sound acquisition analysis can be used to support medical diagnosis. Thus a system allowing the easy acquisition and analysis of lung sounds has the potential of being a substantial aid in clinical diagnosis, particularly if implemented in a portable platform. In this paper we have described the development and the performance assessment of such a system. We have applied the Wavelet Packet Transform and an Artificial Neural Network to classify real lung sounds into three classes, one normal and two pathological. The various design choices that have to be made have been described and justified, and the best performing choices have been kept. The design that gave the best performance was the use of Symlet 4 as the Wavelet basis, standard deviation as the feature extraction function, an ANN with 2 layers and 74 neurons trained using the Resilient Backpropagation algorithm, and different activation functions for the hidden and output layers: log-sigmoid logarithm and Hyperbolic tangent sigmoid, respectively. With these design choices we have arrived at a 99.26% success rate in the classification. The classifier thus designed has been fully and successfully embedded in a low cost microprocessor board. As future work, the embedded classifier will be integrated into a fully automated and interfaced acquisition system, as depicted in Figure 1.
Acharya, R.U., Subbanna, P., Iyengar, S., Rao, A., and Dua, S. (2003). Classification of heart rate data using artificial neural network and fuzzy equivalence relation. Pattern Recognition, 36(1), 61 – 68. Arbib, A. (2003). The Handbook of Brain Theory and Neural Networks. A Bradford book. MIT Press. Charleston-Villalobos, S., Martinez-Hernandez, G., GonzalezCamarena, R., Chi-Lem, G., Carrillo, J.G., and AljamaCorrales, T. (2011). Assessment of multichannel lung sounds parameterization for two-class classification in interstitial lung disease patients. Comput. Biol. Med., 41(7), 473–482. Coifman, R.R. and Wickerhauser, M.V. (1992). Entropy-based algorithms for best basis selection. IEEE Transactions on Information Theory, 38, 713–718. Coifman, R.R. and Wickerhauser, M.V. (1995). Experiments with adapted wavelet de-noising for medical signals and images. In in Time Frequency and Wavelets in Biomedical Signal Processing, ser. IEEE Press Series in Biomedical Engineering, 323–346. Daubechies, I. (1992). Ten Lectures on Wavelets. CBMSNSF Regional Conference Series in Applied Mathematics. Society for Industrial and Applied Mathematics. Gurung, A., Scrafford, C.G., Tielsch, J.M., Levine, O.S., and Checkley, W. (2011). Computerized lung sound analysis as diagnostic aid for the detection of abnormal lung sounds: A systematic review and meta-analysisa. Journal of Respiratory Medicine, 105, 1396–1403. Guyon, X. and feng Yao, J. (1999). On the underfitting and overfitting sets of models chosen by order selection criteria. Journal of Multivariate Analysis, 70(2), 221 – 249. Hasson, M. (1995). Fundamentals of artificial neural networks. Bradford books. Mit Press. Kandaswamy, A. and Kumar, C. (2004). Neural classification of lung sounds using wavelet coefficients. Computers in Biology and Medicine, 34. Lehrer, S. (2002). Understanding lung sounds. Number v. 3 in Book & Cassette. Saunders. Mallat, S.G. (1989). A theory for multiresolution signal decomposition: The wavelet representation. IEEE Trans Pat Anal Mach Intell, (11), 674–693. MATLAB (2010). version 7.10.0 (R2010a). The MathWorks Inc., Natick, Massachusetts. Matsunaga, S., Yamauchi, K., Yamashita, M., and Miyahara, S. (2009). Classification between normal and abnormal respiratory sounds based on maximum likelihood approach. In Proceedings of the 2009 IEEE International Conference on Acoustics, Speech and Signal Processing, ICASSP ’09, 517–520. IEEE Computer Society. Parraga, A., Zaro, M., and Schuck, A. (2002). Quantitative assessment of the use of continuous wavelet transform in the analysis of the fundamental frequency disturbance of the synthetic voice. Medical Engineering and Physics, 24(7), 553–559. Serbes, G., Sakar, C.O., Kahya, Y.P., and Aydin, N. (2011). Effect of different window and wavelet types on the performance of a novel crackle detection algorithm. volume 6935 of Lecture Notes in Computer Science, 575–581. Springer.
2980