International Journal of Bio-Science and Bio-Technology Vol.8, No.2 (2016), pp.265-278 http://dx.doi.org/10.14257/ijbsbt.2016.8.2.25
An Evaluation of Automated Tumor Detection Techniques of Brain Magnetic Resonance Imaging (MRI) Fazli Wahid1, Muhammad Fayaz2 and Abdul Salam Shah3* 1
JEJU National University, South Korea University of Malakand, KPK, Pakistan 3 SZABIST, Islamabad, Pakistan 1
[email protected],
[email protected], 3*
[email protected] 2
Abstract Image processing is a technique developed by computer and Information technology scientist and being used in all field of research including medical sciences. The focus of this paper is the use of image processing in tumor detection from the brain Magnetic Resonance Imaging (MRI). For the brain tumor detection, Computed Tomography (CT) and Magnetic Resonance Imaging (MRI) are the prominent imaging techniques, but most of the experts prefer MRI over CT. The traditional method of tumor detection in MRI images is a manual inspection which provides variations in the results when analyzed by different experts, therefore, in view of the limitations of the manual analysis of MRI, there is a need for an automated system that can produce globally acceptable and accurate results. There is enough amount of published literature available to replace the manual inspection process of MRI images with the digital computer system using image processing techniques. In this paper, we have provided a review of digital image processing techniques in the context of brain MRI processing and critically analyzed them for the identification of the gaps and limitations of the techniques so that the gaps can be filled and limitations of various techniques can be improved for precise and better results. Keywords: Brain Tumor, Central Nervous System, Computed Technology (CT), Digital Image Processing, Magnetic Resonance Imaging (MRI), MRI Classification, Tumor Detection.
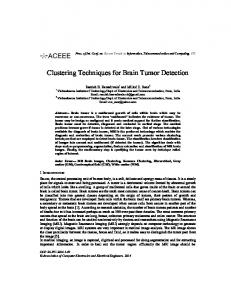
1. Introduction The brain tumor has attracted researchers due to its life taking characteristics. The traditional method of tumor detection of brain images is mostly through manual inspection which lacks the properties of reproducibility and may generate diverse results under different conditions [1]. For the accurate and effective analysis without influence of the different conditions, there is an intense need for automation of the process of tumor detection for brain images [2]. The understanding of the human nervous system is important before applying image processing techniques to detect the tumor from the brain MRI. The nervous system consists of Central Nervous System (CNS) and Peripheral Nervous System (PNS). The Central Nervous System (CNS) is further divided into the brain and spinal cord. The areas of interest here is the brain and for the brain tumor detection, most of the researchers have considered the white matter, gray matter, and cerebrospinal fluid [2]. The white matter contributes about sixty percent of total brain volume, gray matter contributes forty percent and the cerebrospinal fluid keeps the whole brain in a secure environment from all the internal and external shocks due to its soft tissues that keep the brain soft [3]. *Corresponding Author
ISSN: 2233-7849 IJBSBT Copyright ⓒ 2016 SERSC
International Journal of Bio-Science and Bio-Technology Vol.8, No.2 (2016)
Figure 1. (a) White and Gray Matter of Brain (b) Cerebrospinal Fluid [4] The brain tumors are of different types and have different potential level of causing the damage to the human brain. The World Health Organization (WHO) has divided the whole brain tumors into nine types, depending on the part of the brain they affect and their point of origin cells. The major type of tumors is Gliomas that affects the Central Nervous System and it has been further categorized into Astrocytes, Oligodendrocytes, Ependymal Cells and Microglia. The most dangerous and common type of brain tumors is Astrocytes which contributes 30% to the total brain tumors [5]. For the brain tumor detection, Computed Tomography (CT) and Magnetic Resonance Imaging (MRI) are the prominent imaging techniques used nowadays but most of the experts prefer MRI, over CT. The MRI captures much finer details as compared to the Computed tomography (CT) and same is more suitable for the automated tumor detection by utilizing the digital image processing techniques [6], [7], [8]. The detailed comparison of CT and MRI images is provided in table 1. Table 1. Comparison of CT and MR Images [9] Characteristics
Computed Tomography (CT)
Cost
The cost of CT usually ranges from $1200 to $3200. The session usually, takes 5 minutes. The CT is not suitable for children and pregnant women due to the higher radiations. The CT have negative effects on the body due to radiations. The operator can change the plane without patient movement.
Session Time Radiation
Body Effects Plane Changing Without Patient Movement Major Applications Soft Tissues Details
The CT is suitable for hard tissues of the body, like bones. The CT cannot capture finer details of soft tissues.
Magnetic Resonance Imaging (MRI) The cost of MRI usually ranges from $1200 to $4000. The session usually, takes 30 minutes. The MRI is suitable for everyone due to nil radiations. The MRI have no negative effects on the body due to nil radiations. The MRI can take images in any plane. The MRI is more suitable for soft tissues of the body, like brain tissues. The MRI can capture finer details of soft tissues.
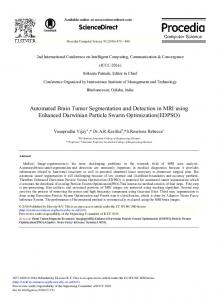
The MRI is more costly than CT but still it is mostly used technique for brain tumor due to the other advantages over CT [6, 7, 8]. The digital image processing is applicable in all those areas of medical sciences where the image captured from the human body parts is the primary source for the analysis of the body organs. The information collected from this processing is then used for the diagnosis and treatment of different diseases [10]. The overall process and steps of detection of tumor in the digital MRI of the brain is summarized in the following stages i.e. MRI processing, MRI feature extraction, MRI segmentation and MRI post-processing [11]. The images of MRI with normal brain and with a brain tumor are shown in Figure 2.
266
Copyright ⓒ 2016 SERSC
International Journal of Bio-Science and Bio-Technology Vol.8, No.2 (2016)
Figure 2. (a) MRI with a Normal Brain (b) MRI with a Brain Tumor [13] The proper segmentation of the area of the tumor from the MRI images enhances the accuracy rate of the image processing techniques. In order to process MRI images, the researcher must have a deep understanding of the procedures being performed for processing of different types of digital images with special reference to the MRI images and the brain structure. So for the understanding of the segmentation and tumor detection techniques and to identify limitations of different techniques used by researchers all over the world for processing MRI images , we have carried out this review and critical analysis of the techniques. The remaining structure of the report is, section II presents Literature Review, section III contains summarized Critical Evaluation of the techniques and finally, in section IV, the Conclusion and Future Work is provided.
2. Literature Review The research in the area of image processing for the tumor detection from MRI of the brain is being carried out since last decades; some of recent techniques proposed are reported here. Iscan et al., in [11] has focused on tumor detection in brain MRI by finding asymmetry in the left or right hemisphere of the brain. For the segmentation of MRI image they have used the incremental supervised neural network. The continuous wavelet transform has been applied for the brightness of images and the Zernike Moments has been used for the vector representation [12]. To find the symmetry, Euclidean distance has been calculated among tissues on both sides of symmetry axis in the left and right hemisphere. If the normalized Euclidean distance is lower than a specific threshold, it means that there is no tumor in the brain. If it is higher than that threshold, it means that the tumor is present in the brain tissue. When the asymmetry in the image has been found, the normalized Euclidean distance has been weighted and the longest weighted normalized distance was identified. The tissue that has longest Euclidean distance has been considered to contain tumor. After the identification of tumor tissues, the location within the tissue has been found. The methodology has shown 100% accuracy in the segmentation of both the types of images. Zarandi et al., in [13] used the type-II fuzzy technique by applying image processing procedure for the detection of the tumor from MRI of the brain. The ambiguities regarding the classification of data have been removed by applying Fuzzy logic on those specific areas. The type-II logic is three-dimensional consisting of data, membership values and the membership values of the membership values. The fuzzy fusion technique works on if-else rule [14]. The typeII probabilistic C-Mean (T2PCM) has been used to divide the whole MRI image into four types namely White Matter, Gray Matter, Cerebrospinal Fluid and Abnormal Region [15] [16]. The main arguments taken by T2PCM are the number of clusters in which the data is to be divided and the amount of fuzziness. During the
Copyright ⓒ 2016 SERSC
267
International Journal of Bio-Science and Bio-Technology Vol.8, No.2 (2016)
segmentation stage, fuzzy logic has been used to find clear boundaries of different segments. The combination of a total of 95 patient’s images was considered having both normal and abnormal images and the system has shown the accuracy of 78.94%. Demirhan and Guler., in [17], segmented MRI images by using a procedure that combines stationary wavelet transformation with self-organization map. The Internet Brain Segmentation Repository (IBSR) has been used that contains standard images as well as their result of segmentation that has been performed by MRI experts. The edges of the images were detected and smoothed by applying Anisotropic Diffusion Filter [18]. For the segmentation, Stationary Wavelet Transform filter has been used and these segments were recognized by, the Neural Network and Self-Organization Map (SOM). The results were optimized by learning vector quantization, a supervised learning algorithm. The result of proposed system with the manually segmented images was highly robust but the model has shown less accuracy with automated segmentation and same needs to be improved. Ibrahim et al., in [19], used the supervised feed forward Back-Propagation Neural Network for the detection of a brain tumor in the MRI images. The dimensions of the data have been reduced by Principal Component Analysis (PCA). The backpropagation have an advantage of fast learning rate and for training the .trainlm function is mostly used but it also requires a lot of memory to run beside its fast training property. The Artificial Neural Network (ANN) having three layers has been used i.e. 1) the input layer that contains 64 artificial neurons, 2) the middle (hidden) layer that has 10 artificial neurons, 3) the output layer that has 64 artificial neurons like the input layer. The images were divided into four classes' namely normal tissue, cancerous tissue, Edema and not classified class. The model has proved 96.33% accurate result. Juang and Wu, [20], model based on finding the injury or wound in the MRI of the brain by using color-based segmentation with k-means. The brain MRI have many peaks and several thresholds that have been found by parametric distribution based method, each pixel has been assigned the cluster to which it may belong by kmeans clustering. Three different types of images were considered. i.e. T2-weighted MRI, T1-weighted MRI, and Spin density MRI. The model works better for the T2weighted MRI, whereas its’ effect on T1-weighted MRI and spin density MRI are not satisfactory. Zhang and Dong in [21] used a combination of three different algorithms. They have used T-2 weighted MR brain images for the experimentation. For the time representation to images, the Short Time Fourier Transform has been used. The boundaries of the images were calculated using symmetric padding method [22]. The time and frequency information were preserved by applying wavelet transform. The dimensions of data were reduced by the principal component analysis. In order to find whether the given MRI is normal or abnormal, the artificial neural network having 19 neurons input layer has been used. The total of 66 randomly chosen images was considered and the system has shown 100% accuracy. The execution time for each image processing was 0.0451 s which is quite satisfactory. Simões et al., in [23], used the Gaussian Mixture Model (GMM) for the segmentation of the brain MRI for identification of three major classes of the brain including Cerebrospinal Fluid (CSF), White and Gray Matter (WM/GM) and the White Matter with higher intensities [24]. The model has a major drawback that it uses two steps for pre-processing of the image namely skull skipping from the brain MRI and the field bias correction. Total of 40 FLAIR images have been used and the results were compared to manual segmentation and the system provided better accuracy than manual segmentation [25].
268
Copyright ⓒ 2016 SERSC
International Journal of Bio-Science and Bio-Technology Vol.8, No.2 (2016)
Ortiza et al., in [26], performed features selection and segmentation with SelfOrganization Map (SOM) clustering. The images from the ISBR 2.0 and 1.0 database have been used. In order to distinguish different tissues of the brain, the histogram of the image has been calculated. The peaks and the valleys in the histogram have been used for each peak of the image corresponds to a single tissue of the image. The different units belonging to the same group has been placed together in the same group and the borders of each class were identified. For the clustering k-means algorithm was utilized. Two types of features were extracted i.e. textual information and the moment invariant. The images were classified with SelfOrganization Map (SOM), the sensitivity and specificity of EGS-SOM is better than that of HFS-SOM. Harati and Rasoul Khayati, in [27] used fuzzy connectedness algorithm for segmentation [28]. The noise has been removed by Anisotropic Diffusion Filter. The affected pixels have higher or lower intensities therefore the matrix has been formed by Gaussian Distribution Function so that all those pixels that laying in the abnormal range can be given low intensities of a specific value. The thresholding of the whole tumor detection matrix which consists of different ranges of pixels intensities determines the whole image mean and the radius of the neighborhood. The edges of the images were detected with the Cannys’ algorithm. The matrix of all the edge points is formed. The seed point selection has been further enhanced by making a comparison between the edge points’ matrix and the detector matrix. The different algorithms have been used by the author including the similarity index, the extra fraction and the overlap fraction for the evaluation of the proposed system. The result are 17.8% better than the general fuzzy using similarity index, 21.1% better than the general fuzzy using overlap fraction and 6.8% better than the general fuzzy using an extra fraction. Authors like Shanthi and Sasikumar in [29] used Neural Network and the fuzzy logic algorithm for the segmentation of MRI images. The center of images was selected and moving from the center in left, right, up and down directions and the region that encloses the whole brain from four directions were removed. The image segmentation has focused on dividing the whole image into three main re gions namely gray matter, white matter and cerebrospinal fluid. The fuzzifier divided the different regions according to membership values. For the clustering fuzzy logic has been used and the output of the fuzzy system has been fed as input to the artific ial Neural network which classifies the whole image into white matter, gray matter and cerebrospinal fluid. The T1-weighted MRI images have been considered for the testing. Iftekharuddin, in [30] used different MRI modalities including T1-weighted images, T2-weighted images, and FLAIR images [22]. Four different features have been extracted. i. The fractal dimension (FD) of the image that uses the geometry of the image to find different properties of the image. ii. The mBm texture features extraction method based on mBm process suitable for the process of brain segmentation. iii. Feature extraction using level set based shape method. iv. The KLD method that is based on the difference between two different probability distributions. In segmentation step, the whole MRI image has been segmented into four different sections including white matter, gray matter, cerebrospinal fluid, and the abnormal tissues. Three different algorithms have been used for the process of segmentation. i. The graph cut procedure in which the graph is the image itself and the pixels are the nodes of the graph.
Copyright ⓒ 2016 SERSC
269
International Journal of Bio-Science and Bio-Technology Vol.8, No.2 (2016)
ii.
The expectation maximization algorithm in which the feature vectors and intensity of all pixels as well as their texture information is used for segmentation. iii. The Laplacian matrix used to find out different values for classification of different tissues. The comparison of the results of all algorithms used gives different results according to their modality. In some cases, T1-weighted MRI gives better results than the T2-weighted MRI and the FLAIR whereas in other cases the output remained reverse. The visibility of the brain tissues representing tumor is also different for each type of the images. They range from poor to medium with the good in the middle range. Węglińskil and Fabijańska in [31] extracted the complete abnormal tissue by region growing algorithm. The seed point has been used to separate the affected area from the normal tissue. The noise is removed by the median filter because it preserves the edges without affecting the quality of the image. Three most important features of the pixels like the intensity of different pixels, standard deviation and the arithmetic mean of the neighboring pixels were used. Following areas were identified according to the intensity of the pixels. 1) Skin portion of the MRI, 2) The skull present in the brain MRI, 3) The gray and white matter of the brain and 4) The meninges of the brain. The results were satisfactory due to its simplicity and easiness of the method. The processing time has not been more than 20 seconds. The segmentation time was 2.9 seconds. It was observed that the time of execution increases very much due to pre-processing and the post-processing. Rajini and Bhavani in [32] used of K-Nearest Neighbor (KNN) and Artificial Neural Network (ANN) for the classification of MRI into normal or abnormal. The images were divided into sub-bands using Discrete Wavelet Transform (DWT), which were then used for features extraction. The execution time will be very high due to the huge amount of data, therefore, the data has been reduced for faster execution by Principal Component Analysis (PCA). The Artificial Neural Network and K-Nearest Neighbor (KNN) provided 90% is 99% accuracy respectively. Saha et al., in [33], proposed score based bounding box technique for approximate segmentation of tumor from brain MRI. The MR images were segmented into 2D slices and the region based global change has been observed . The tumor region of the image is considered as the change in the MR image. The unsupervised method has been adopted where the prior knowledge of the MR images was not present. The Fast Bounding Box (FBB) technique finds the most asymmetric regions between two halves of the MRI slices. The method generated box on an MR slice in the absence of the tumor of Edema. The fast bounding box technique has shown the accuracy of 92% for tumor detection and the accuracy of 89% for the detection of Edema. Selvakumar et al., in [34], used K-Means as unsupervised learning algorithm and Fuzzy C-Means algorithms for the segmentation of MR images. The approximate reasoning method has been used to recognize the tumor as the Edge Detection Method. The median filter has been used for the noise removal . The fuzziness of the image was defined by a membership function. For the detection of mass, the KMeans Algorithm is enough and the results of the proposed method are satisfactory.
3. Critical Evaluation The methodologies discussed in the literature review are summarized and critically analyzed in table 2.
270
Copyright ⓒ 2016 SERSC
International Journal of Bio-Science and Bio-Technology Vol.8, No.2 (2016)
Table 2. Critical Evaluation of the Automated MRI Techniques Refer Algorithm/ ence Technique [11] 2D Continuous Wavelet Transformation (CWT). Incremental Supervised Neural Network (ISNN). Zernike Moment by Vector Representation. Euclidean Distance. [13] Fuzzy Filters. Type-II Probabilistic CMean (T2PCM). Type-II Fuzzy Logic. Thresholding. Fuzzy Clustering.
[17] Internet Brain Segmentation Repository (IBSR). Anisotropic Diffusion Filter. Stationary Wavelet Transform (SWT). Spatial Filters. SelfOrganization Map (SOM). Learning Vector Quantization. [19] Principal Component Analysis (PCA). Artificial Neural Network (ANN). Gradient Descent with Momentum Weight and Bias Learning Function. Feed Forward ANN. Levenberg Marquardt
Copyright ⓒ 2016 SERSC
Focus Area/ Strengths Features Used Unified the The Physical Mid-sagittal implementatio plane extraction n of ANN is method and simple. segmentation The ANN can process for the map complex detection of class tumors and distributions asymmetry. easily. Generalization property of ANN produces accurate result. White Matter The Type-II (WM). fuzzy proved Gray Matter to be more (GM). robust than Cerebrospinal Type-I. Fluid (CSF). Abnormal Brain Tissue (Brain Tumor).
Multiresolution
The SWT is information for very effective distinguishing for splitting different texture tissues. information Multidimension into different al feature vector frequency is formed by channels. combining SOM is very SWT effective for coefficients and dividing M x their statistical N dimensional features. data into multiple segments. Linear
Limitations The
Experimenta l Results The system has shown 100% segmentation performance for 20 tumors and 50 normal brain images.
small asymmetric differences increases the value of ND2 and the algorithm take wrong decisions. Calculation of Zernike moments is complex. The model has The total of shown less 95 images accuracy. were The Type-II considered. fuzzy expert The system system for pre- identified 79 processing images needs further correctly and perfection. 16 incorrectly with accuracy of 78.94%. The division of Highly robust image into than manual channel segmentation increases but the execution accuracy rate time. has is not The accuracy properly rate of the mentioned. technique is not mentioned in the paper.
ANN is very The trainlm Regression. easy and used as Linear simple for training Correlation classification. function for Coefficient. The technique ANN, is very Four Classes of is fast in fast, but it images i.e. execution, requires a lot normal class, efficient in of memory to Edema class, classification run. cancer class, and is easy to and implement. not classified class.
First
Training (time consuming = 43.3839 sec). Third training (time consuming = 40.5603 sec). The average time consumed is 0.2434 sec. The technique has accuracy
271
International Journal of Bio-Science and Bio-Technology Vol.8, No.2 (2016)
Algorithm. [20] Thresholding. K-Means Clustering Algorithm. Colour Converted Segmentation.
[21] Short Time Fourier Transform. Principal Component Analysis (PCA). Back Propagation Neural Network (BPNN). Scaled Conjugate Gradient (SCG). Wavelet Transform.
[23] Simple Filtering. Gaussian Mixture Model (GMM). Low Pass and High Pass Filters. Three Dimensional Fluid Attenuation Inversion Recovery (FLAIR) Images. WMH Segmentation Method. Probability Density Function.
272
of 96.33%. and fast Not effective For MRI T2converted for small data. for large data. weighted images. The method K-means 100% Distinguish has higher clustering is accuracy and exact lesion size accuracy with sensitive to the 30s. and region. reasonable initial cluster For MRI T1computation assignment weighted 8% time. and the choice accuracy and of distance 30s. measure. For Spin density 75% accuracy and 30s computation time. Level-3 Neural Training time Total of 66 decomposition Network (NN) of the Neural images were via Haar is simple Network is considered. Wavelet. approach. very high with The time Time analysis. The Scaled large amount consumption Minimum Conjugate of data. for feature possible Gradient The Fourier extraction is features (SCG) is Transform 0.023s, for utilization for powerful and (FT) has feature the designed to drawback of reduction classification. avoid line losing the time 0.0187s and search. information of classification The features the signal. by NN is were reduced The 0.0035s. by PCA and computation 100% only 19 time can be accuracy with principle accelerated by the execution components, using lift-up time for each i.e. 1.86% of wavelet. image original processing features were 0.0451s is used. satisfactory. Cerebrospinal The other Two steps for 30% training Fluid (CSF) methods uses pre-processing and 70% White matter two MR used i.e. skull testing criteria (WM) modalities but skipping from is used. Gray matter the proposed the brain MRI Total 40 (GM) method uses and the bias images were Intensities only FLAIR field used. 12 for information. images. correction that training and The method takes extra 28 for testing. has general time. The method applicability The bias field has attained because it just correction an overall uses intensities need to be score of information. incorporated 82.0055. Better into the processing segmentation than manual process. segmentation. Performs closer to the Colour
Easy
Copyright ⓒ 2016 SERSC
International Journal of Bio-Science and Bio-Technology Vol.8, No.2 (2016)
[26] Binary Masking. Fast Volume Image Segmentation (HFS). Entropy Gradient Segmentation (EGS). Self Organization Map (SOM). K-Means Clustering Algorithm.
[27] Anisotropic Diffusion Filter. Improved Fuzzy Connectedness Algorithm. Similarity Index (SI). Extra Fraction (EF). Overlap Fraction (OF). Gaussian Variable Coefficient. Canny Algorithm.
[29] Artificial Neural Network. Fuzzy C-Means Algorithm. Low Pass and High Pass Filters. Mean and Standard Deviation.
[30] Fractal Dimension,
Copyright ⓒ 2016 SERSC
Segmentation
of MRI images. Voxel
intensities. Statistical
Features. First
human observer. Fully Computational Two methods unsupervised ly complex. have been method is used Computation compared. for the MRI cost and EGS has image precision better segmentation. trade-off. sensitivity Selfand Organization specificity map (SOM) is than the HFS. fast and efficient approach. Resolution/noi se immunity.
order features from gray level of a specific voxel and its neighbourhood. Second order features derived from the spatial relationship among different voxels. Seed points. The algorithm The tumors in The data of Calculating is independent the sequence 10 patients Scale as a of the tumor of slices and has been homogeneity type in terms surrounded by used. region radius. of pixels tissues reduces The result is To improve the intensity. the accuracy of 17.8% better general fuzzy The direct the algorithm. than the algorithm for relation Tumors with general fuzzy proper between fuzzy vague borders using segmentation of connectedness and low similarity images. and affinity. contrast cannot index (SI), The be segmented 21.1% better algorithm’s well. than the sensitivity to The false- general fuzzy noise negative using overlap decreased. results lead to fraction (OF) The boundary the lower SI 6.8% better information of and OF. than the the tumor general fuzzy tissue reduced using the the error. extra fraction (EF). Detection of Minimizes the The training of The volume changes number of Neural computation in the brain iterations and Network time for the tissues. predictably requires a huge method is classifies a amount of data between 177 pixel into one and time. and 259 group. Accuracy of seconds. fuzzy classification depends upon fuzzy rule base. Computation is complex Fractal Can be applied The time for Total of 249 Dimension to different normalization, real MRI
273
International Journal of Bio-Science and Bio-Technology Vol.8, No.2 (2016)
Level Set Based Method. KLD Method. Graph Cut Procedure. Expectation Maximization Algorithm. Laplacian Matrix. [31] Median Filter. Arithmetic Mean. Standard Deviation. Region Growing Algorithm.
(FD).
modalities. texture The technique features. perform better Probability for Distribution. segmentation of tumor. mBm
Seed point. The intensity
The results are of satisfactory different pixels. due to the Standard simplicity and Deviation. easiness of the Arithmetic method. Mean of The median Neighbouring filter retains pixels. and preserves the edges of the images that enhance the accuracy. Wavelet ANN simple The features 90% with Coefficients. and KNN good reduced from Artificial Eigen Vector. for smaller 1024 to 7 only Neural Asymmetry in data. which are not Network an axial MR The proposed enough and the (ANN). brain images. method has increase in 99% with Kshown better features may Nearest accuracy than reduce the Neighbour the other performance (KNN). methods. of the system. The PCA has removed the complexity.
[32] Discrete Wavelet Transform (DWT). Principal Component Analysis (PCA). K-Nearest Neighbour (KNN). Artificial Neural Network (ANN). LevenbergMarquardt Learning Rule. [33] Bhattacharya 2D MR slices. The FBB does Coefficient. Region based not need image Fast Bounding global change. registration. Box (FBB). The tumor The Score Function. region unsupervised Ellipse Fitting considered as a technique does Technique. change in the not require any Mean Shift original image. prior Clustering parameter (MSC). distribution. A training set of labelled images is not required. Intensity standardization in MR slices is not required. [34] K-Mean Detection of The Fuzzy CClustering. range and shape Mean Fuzzy C-Mean of tumor in algorithm is
274
feature images were extraction, considered. feature The mBm selection and feature in segmentation multimodaliti are very high. es T1, T2, and Not providing FLAIR MRI accuracy for offered 100% different tumor modalities. segmentation. The pre- Total processing and execution posttime is less processing than the 20s. techniques The execution increase time of execution segmentation time. stage is only The method is 2.9s. prone to leakage into skin area.
The
noise The method reduces the has shown the performance accuracy of of FBB. 92% for Performance Tumor of FBB detection and depends upon 89% for the asymmetry Edema. among the two halves of the MRI images. The method generates box on an MR slice even in the absence of tumor or Edema. The addition The results of noise and are not then removing properly
Copyright ⓒ 2016 SERSC
International Journal of Bio-Science and Bio-Technology Vol.8, No.2 (2016)
Algorithm. Median Filter. Euclidean
Brain. Mass
tumor
detection.
Distance.
more powerful and accurate than K-Means Clustering.
by applying median filter is not properly explained. The accuracy of the system is not provided.
mentioned.
4. Conclusion and Future Work The different types of images are used for the detection of diseases in the human body, may it be brain, lungs, heart or anything else. MRI and CT scanned images are types of images used for brain tumor detections [35]. The process of tumor detection in MRI images is possible with the support of digital image processing techniques. To do so, MRI images pass through four stages. In the first stage, pre-processing of image is done and the quality of MRI image is improved for easier processing. After pre-processing stage, the features’ extraction is carried out to identify cation of important features of MRI image that are suitable for brain tumor detection. In the third stage, the segmentation is done which divides the whole MRI of the brain into different regions for identification of abnormalities. The final stage in MRI processing is the post processing, which enhances the image of affected cells of the brain for easier and accurate analysis [36]. The techniques proposed so far in the literature encompass shortcomings that affect the execution time and accuracy of abnormality detection [37]. Our analysis in this paper found that there is severe need for more improvements in segmentation, performance, and accuracy for MRI images processing techniques. One of the ways improvements in the performance may be achieved is by using Principle Component analysis (PCA), a very commonly known statistical technique used in data analysis.
References [1]
[2]
W. Yu, X. Chen and L.Wu, “Segmentation of Concealed Objects in Passive Millimeter-Wave Images Based on the Gaussian Mixture Model”, Journal of Infrared, Millimeter, and Terahertz Waves., vol. 36, no. 4, (2015), pp 400-421. A. Kharrat, N. Benamrane, M. B. Messaoud and M. Abid, “Detection of Brain Tumor in Medical Images”, In proc. of 2009 3rd International Conference on Signals, Circuits and Systems (SCS), (2009), pp.1-6, November 6-8.
D. Bhattacharyya and T. Kim, “Brain Tumor Detection Using MRI Image Analysis”, In proc. of Second International Conference, UCMA 2011, Daejeon, Korea, (2011), pp. 307-314, April 13-15. [4] Difference Between Gray and White Matter, (2015, December 28), bibme.org, Retrieved December, 28, 2015, from http://www.differencebetween.net/science/health/difference-between-grey-and-white-matter, (2015). [5] M.P. Arakeri and G.R.M. Reddy, “Computer-Aided Diagnosis System for Tissue Characterization of Brain Tumor on Magnetic Resonance Images”, Signal Image and Video Processing., vol. 9, no. 2, (2015), pp.409-425. [6] G.N. Hounsfield, “Computerized Transverse Axial Scanning Tomography: Part 1, Description of The System”, British Journal of Radiology., vol. 46, no. 522, (1973), pp. 1016–1022. [7] B. Lipinski, H. Herzog, E.R. Kops, W. Oberschelp and H.W. Muller-Gartner, “Expectation Maximization Reconstruction of Positron Emission Tomography Images Using Anatomical Magnetic Resonance Information”, IEEE Transactions Medical Imaging., vol.16, no. 2, (1997), pp. 129–136. [8] A. Bazille, M.A. Guttman, E.R. Mcveigh and E.A. Zerhouni, “Impact of Semiautomated Versus Manual Image Segmentation Errors on Myocardial Strain Calculation by Magnetic Resonance Tagging”, Invest Radiol, vol. 29, no.4, (1994), pp.427–433. [9] Difference between MRI and CT, (2015, December 28), diffen.com, Retrieved December, 28, 2015, from http://www.diffen.com/difference/CT_Scan_vs_MRI, (2015). [10] N. Mahmood, A. Shah, A. Waqas, A. Abubakar, S. Kamran and S.B. Zaidi, “Image Segmentation Methods and Edge Detection: An Application To Knee Joint Articular Cartilage Edge [3]
Copyright ⓒ 2016 SERSC
275
International Journal of Bio-Science and Bio-Technology Vol.8, No.2 (2016)
[11]
[12] [13]
[14]
[15] [16] [17]
[18] [19]
[20] [21] [22] [23]
[24] [25] [26]
[27]
[28]
[29]
[30]
[31]
[32]
[33]
[34]
276
Detection”, Journal of Theoretical and Applied Information Technology., vol. 71, no.1, (2015), pp.8796. Z. Iscan, Z. Dokur and T. Ölmez, “Tumor Detection by Using Zernike Moments on Segmented Magnetic Resonance Brain Images”, Expert System with Applications., vol. 37, no. 3, (2010), pp. 25402549. A. Khotanzad and Y.H. Hong, “Invariant Image Recognition by Zernike Moments”, IEEE Transactions on Pattern Analysis and Machine Intelligence., vol. 12, no. 5, (1990), pp.489-497. M. H. Zarandi Fazel, M. Zarinbal and M. Izadi, “Systematic Image Processing for Diagnosing Brain Tumors: A Type-II Fuzzy Expert System Approach”, Applied Soft Computing., vol. 11, no.1, (2011), pp. 285-294. J. Chanussot, G. Mauris and P. Lambert, “Fuzzy Fusion Techniques for Linear Features Detection in Multitemporal SAR Images”, IEEE Transactions on Geoscience and Remote Sensing., vol. 37, no. 3, (1999), pp. 1292- 1305. M. Zarinbal, M.H. Fazel Zarandi and I.B. Turksen, “Interval Type-2 Relative Entropy Fuzzy C-Means Clustering”, Information Sciences., vol. 272, (2014), pp.49-72. M.H. Fazel Zarandi, M. Zarinbal and I.B. Turksen, “Type–II Fuzzy Possibilistic C-Mean Clustering”, IFSA-EUSFLAT 2009, (2009), pp.30-35. A. Demirhan and I. Guler, “Combining Stationary Wavelet Transform and Self-Organizing Maps for Brain MR Image Segmentation”, Engineering Applications of Artificial Intelligence., vol. 24, no.2, (2011), pp. 358-367. J. Weickert, “Anisotropic Diffusion in Image Processing”, Stuttgart: Teubner., vol. 1, (1998), pp. 59-60. W.H. Ibrahim, A.A.A. Osman and Y.I. Mohamed, “MRI Brain Image Classification Using Neural Network”, In. proc. of 2013 International Conference on Computing, Electrical and Electronic Engineering (ICCEEE), (2013), pp. 253-258, Khartoum, August 26-28. L-H. Juang and M-N. Wu, “MRI Brain Lesion Image Detection Based on Colour-Converted K-Means Clustering Segmentation”, Measurement., vol. 43, no. 7, (2010), pp. 941-949. Y. Zhang, Z. Dong, L. Wu and S. Wang, “A Hybrid Method for MRI Brain Image Classification”, Expert System with Applications., vol. 38, no. 8, (2011), pp.10049-10053. A. Messina, “Refinements of Damage Detection Methods Based on Wavelet Analysis of Dynamical Shapes”, International Journal of Solids and Structures., vol. 45, no. 14-15, (2008), pp. 4068–4097. R. Simões, C. Mönninghoff, M. Dlugaj, C. Weimar, I, Wanke, V.C Van Walsum AM and C. Slump, “Automatic Segmentation of Cerebral White Matter Hyper Intensities Using Only 3D FLAIR Images”, Magnetic Resonance Imaging., vol. 31, no. 7, (2013), pp. 1182-1189. D. Reynolds, “Gaussian Mixture Models”, Encyclopedia of Biometric Recognition., vol. 31, no.2, (2008), pp.1047-1064. F. Segawa, J. Kishibayashi, K. Kamada, N. Sunohara and M. Kinoshita, “FLAIR Images of Brain Diseases”, No To Shinkei., vol. 46, no.6, (1994), pp. 531-538. A. Ortiz, J.M. Górriz, J. Ramírez, D. Salas-González and J.M. Llamas-Elvira, “Two Fully Unsupervised Methods for MRI Brain Image Segmentation Using SOM Based Strategies”, Applied Soft Computing., vol. 13, no. 5, (2013), pp. 2668-2683. V. Harati, R. Khayati and A. Farzan, “Fully Automated Tumor Segmentation Based on Improved Fuzzy Connectedness Algorithm in Brain MR Images”, Computers in Biology and Medicine., vol. 41, no.7, (2011), pp. 483-492. J. K. Udupa and S. Samarasekera, “Fuzzy Connectedness and Object Definition: Theory, Algorithms, and Applications in Image Segmentation”, Graphical Models and Image Processing., vol. 58, no. 2, (1996), pp.246-261. K.J. Shanthi, M.N. Sasikumar and C. Kesavadas, “Neuro-Fuzzy Approach Toward Segmentation of Brain MRI Based on Intensity and Spatial Distribution”, Journal of Medical Imaging and Radiation Sciences., vol. 41, no.2, (2010), pp. 66-71. S. Ahmed, K.M. Iftekharuddin and A. Vossough, “Efficacy of Texture, Shape, and Intensity Feature Fusion for Posterior-Fossa Tumor Segmentation in MRI”, IEEE Transactions on Information Technology in Biomedicine., vol. 15, no. 2, (2011), pp. 206-213. T. Węgliński and A. Fabijańska, “Brain Tumor Segmentation from MRI Data Sets Using Region Growing Approach”, In proc. of 2011 VIIth International Conference on Perspective Technologies and Methods in MEMS Design (MEMSTECH), (2011), pp. 185-188, May 11-14. N.H. Rajini and R. Bhavani, “Classification of MRI Brain Images using k- Nearest Neighbor and Artificial Neural Network”, 2011 International Conference on Recent Trends in Information Technology, (2011), pp. 563-568, June 3-5. B. N. Saha, N. Ray, R. Greiner, A. Murtha and H. Zhang, “Quick Detection of Brain Tumors and Edemas: A Bounding Box Method Using Symmetry”, Computerized Medical Imaging and Graphics., vol. 36, no. 2, (2012), pp. 95-107. J. Selvakumar, A. Lakshmi and T.Arivoli, “Brain Tumor Segmentation and Its Area Calculation In Brain MR Images Using K-Means Clustering and Fuzzy C-Mean Algorithm”, IEEE-International Conference on Advances In Engineering, Science and Management (ICAESM-2012), pp.186-190, (2012), March 30-31.
Copyright ⓒ 2016 SERSC
International Journal of Bio-Science and Bio-Technology Vol.8, No.2 (2016)
[35] A. A. Khan, A. Shah and S. Muhammad, “Differential
Image Compression for Telemedicine : A Novel Approach”, Pakistan Journal of Engineering, Technology & Science., vol. 1, no. 1, (2011), pp. 14-20.
[36] M. Nazir, F. Wahid and S. A. Khan, “A Simple and Intelligent Approach for Brain MRI Classification”,
Journal of Intelligent & Fuzzy Systems: Applications in Engineering and Technology., vol. 28, no. 3, (2015), pp. 1127-1135. [37] A. H. Gondal and M. N. A. Khan, “A Review of Fully Automated Techniques for Brain Tumor Detection from MR Images”, International Journal of Modern Education and Computer Science (IJMECS)., vol. 5, no. 2, (2013), pp. 55-61.
Authors Fazli Wahid, He received BS in Computer Science from University of Malakand, Pakistan in 2006, and MS in Computer Science from SZABIST, Islamabad, Pakistan in 2015. He is currently perusing PhD. from JEJU National University, South Korea. His area of interest are energy consumption prediction, optimization, and management using multilayer perceptron, Artificial Bee Colony, Ant Colony and other Machine Learning Techniques.
Muhammad Fayaz, He is currently perusing Ph.D. in Computer Science from, University of Malakand, Chakdara, KPK, Pakistan. He received MS in Computer Science degree from SZABIST, Islamabad, Pakistan in 2014. He did MSC from the University of Malakand, KPK, Pakistan in 2011.
Abdul Salam Shah, He has completed MS degree in Computer Science from SZABIST, Islamabad, Pakistan in 2016. He did his BS degree in Computer Science from Isra University Hyderabad, Sindh Pakistan in 2012. In addition to his degree, he has completed short courses and diploma certificates in Databases, Machine Learning, Artificial Intelligence, Cybercrime, Cybersecurity, Networking, and Software Engineering. He has published articles in various journals of high repute. He is a young professional and he started his career in the Ministry of Planning, Development and Reforms, Islamabad Pakistan. His research area includes Machine Learning, Artificial Intelligence, Digital Image Processing and Data Mining. Mr. Shah has contributed in a book titled "Research Methodologies; an Islamic perspectives," International Islamic University Malaysia, November, 2015.
Copyright ⓒ 2016 SERSC
277
International Journal of Bio-Science and Bio-Technology Vol.8, No.2 (2016)
278
Copyright ⓒ 2016 SERSC