An Exploratory Study of Developers' Toolbox in an. Agile Team. Irina Diana Coman, Giancarlo Succi. Free University of Bozen-Bolzano, Center for Applied ...
An Exploratory Study of Developers’ Toolbox in an Agile Team Irina Diana Coman, Giancarlo Succi Free University of Bozen-Bolzano, Center for Applied Software Engineering Via della Mostra 4, 39100 Bolzano, Italy {IrinaDiana.Coman, Giancarlo.Succi}@unibz.it
Abstract. Although Agile teams supposedly value individuals and interactions over processes and tools, tools still represent an important support for developers’ work. Existing studies investigate only partially tool usage in nonAgile teams. Moreover, it is not clear to which extent their findings are valid also for Agile teams. This study takes the first steps towards understanding tool usage in Agile teams by investigating the types and variety of tools used and the actual purpose for which they are employed. As expected, we found that communication accounts for an increased amount of time, but, surprisingly, a large share of it is represented by instant messaging or email rather than face-toface communication. Other findings show that developers’ toolbox contains only a very small number of tools and a relevant amount of time is spent on browsing the Internet and navigating through the file system. Key words: Agile Methods, work practices, tool usage
1 Introduction Agile teams value individuals and interactions over processes and tools1. However, Agile teams still recognize the need for good tools to support developers in their tasks. Examples of tools that are directly supporting Agile practices are the automated testing frameworks such as JUnit2 or test coverage tools such as NCover3. Many tools are currently available to assist developers with their daily tasks. Many more tools appear constantly, claiming to better address developers’ needs or to improve their effectiveness by integrating multiple functionalities. Still, it is not clear to which extent this multitude of tools is actually used and to which extent it improves developers’ effectiveness. Existing studies offer strategies to assess and select a tool based on a combination of criteria such as tool usability, impact on developers’ work or fitness for specific types of projects and development processes [1], [2], [3]. Such studies offer a way for selecting a new tool, but cannot guarantee its actual adoption and effectiveness. Thus, 1
Agile Manifesto http://agilemanifesto.org JUnit http://www.junit.org 3 NCover http://www.ncover.com 2
it is not clear whether developers would actually use the tool if they are given the choice and, if they do, whether they would actually use it exactly in the intended way, for the intended purpose and thus with the estimated impact on effectiveness. Additional studies investigate developers’ cognitive processes [4], [5], work practices, and tool usage [6], [7], [8] with the main goal of proposing new tools that better support the observed activities. However, all these studies are run in non-Agile teams. Thus, it is not clear to which extent their findings apply also to Agile developers that supposedly value people and interaction over processes and tools. Moreover, such studies do not directly evaluate the impact of existing tools and the way in which developers cope with the multitude of available tools. To evaluate the real impact of tools on developers’ effectiveness, we need first to understand what tools developers actually use, to which extent and for which purpose. Existing studies do not directly address all these issues. This paper reports on the first steps towards addressing these issues by answering three main questions: Q1. How many tools do developers actually use? Q2. Which tools do developers use frequently? Q3. Which main purposes serve the frequently used tools? To answer the above questions, we perform a 53 days exploratory study in a small software company. As it is the first such study in an Agile team, the main goal is to shape some initial hypotheses regarding the toolbox of developers. This study complements existing works in this field by investigating tool usage in the different context of Agile development. This study brings also a more detailed investigation of the toolbox of developers based on extensive, fine-grained data. The main findings (to be tested also in other Agile teams) can be summarized as follows: Agile developers constantly try out new tools, but adopt only few of them; the toolbox of Agile developers contains very few tools (4) that are frequently used and a few more (7) for occasional use; Agile developers spend about 1/3 of their time on coding related activities, 1/3 on browsing the Internet, and 1/4 on communication. This paper is structured as follows. Section 2 presents related work. Section 3 presents the research settings and section 4 presents the raw results. Section 5 discusses the results and section 6 identifies the limitations of this study. Finally, section 7 draws the conclusions and identifies the directions for future work.
2 Related Work Singer et al. [6] examine the work practices of software developers with the goal of designing better tools. The authors observed and interviewed developers to obtain a list of 14 activities and to count the number of times they switch activity. Fourteen 30 minutes sessions of observation of a single developer together with additional 8 sessions of 60 minutes each of observation of other 8 developers show that developers are frequently reading source code, searching, editing, followed by executing UNIX commands and compiling. A set of 14 predefined categories of tools is used to group the tools, without differentiating automated and user-made invocations. Data show that the most used tools are in the compilers category, followed by search tools.
LaToza et al. [7] interview developers and identify a set of common activities. The results show that developers spend most of their effort in communication, understanding, and non-code activities, followed by writing, editing, and designing. Moreover, the study shows that 49% of the developers use two or more tools to code and they are constantly testing new tools and work practices. Czerwinski et al. [8] use data from time-diaries of knowledge workers (including developers) to investigate how people interleave multiple activities such as email, meetings, project work, routine tasks, personal, phone calls, and task tracking. The results show that people spend most of their effort in routine tasks, followed by email, project activity, and task tracking. In the study of Perry et al. [9], thirteen developers filled in a time-diary for a year, reporting hourly their activity. The activities are grouped into categories related to different stages of the development cycle, such as estimation, requirements, design, testing, or coding. The results show that developers spend roughly half of their effort in non-coding activities. Lethbridge and Singer [10] investigate software maintenance tools with the purpose of understanding what tools and features would improve productivity. The authors use a variety of techniques (questionnaires, interviews, direct observation, and automated logging of tool usage) to observe a small group of software engineers. They report that the most used tools are editors followed by searching tools and that developers explore code as much as edit it. Asking for developers’ opinion, the authors report the most important positive aspects of tools (ease of use, rapid response time, and useful features) and negative aspects of tools (lack of integration with other tools, wrong mix of features). In addition, the study discusses the difficulties encountered introducing new tools and finds that a tool is adopted only when several members of the team find it useful and spread positive word about it. Table 1 summarizes the findings of the existing studies on tool usage and work practices of developers. Although existing findings offer useful insights on the tool usage and work practices of non-Agile developers, it is not clear to which extent these findings apply also to Agile developers. While developers are reported to constantly try out new tools [7], it is not clear how many tools are actually adopted in the end. A consistent finding over all the studies that investigated developers’ activities seems to be that developers spend large shares (up to 50%) of their time on noncoding related activities [9], [7], [8]. However, there is not a clear consensus over the shares of various non-coding activities. All of the existing studies (with one exception, [10]) use various forms of manual data collection. However, manual data collection itself affects the work of developers, is error prone and does not allow for very fine grained analyses, at the level of short events (seconds) that might however add up to important amounts. By contrast to the existing studies, we investigate the tool usage in a new context, namely Agile teams. We focus on the actual tools that developers use on a daily basis and we try to understand which activities take large shares of developers’ time. Moreover, unlike most of the existing studies, we use mainly automated data collection techniques that do not intrude upon the work of developers, are not biased, and offer very fine grained data accounting for each second of the time that developers spend interacting with their computers.
Table 1. An overview of empirical studies on developer activities and tools. Topic
Purpose
Data collection
Findings on activities
Findings on tools
Ref
Understanding activities of developers
Improve tools
Survey, observation, interview
Most frequent: reading code, searching, editing, UNIX commands, compiling
Most used: compilers, search tools
[6]
Understanding activities of developers and typical tools used
Improve tools
Surveys, interviews
Most frequent: communication, understanding and noncode, writing, editing
49% of developers use two or more tools when coding
[7]
Characterizing how people interleave multiple tasks
Improve tools
Diary study
Most effort on: routine tasks, email, project tasks, task tracking
Not investigated
[8]
How developers spend their time
Minimize time loss in software development
Time diary
50% of the effort is spent on non-coding activities
Not investigated
[9]
Understanding usage of software maintenance tools
Improve tools
Questionnaire, interview, direct observation, automated logging of tool usage
Developers explore software as much as edit it.
Most used: editors, search tools
[10]
Developers constantly test new work practices
Developers constantly test new tools
Main positive: ease of use, useful features, rapid response time. Main negative: lack of integration, wrong mix of features.
3 Research settings To answer our questions, we performed an exploratory study in a small software company. Due to the sensitive nature of the data presented here, the company will remain anonymous. In the rest of the paper it will be identified as Company Small. Company Small is a small Austrian company that develops and maintains Web applications. The team participating to our study consists in three regular developers. All three developers are Austrian, males, between 28 and 35 years old, with 5-10 years of programming experience. They all hold university degrees in computer related fields. During our study, the developers performed maintenance tasks on three existing projects of the company. They use Java, HTML, and Javascript as main programming languages and work with the Eclipse and Homesite5 IDEs. The team is an Agile team using a customized version of Extreme Programming [12], [13]. In particular, they use weekly iterations [13], [14] and user stories [14]. Moreover, they
are strongly encouraged to work not more than 8 hours per day. The characteristics of the development team involved in this study are summarized in Table 2. Table 2. Main characteristics of the development team under study. Team size Team type Nationality (of company and of developers) Background Programming experience Programming languages Programming environments Programming paradigm
Company Small 3 developers Works on Web applications that are the main product of the company Austrian University degree in computer related fields 5-10 years Java, HTML, Javascript Eclipse, Homesite5 Customized XP (weekly iterations, user stories)
During all the duration of our study (53 working days), we use the PROM tool [11] to collect data in a fully non-intrusive and automated way. The data consist in a stream of events that reflect the developer-computer interaction. Each event consists in a timestamp, the name of the currently used software application, and the name of the currently focused window (for all software applications) or the name of the current method, class, and file (for code accessed in the usual IDE). The granularity of the data is of one second. Developers could also manually insert data regarding time spent in non-computer activities such as meetings or phone calls. The data collected from the three developers cover 52, 50, and 46 days respectively, as the developers were absent for various reasons during 1, 3, and 5 days respectively. On average, over all three developers and all days with data collected, there are approximately 6 daily hours of computer interaction (6.62 ± 1.88).
4 Results The goal of the study in company Small is to get an initial understanding of the toolbox of Agile developers, and to shape hypotheses regarding the potential answers to our initial three questions. Additionally, the study serves to identify other directions that were not obvious beforehand and that would benefit from deeper investigation. To answer question Q1, we consider each distinct software application as a tool. Examples of tools are Internet Explorer browser or Eclipse development environment. We discard the tools that were used for less than 10 minutes (over all days and developers) as we consider that such a short usage time does not indicate actual usage or even testing of a tool. According to our data, the three developers used 26, 27, and 31 distinct tools respectively, during the 53 working days of the study. However, these tools were not all the same for all three developers. Considering the three developers together, they used 41 distinct tools. As these numbers look rather big, we investigate more in detail how the total time recorded is divided among the usage of the various tools. There are only a few tools that have large shares of developer’s time, while many others account for very little amount of time. Thus, to answer question Q2, we consider as frequently used tools
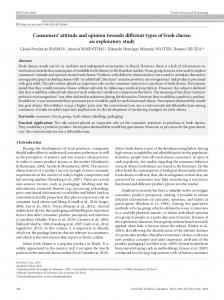
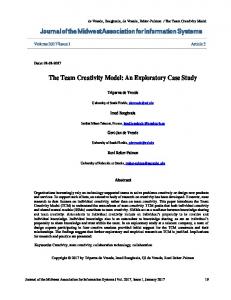
only those that were used by each developer for at least 1% of his total time. According to our data, the three developers use frequently 12, 11, and 13 tools respectively. These frequently used tools account for 93.63% of the total time recorded for all three developers in company Small (Figure 1).
Figure 1. Breakdown of computer interaction time on frequently used tools. As a first step towards answering question Q3, we group the tools into categories corresponding to higher level activities (Table 3). Thus, we obtain 5 main categories: Coding (includes IDEs and other software directly linked to programming activities, such as testing frameworks), Communication (email and IM clients as well as Microsoft Word as it was the default editor for email), Internet (Internet browsers and Wiki tools), Documents (Microsoft Office and Open Office), and Navigating (file system browsers and terminals). The tools that did not belong to any of these categories were all grouped under the name Other. Table 3. Categories and tools. Category Coding Communication Internet Documents Navigating
Software tools IDEs; CVS/SVN clients; test frameworks; Internal software. Email clients; Instant Messaging clients; Word (as default editor for emails). Internet browsers; Wiki tools. All Microsoft Office except Word; all Open Office; text editors; Acrobat Reader; timesheet software. Windows Explorer; desktop search clients; Task Manager; Microsoft Management Console; console; archivers; file utilities.
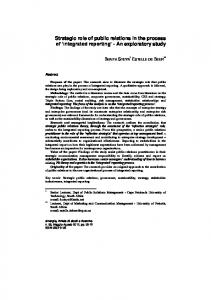
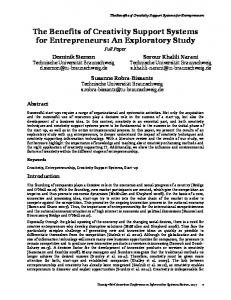
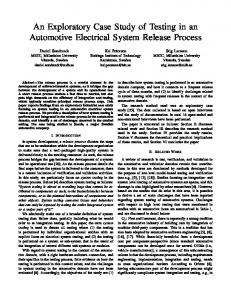
Computing the breakdown of developers’ computer time among the 5 activities, reveals that Coding takes only 33%, followed closely by Internet (29%), Communication (19%), Navigating (4%), and Documents (2%) (Figure 2). However, these are percentages of the time the developer spends in interaction with the computer. Considering all the 8 hours that make a developer’s working day would decrease the percentage of time spent on Coding and would increase the percentage of time spent on Communication (as most of the activities outside the computer are planned or unplanned meetings and phone calls). A typical developer’s day in company Small consists in 8 working hours out of which, on average, the developer spends 6.62 hours interacting with his computer. Adding thus the remaining time (on average 1.38 hours) as Communication and computing again the percentages considering 8 daily hours, yields that Coding accounts for only 31% of developers’ time, followed by Internet (28%), Communication (24%), Navigating (3%), and Documents (2%) (Figure 3).
Figure 2. Breakdown of computer interaction time on activities.
Figure 3. Breakdown of 8 hours day on activities.
5 Discussion Developers use a large number of tools overall (41), but less than a quarter of them on a regular basis (11). Most of the tools (30) are used only for very little time, accounting for less than 1% of the total time recorded. This would correspond more to developers exploring a tool rather than actually using it as part of their regular toolbox. However, in total, these tools account for 6% of developers’ computer time which suggests that developers use about 1/2 hour daily to explore various tools. This would also be consistent with other existing studies that found that non-Agile developers are constantly testing new tools [7]. Considering also the small number of tools in the regular toolbox of developers (Figure 1), the conclusion is: H1. Developers constantly try out new tools, but adopt only few of them. Out of the 11 tools in the developers’ regular toolbox (accounting each of them for at least 1% of developers’ time), there are 7 tools that are intensively used (each accounts for at least 5%), while the other 4 tools seem to be used only occasionally, accounting each of them for less than 5% (Figure 1). Thus, the second conclusion is the following: H2. The regular toolbox of developers contains very few tools that are intensively used and a few more tools for occasional use. The breakdown of developers’ time on activities (Figure 2 and Figure 3) shows that developers spend only about 1/3 of their time on coding related activities, while another 1/3 of their time they navigate on the Internet and about 1/4 of their time they use communication tools. Additionally, only navigating through the file system or searching for a file takes about 4% of the time developers interact with their computer. Consequently, conclusions H3 and H4 are the following: H3. Developers spend about 1/3 of their time on coding related activities, 1/3 on browsing the Internet and 1/4 on communication. H4. Developers spend a relevant amount of their time (~5%) on navigating the file system or searching for a file.
The large share of Internet might be caused in this case by the fact that the team developed and maintained Web applications. Thus, part of the time spent on Internet might be due to testing the developed application and would rather belong to the Coding activity. This raises the need for deeper investigation of the Internet activity for identifying the different purposes of Internet usage. Thus, question Q3 would benefit from refinement with the following question: Q3.1. For which main purposes do developers use Internet? Although other studies already noticed that developers spend about half of their time in non-coding activities [9], and in particular in communication [7], these studies considered all the daily activity of developers rather than just their computer interaction. However, the study in company Small shows that communication maintains a large share of developers’ time also when considering only the time spent in computer interaction. On one hand, this makes perhaps less surprising the large share of computer time (on average 6.62 daily hours out of 8) given that part of the communication seems to have migrated from other medias to the computer. However, the large share that communication has in computer interaction time is quite surprising considering also that the team was small and had the possibility of easy communication among the members given that they all worked in the same room. Moreover, as the team is an Agile team, the members supposedly valued, in all their interactions, face-to-face communication over other means. These observations lead to another question that details the main scope of question Q3: Q3.2. For which main purposes do developers use communication tools? To answer the additional questions Q3.1 and Q3.2, we have to distinguish between the various purposes for which the same application might be used. More precisely, the Internet usage could be further refined into searching for code examples or documentation, testing Web applications or editing the Wiki of the team. The communication tools could be used, for instance, for asking colleagues for information when getting stuck with some code (IM), for receiving company communications (email) or simply for taking a break. As these questions revealed themselves only at the end of this study, we do not have enough information to attempt to answer them for company Small. Instead, we consider that another study should be designed to collect all the data required to provide reliable answers to these questions and to test the conclusions of this study, H1, H2, H3 and H4. The implications of H1 and H2 would be that despite their big numbers and variety, most of the existing tools fail to convince the developers of their promised benefits. Developers seem instead to stick with the already established tools (Figure 1) and to prefer perhaps integrated functionality (such as plug-ins for the IDE) to new, stand-alone tools. Still, developers are in constant search of improved tools, as they diligently test many new tools (H1). As developers spend large amounts of time simply to find the files they need, there seems to be a dire need of improvement in the way in which files are organized on developers’ computers. Current file systems seem to be inadequate for developers’ needs and cost them precious time (H4). The tools generally support developers in their activities, but it seems that some of them, such as Communication and Internet tools, might actually decrease developers’ productivity. This is suggested by our findings that developers spend only 31% of their time coding (H3), while older studies reported 50% [9]. However, these implications need to be further tested in future studies in other development teams.
6 Limitations The study has several limitations. The most important ones are listed below. To ensure the privacy rights of the participants, they had the possibility of stopping the data collection tool at any time, partially or completely, temporarily or definitively, without giving any explanation. These options are available to each of the participants on their own machine and are transparent to us. However, the data cover on average 6 hours of daily interaction with the computer. As developers were rarely doing extra hours, we consider the 6 hours of daily computer interaction as an indicator that the developers made little use, if any, of the option of suspending data collection temporarily. There is also an internal limitation of the tool that collected data. While the tool is able to discern for long idle periods at the computer and eliminate them from the active effort (and from the data considered in the study), it is not able to discern for very short interruptions (seconds or a few minutes). This type of interactions can be easily generated since the developers work in a shared environment where informal communication is easily possible. The external limitations of this study are related to the limited size and to the specificities of the sample. The study investigates a customized XP team of three developers working in an Austrian company to develop and maintain Web applications. Due to the small size of the sample, it is hard to generalize the results to other companies and other developers working in different environments, with different programming languages, and different methodologies. We consider our findings as initial hypotheses to be validated in future studies in other Agile development teams.
7 Conclusions and future work This paper offers an initial understanding of the actual toolbox of Agile developers, based on an empirical study in a software company. The study uses extensive data collected automatically and non-intrusively from three developers over 53 days. The collected data offer evidence of the following: developers constantly test new tools but adopt only few of them (H1); the regular toolbox of developers contains very few tools that are intensively used and a few more that are only occasionally used (H2); developers spend about 1/3 of their time on coding activities, 1/3 on browsing Internet and 1/4 on communication (H3); developers spend a large amount of time on navigating the file system or searching for a file (H4). Additionally, the study reveals a need to investigate deeper the usage of Internet and Communication tools and proposes to distinguish in future studies on various purposes for which developers use such tools (e.g. usage of Communication tools to ask colleagues for help or to receive company communications). The main findings are summarized in Table 4. We consider as future work to perform other studies in Agile companies to further test H1 to H4 and to answer the additional questions Q3.1 and Q3.2.
Table 4. Main findings of this study. Literature Developers constantly test new tools 50% of developers’ time is spent for noncoding activities
This study Confirmed and added that few tools are adopted. 66% of developers’ time is spent for non-coding activities.
N/A
Few tools are actually used
N/A
≈5% of developers’ time spent navigating file systems or searching for files.
Empirical conclusion Most of the new stand-alone tools fail to convince developers. Part of the communication has moved to computer media; Internet and Communication might actually decrease productivity. Developers use established tools and prefer integrated tools. Current organization of file systems is inadequate for developers’ needs.
References [1] Bruckhaus, T., Madhavji, N. H., Janssen, I., and Henshaw, J., The Impact of Tools on Software Productivity, IEEE Software, pp. 29-38, September, 1996. [2] Poston, R. and Sexton, M., Evaluating and Selecting Testing Tools, IEEE Software, pp. 3342, May 1992. [3] Atkins, D. L., Ball, T., Graves, T. L., and Mockus, A., Using Version Control Data to Evaluate the Impact of Software Tools: A Case Study of the Version Editor, IEEE Transactions on Software Engineering, pp. 625-637, July 2002. [4] Von Mayrhauser, A., and Vans, A., From Program Comprehension to Tool Requirements for an Industrial Environment, Proc. Workshop on Program Comprehension, pp. 78-86, 1993. [5] Von Mayrhauser, A., and Vans, A., From Code Understanding Needs to Reverse Engineering Tool Capabilities, Proc. Workshop on Computer-Aided Software Engineering, pp. 230-239, 1993. [6] Singer, J., Lethbridge, T., Vinson, N., and Anquetil, N., An Examination of Software Engineering Work Practices, Proc. CASCON, pp. 209-223, 1997. [7] LaToza, T.D., Venolia, G., and DeLine, R., Maintaining Mental Models: A Study of Developer Work Habits, Proc. of ICSE, May 2006. [8] Czerwinski, M., Horvitz, E., and Wilhite, S., A Diary Study of Task Switching and Interruptions, Proc. ACM Conference on Human Factors in Computing Systems, 2004. [9] Perry, D.E., Staudenmayer, N. A., and Votta, L. G., People, Organizations and Process Improvement, IEEE Software, pp. 36-45, 1994. [10] Lethbridge, T. C., and Singer, J., Understanding Software Maintenance Tools: Some Empirical Research, Proc. Workshop on Empirical Studies in Software Maintenance, 1997. [11] Sillitti, A., Janes, A., Succi, G., and Vernazza, T., Collecting, Integrating and Analyzing Software Metrics and Personal Software Process Data, Proc. of EUROMICRO, pp. 336-342, 2003. [12] Beck, K., Extreme Programming Explained, Wesley-Addison, 1999. [13] Beck, K., and Andres, C., Extreme Programming Explained: Embrace Change, WesleyAddison, 2005. [14] Beck, K., and Fowler, M., Planning Extreme Programming, Addison-Wesley, 2001.