data mining method for knowledge discovery in spatial database. ... to those outside of it. DBSCAN [2] is a density based clustering algorithm ..... Threshold. CURE. No of clusters. No of representatives. Any shape large data. Arbitrary. No. No.
International Journal of Computer Applications (0975 – 8887) Volume 58– No.2, November 2012
An Extended Density based Clustering Algorithm for Large Spatial 3D Data using Polyhedron Approach Hrishav Bakul Barua
Sauravjyoti Sarmah
Research Scholar, Dept. of Computer Science and Engineering, Jorhat Engineering College, Jorhat-785007, Assam
Assistant Professor, Dept. of Computer Science and Engineering, Jorhat Engineering College, Jorhat-785007, Assam
ABSTRACT Discovering the meaningful patterns and trends out of large datasets needs a very special attention now a days, and one of the most prevalent and widely studied problems in this area is the detection and formation of clusters accurately and correctly. Previous works on this field does not meet the problem of 3D spatial datasets with minimization of Input Parameters. The objective of this paper is to present a Tetrahedron-density based clustering technique for large 3D datasets which we have named as 3D-CATD (Three DimensionalClustering Algorithm using Tetrahedron Density), for efficient clustering of 3D spatial data. This algorithm is capable of identifying embedded clusters of arbitrary shapes as well as multi-density clusters over large 3D spatial datasets. The polyhedron approach is being incorporated to perform the clustering where the number of points inside a tetrahedron (tetrahedron density) of a polyhedron is calculated using barycentric formulae for tetrahedron. This is because of the fact that partitioning of the data set can be performed more efficiently in tetrahedron shape than in any other 3D shape due to its smaller space dimension. The ratio of number of points between two tetrahedrons can be found out which forms the basis of nested clustering of 3D data. Experimental results establish the superiority of the technique in terms of cluster quality and complexity.
points (data objects); the data space is usually not uniformly occupied. Data Clustering identifies the sparse and the crowded places, and hence discovers the overall distribution patterns of the data set.Besides, the derived clusters can be visualized more efficiently and effectively than the original dataset. Mining knowledge from large amounts of spatial data is known as spatial data mining. It becomes a highly demandingfield because huge amounts of spatial data have been collected in various applications ranging from geospatial data to bio-medical knowledge. The amount of spatial data being collected is increasing exponentially and has far exceeded human’s ability to analyze them. Recently, clustering has been recognized as a primary data mining method for knowledge discovery in spatial database. The development of clustering algorithms has received a lot of attention in the last few years and new clustering algorithms are proposed.
General Terms Clustering Algorithms, Performance
Design,
Experimentation,
Keywords Clustering, Density- based, Density Confidence, Polyhedron approach, Tetrahedron-density
1. INTRODUCTION In this paper, the technique of data clustering has been examined, specially 3D extended data clustering, which is a particular kind of data mining problem in KDD (Knowledge Discovery from Data).The process of grouping a set of physical or abstract objects into classes of similar objects is called clustering. A cluster is a collection of data objects that are similar to one another within the same cluster and are dissimilar to the objects in other clusters [1]. Given a large set of data
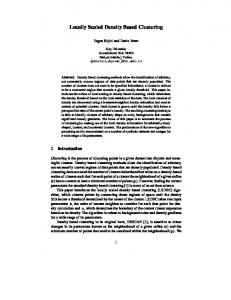
Figure 1- Formation of clusters in 3D spatial datasets-an overview
Major clustering techniques have been classified into partitional, hierarchical, density-based, grid based and model-based. Among these techniques,
4
International Journal of Computer Applications (0975 – 8887) Volume 58– No.2, November 2012
the density-based approach is famous for its capability of discovering arbitrary shaped clusters of good quality even in noisy datasets [2]. Density Based Spatial Clustering of Applications with Noise (DBSCAN) and Ordering Points to Identify the Clustering Structure (OPTICS) are two of the most popular density based clustering algorithms. In density-based clustering algorithms, a cluster is defined as a high-density region partitioned by low-density regions in data space. They can find out the clusters of different shapes and sizes from the large amount of data containing noise and outliers.Fig. 1 depicts the formation of clusters of similar data in 3D spatial dataset. This project, which is primarily motivated by Density Based Clustering, aims at proposing a new density based clustering technique for efficient clustering of spatial data.The rest of the paper is organized as follows. Section 2 provides a selected literary review on density based, grid based and other multi-density as well as variable density data clustering techniques. Section 3 illustrates the background of the proposed work and section 4 gives the final proposed algorithm. In section 5, we present the experimental results and the performance analysis of the work. Lastly, we conclude with a summary in section 6.
2. RELATED WORKS (Previous works in the field) This section portrays a selected literary review on some of the previous works in this field specially some relevant density based as well as grid based clustering techniques that works on 2D datasets but their principles can be used inextended 3D data sets. 2.1. Density Based Approach Most partitioning methods cluster objects based on the distance between the objects. Such methods can find only spherical-shaped clusters and encounter difficulty at discovering clusters of arbitrary shapes. Other clustering methods have been developed based on the notion of the density. Their general idea is to continue growing the given cluster as long as the density(number of objects or data points) in the neighborhood exceeds some threshold; that is for each data point within a given cluster, the neighborhood of a given radius has to contain at least a minimum number of points. Such a method can be used to filter out noise (outliers) and discover clusters of arbitrary shape.To discover clusters with arbitrary shape, density based clustering methods have been developed. These typically regard clusters as dense regions of objects in the data space that are separated by regions of low density. DBSCAN [2] grow
clusters according to a density-based connectivity analysis. OPTICS extends DBSCAN [2] to produce a cluster ordering obtained from a wide range of parameter settings.The idea behind density based clustering approach is that the density of points within a cluster is higher as compared to those outside of it. DBSCAN [2] is a density based clustering algorithm capable of discovering clusters of various shapes even in presence of noise. The key idea of DBSCAN is that for each point of a cluster, the neighborhood of a given radius (ε) has to contain at least a minimum number of points and the density in the neighborhood has to exceed some threshold. It is efficient for large spatial databases but, for massive datasets, it becomes very time consuming, even if the use of R* tree is made. Another drawback of DBSCAN is that due to the use of the global density parameters, it fails to detect embedded or nested clusters. 2.2. Grid Based Approach Grid-based methods quantize the object space into a finite number of cells that form a grid structure. All of the clustering operations are performed on the grid structure. The main advantage of this approach is its fast processing time, which is independent of the number of data objects and dependent only on the number of cells in each dimension in the quantized space. There is high probability that all data points that fall into the same grid cell belong to the same cluster. Therefore all data points belonging to the same cell can be aggregated and treated as one object [3]. It is due to this nature that grid-based clustering algorithms are computationally efficient which depends on the number of cells in each dimension in the quantized space. It has many advantages such as the total number of the grid cells is independent of the number of data points and is insensitive of the order of input data points. Some of the popular grid-based clustering techniques are STING [4], WaveCluster [5],CLIQUE[6], pMAFIA [7] etc. STING [4] uses a multiresolutionapproach to perform cluster analysis. Theadvantage of STING is that it is query-independent and easyto parallelize. However the shapes of clusters have horizontalor vertical boundaries but no diagonal boundary is detected.WaveCluster [5] also uses a multidimensional grid structure. Ithelps in detecting clusters of data at varying levels ofaccuracy. It automatically removes outliers and is very fast. However, it is not suitable for high dimensional data sets.CLIQUE [6] is a hybrid clustering method that combinesthe idea of both density-based and grid-based approaches. Itautomatically finds subspaces of the highest dimensionalityand is insensitive to the order of input. Moreover, it has good scalability as the number
5
International Journal of Computer Applications (0975 – 8887) Volume 58– No.2, November 2012
of dimensions in the data increases. However, the accuracy of the clustering result may bedegraded at the expense of simplicity of the method. pMAFIA [7] is an optimized and improved version of CLIQUE. It uses the concept of adaptive grids for detecting the clusters. It scales exponentially to the dimension of the cluster of thehighest dimension in the data set. 2.3. Clustering Over Multi Density Data Space: One of the main applications of clustering spatial databases is to find clusters of spatial objects which are close to each other. Most traditional clustering algorithms try to discover clusters of arbitrary densities, shapes and sizes. Very few clustering algorithms show preferable efficiency when clustering multi-density datasets. This is also because small clusters with small number of points in a local area are possible to be missed by a global density threshold. Some clustering algorithms that can cluster on multi-density datasets are Chameleon [8], SNN [9] (shared nearest neighbor), and the multi-stage density-isoline algorithm [10] and so on. Chameleon [8] can handle multi-density datasets, but for large datasets the time complexity is too high. SNN [9] algorithm can find clusters of varying shapes, sizes and densities and can also handle multi-density dataset. The disadvantage of SNN is that the degree of precision is low on the multi-density clustering and finding outliers. The multi-stage density-isoline algorithm [10] clusters datasets by the multi-stage way and the idea of density-isoline. The disadvantage of the algorithm is that each cluster cannot be separated efficiently. DGCL [11] is based on density-grid based clustering approach. But, since it uses a uniform density threshold it causes the low density clusters to be lost. 2.4. Clustering Over Variable Density Space: Most of the real life datasets have a skewed distribution and may also contain nested cluster structures the discovery of which is very difficult. Therefore, we discuss two density based approaches, OPTICS [12] and EnDBSCAN [13], which attempt to handle the datasets with variable density successfully. OPTICS can identify embedded clusters over varying density space. However, its execution time performance degrades in case of large datasets with variable density space and it cannot detect nested cluster structures successfully over massive datasets. In EnDBSCAN [13], an attempt is made to detect embedded or nested clusters using an integrated approach. Based on our experimental analysis in light of very large synthetic datasets, it has been observed that EnDBSCAN can detect embedded clusters; however, with the increase in the volume of data, the performance of it also degrades. EnDBSCAN is highly sensitive to the parameters MinPts and ε. In
addition to the above mentioned parameters, OPTICS requires an additional parameter i.e. ε'. 2.5. Clustering High- Dimensional Data: Most of the clustering methods stated above are implemented in 2D spatial datasets. The need for clustering in 3D spatial datasets is highly demanded. In case of space research and Geo-Spatial data or 3D object detection an efficient clustering algorithm is required. CLIQUE is a dimension-growth subspace clustering method [21]. Here, process starts at single dimensional subspace and extends to higher dimensional ones. CLIQUE is a combination of density and grid based clustering method. Here the data space is portioned into non overlapping rectangular units, identifying the dense units out of them. 2.6. Based on our selected literature survey and experimental analysis, it has been observed that: 1) Density based approach is most suitable for quality cluster detection over massive datasets as well as 3D datasets. 2) Grid based approach is suitable for fast processing of large datasets in 2D and 3D domain. 3) Almost all clustering algorithms require input parameters, accurate determination of which are very difficult, especially for real world data sets containing high dimensional objects. Moreover, the algorithms are highly sensitive to those parameters. 4) None of the techniques discussed above, is capable in handling multi-density datasets as well as multiple intrinsic or nested clusters over massive datasets qualitatively. 5) Only a few of the above techniques can handle higher dimensional datasets and mostly concentrated at 2D spatial datasets. 2.7. Motivation Most partitioning methods cluster objects based on the distance between them. Such methods can find only spherical-shaped clusters and encounter difficulty at discovering clusters of arbitrary shapes. So other clustering methods have been developed based on the notion of density. The general idea is to continue growing the given cluster as long as the density (number of objects or data points) in the “neighborhood” exceeds some threshold; this is, for each data point within a given cluster, the neighborhood of a given radius has to contain at least a minimum number of points. Such a method can be used to filter out noise (outliers) and discover cluster of arbitrary
6
International Journal of Computer Applications (0975 – 8887) Volume 58– No.2, November 2012
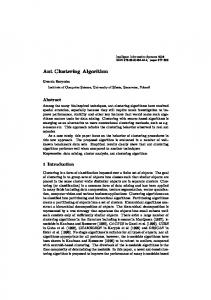
shapes. These typically regard clusters as dense regions of objects in the data space that are separated by regions of low density (representing noise). DBSCAN grow regions with sufficiently high density into clusters and discover clusters of arbitrary shape in spatial database with noise according to a density-based connectivity analysis. It defines a cluster as a maximal set of densityconnected points. The major drawback in such clustering approaches is the processing time. The time to scan the whole database and cluster accordingly is a major area of concern. This paper is motivated by the density-based clustering approaches to discover nested clusters and clusters of arbitrary shapes over 3D data space. Fig. 2 displays a nested cluster as well as a multi-density cluster. The basic idea is to reduce the processing time and enhance the efficiency henceforth. For the fulfillment of the requirements of the undertaken research the sampling technique is proposed. It is used as a data reduction technique because it allows a large data set to be represented by a much smaller random sample (or subset) of the data. An advantage of sampling for data reduction is that the cost of obtaining a sample is proportional to the size of the sample, as opposed to the whole data set size. Other data reduction techniques can require at least one complete pass through. Sampling is a natural choice for progressive refinement of a reduced data set. Such a set can be further refined by simply increasing the sample size. This technique of clustering can be efficiently used in a spatial database, where we can choose to define clusters geographically based on how closely different areas are located. Better cluster quality and more acceptable complexity are the major features of the proposed approach of 3D clustering.
Figure 2- Multi-density and nested clusters (those highlighted by black circles are nested clusters)
3. THEORITICAL BACKGROUND OF THE PROPOSED WORK The distribution of data in a data set is not uniform in general. Some portions of the data space are highly densewhile some portions are sparse. The problem associated here is efficient clustering of spatial data
points to discover nested clusters and clusters of arbitrary shapes using density based clustering technique. 3.1. Definitions Here, we introduce some definitions which are used in the proposed algorithm of 3D spatial data clustering: Definition 1Tetrahedron Density: The number of 3D spatial point objects within a particular tetrahedron of a particular polyhedron. Definition 2Useful Tetrahedron: Only those tetrahedrons which are populated i.e., which contain data points will be treated as useful tetrahedrons. Definition 3Neighbor Tetrahedron: Those tetrahedrons which have a common side (side neighbors) to the current tetrahedron are the neighbors of the current tetrahedron. Fig. 3 (a) shows a regular tetrahedron (with three of its triangular sides in yellow, blue and green shades respectively and one in red lines i.e. the one facing the reader). Fig. 3 (b) shows the four neighbor tetrahedrons of tetrahedron shown in 3 (a) which together form a polyhedron.
Figure. 3(a) & 3(b) - Neighbor tetrahedrons of the current tetrahedron Definition 4Density Confidence of a tetrahedron: If the ratio of the densities of the current tetrahedronand one of its neighbors is greater than β (user’s input) then the two tetrahedrons can be merged into the same
7
International Journal of Computer Applications (0975 – 8887) Volume 58– No.2, November 2012
cluster in 3D. Therefore the following condition should be satisfied: β ≤ dn (TP1) / dn (Tp2) where dn represents the density of the particular tetrahedron. Definition 5 Reachability of a tetrahedron: A tetrahedron p is reachable from a tetrahedron q if p is a neighbor tetrahedron of q and tetrahedron p satisfies the density confidence condition w.r.t. tetrahedron q. Definition 6Neighbor Polyhedron: Those polyhedrons which are formed from classified data points (points which lie in merged tetrahedrons) of the current polyhedron as its center are called as neighbor polyhedrons of the current polyhedron. Fig. 4 shows a neighbor polyhedron 2 of polygon 1.
tetrahedrons) not belonging to any of its clusters. Let C1, C2, ....C3 be the clusters w.r.t. β, then noise = {no_ p| p belongs to dataset, for all i no_ p does not belong to C where no_ p is the set of points in tetrahedron p or polyhedron u and Ci (i=1,..., k). 3.2. Density Confidence The density confidence for a given set of triangles reflects the general trend and distribution of the data pointsof that set. If the density of one triangle varies greatly from the others it will not be included in the set. If the density confidence of a current triangle with one of its neighbor triangle does not satisfy the density confidence condition than that neighbor triangle is not included into the currently considered dense area. On the contrary, if it satisfies the condition than we treat the neighbor triangle as a part of the considered dense area and merge the triangle with the dense area. In comparison to other methods of setting a global threshold, this method has the ability to recognize the local dense areas in the data space where multi-density clusters exist. With correspondence to the above definitions, three lemmas are stated:
Figure 4- Neighbor polyhedron 2 of polyhedron 1 Definition 7 Reachability of a polyhedron: A polyhedron 2 is reachable from polyhedron 1 if 2 is neighbor polyhedron of 1. Definition 8 Cluster: A cluster is defined to be the set of points belonging to the set of reachable tetrahedrons and polyhedrons. A cluster C is a non-empty subset satisfying the following conditions, For all u, v: if u belongs to C and v is reachable from u then v belongs to C where u and v are polyhedrons and, For each u, v belonging to C, for all p and q that belongs to u or v and p belongs to C and q is reachable from p w.r.t.βthen q also belongs to C, where p,q are tetrahedrons of an polyhedron . Tetrahedron reachable relation follows symmetric and transitive property within a polyhedron of ancluster C. Definition 9 Noise: Noise is simply the set of points belonging to the polyhedrons (or
Lemma 1: Let C be a cluster w.r.t. βand let u be any polyhedron in C and p be any tetrahedron in u. Then C can be defined as a set, S= {s and st|s is polyhedron-reachable from u andstis tetrahedron-reachable from pw.r.t.β within every u of C} Proof: Suppose Tis a tetrahedron, where T belongs to standT is not tetrahedron-reachable from pw.r.t. βor G is an polyhedron, where G belongs to s and G is not polyhedron-reachable from u. But, a cluster according to Def. 8 will be the set of points which are tetrahedronreachable from p and polyhedron-reachable from u. Therefore, we come to a contradiction and hence the proof. Lemma2: A tetrahedron of a polyhedron or a polyhedron corresponding to noise points is not tetrahedron-reachable or polyhedron-reachable from any of the clusters respectively. For a tetrahedron pwe have, all p: p is not reachable from any tetrahedron in C i.e. pdoes not belong toC and for a polyhedronu we have, all u: u is not reachable from any polyhedron in C i.e. u does not belong to C. Proof: Suppose, C be a cluster w.r.t.βand let p be a tetrahedron of a polyhedron corresponding to noise points and u be any polyhedron corresponding to noise points. Let p be tetrahedron-reachable from C, then p belongs toC. and u be polyhedron-reachable from C, then u belongs to C. But, this violates the Def. 9 that noise points are belonging to tetrahedrons or polyhedrons that are not
8
International Journal of Computer Applications (0975 – 8887) Volume 58– No.2, November 2012
tetrahedron-reachable or polyhedron-reachable from any of the clusters respectively. Therefore, we come to the conclusion that p is not reachable from any tetrahedron in C and u is not reachable from any polyhedron in C.
Lemma 3: A tetrahedronT or a polyhedron G can be tetrahedron-reachable and polyhedron-reachablefrom only a single unique cluster. Proof: Let C1 and C2 are two clusters w.r.t. βand let p be any tetrahedron and u be any polyhedron in C1 and q is any tetrahedron and v is any polyhedron in C2. Suppose a tetrahedronTis tetrahedron-reachable from both p and q or apolyhedron G is polyhedron-reachable from both u and v, then Tbelongs toC1 and Tbelongs toC2 or G belongs to C1and G belongs to C2. This will mean that the clusters C1 and C2 should be merged. This violates the basic notion that clusters are unique sets. Thus, we can conclude that if T is tetrahedron-reachable from p w.r.t. β, T is not tetrahedron-reachable from q w.r.t. β and if G is polyhedron-reachable from u, then G is not polyhedronreachable from v,i.e. T belongs to C1 and T does not belong to C2 or G belongs to C1 and G does not belong to C2. Therefore the lemma has been proved.
Figure 5(a) - Tetrahedron created from a center point (red) and side length as ε
4. THE PROPOSED ALGORITHM There are functional components like creating the polyhedron (combination of tetrahedrons), finding the number of points in each tetrahedron of a polyhedron (density), traversal of neighboring tetrahedrons from the center tetrahedron, merging two tetrahedrons and finding the farthest point of each merged tetrahedrons that are needed to be implemented to give out quality 3D clusters . 4.1. CREATING A POLYHEDRON- Since we are using the polyhedron approach, we need to consider a data point as a center of the polyhedron. Any arbitrary unclassified point can be used to start with. We are considering a polyhedron of five regular tetrahedrons, one at the center and four at each side of the center one. Thus we have five equal tetrahedrons after sub-division of the regular polyhedron. By increasing the number of tetrahedrons of the polyhedrons from five to higher we can have higher number of tetrahedral sub-divisions that can lead to more accurate clustering. The polyhedron is formed by creating five equal tetrahedrons. The center one is made from a point and an initial distance (considered as the side of one triangular face of our tetrahedron) using trigonometric and geometric formulae, explaining them is out of the scope of this paper. This initial distance is called the Epsilon Distance, ε given as an input parameter by the user. Fig. 5 shows the polyhedron formed with ε as distance.
Figure 5(b) - The four neighbor tetrahedrons of tetrahedron shown in 5(a) in red, green, blue and yellow 4.2.
COMPUTE
DENSITY
OF
EACH
TETRAHEDRON- The total number of points in each tetrahedron is its density (tetrahedron density). To compute the density we need to find the location of a point wrt the tetrahedrons. It is required to identify the points lying inside a tetrahedron. For this purpose the barycentric formulae [17], [18] are used. Using these formulae we find the number of points lying in each tetrahedron and hence find the density of each tetrahedron. Each tetrahedron is given an identifier in numbers (1, 2, 3, 4, 5). Points are also given identifiers corresponding to which tetrahedron they lie in. Only useful tetrahedrons are used for merging. Fig. 6 given below shows the above stated case.
9
International Journal of Computer Applications (0975 – 8887) Volume 58– No.2, November 2012
any direction. Fig. 8 shows a case in which two neighboring tetrahedrons are merged into one cluster satisfying the density confidence condition.
Figure 6- Density of each tetrahedron of the polyhedron 4.3.
TRAVERSAL
OF
NEIGHBOURING
TETRAHEDRONS - From the center tetrahedron we traverse the neighboring tetrahedrons in all directions (shown by all three side arrows). First we can start with all the tetrahedrons in all the side faces of the central tetrahedron, when completed we may go to the tetrahedron above the central tetrahedron (one facing the reader and shown by the central arrow). The basic purpose of traversing is to find the ratio between two adjacent tetrahedrons (central tetrahedron and one of its neighbor tetrahedrons) which share the same side among them (neighbor tetrahedrons).Fig. 7 given below shows the possible ways of traversal.
Figure 8- Merging of tetrahedrons (in light grey) if density confidence is fulfilled However, two cases can be considered with regard to density confidence of a triangle Case 1:If TP1& TP2 are two tetrahedrons of a polyhedron such that dn (TP1)>dn (TP2), where dn represents the density of a particular tetrahedron, then:β≥dn (TP1) / dn (Tp2)and β is set any value in the interval [2.5,1.43] which is found after rigorous experimentation. Case 2: If TP1&TP2are two tetrahedrons of a polyhedron such that dn (TP1)1
Average
0.3
>1
Good
>0.3
2
Average
0.4
>2
Great
Algorithms
No. of Parameters
>0.4
>2
Great
0.5
3
Exceptional
0.6
>3
Great
0.7
>3.5
Exceptional
>0.7
>3.5
Good
0.8
4
Average
Table 1 shows the affect of input parameters in the varying nature of performance of the proposed algorithm. 5.2. Complexity Analysis The partitioning of the neighborhood of an arbitrary data point into a polyhedron containing m nonoverlapping tetrahedron result in a complexity of O(m). The expansion of the cluster results in O(N*m) time complexity, where Nis the number of data points in the cluster formed and m