International Journal of Advanced Science and Technology Vol. 31, June, 2011
Density Based k-Nearest Neighbors Clustering Algorithm for Trajectory Data Ajaya K. Akasapu1, P. Srinivasa Rao2, L. K. Sharma3, S. K. Satpathy3 1
Research Scholar, Andhra University, Visakhapatnam- AP, INDIA ajaykumar.akasapu@ gmail.com 2
Department of Computer Science and System Engineering, Andhra University, Visakhapatnam-AP, INDIA
[email protected] 3
Department of Computer Science and Engineering, Rungta College of Engineering and Technology, Bhilai-CG, INDIA
[email protected],
[email protected] Abstract With widespread availability of low cost GPS, cellular phones, satellite imagery, robotics, Web traffic monitoring devices, it is becoming possible to record and store data about the movement of people and objects at a large amount. While these data hide important knowledge for the enhancement of location and mobility oriented infrastructures and services, by themselves, they demand the necessary semantic embedding which would make fully automatic algorithmic analysis possible. Clustering algorithm is an important task in data mining. Clustering algorithms for these moving objects provide new and helpful information, such as Jam detection and significant Location identification. In this paper we present augmentation of relative density-based clustering algorithm for movement data or trajectory data. It provides a k-nearest neighbors clustering algorithm based on relative density, which efficiently resolves the problem of being very sensitive to the user-defined parameters in DBSCAN. In this paper we consider two real datasets of moving vehicles in Milan (Italy) and Athens (Greece) and extensive experiments were conducted. Keywords: Trajectory Data Clustering, Density Based Cluster, Trajectory Data Mining.
1. Introduction Modern location-aware devices and applications deliver huge quantities of spatiotemporal data of moving objects, which must be either quickly processed for real-time applications, like traffic control management, or carefully mined for complex, knowledge discovering tasks. The analysis of mobile behavior leads to many instructive insights about the habits of a city‟s or a country‟s population. Always government and other organizations perform the study to evaluate mobility data with respect to travel distance, the means of transportation and the purpose of traveling. The mobility data contain spatial and temporal feature. Thus traditional data mining algorithm cannot be applied as original form. Therefore knowledge discovery from mobility data has become an important research area. In this study we consider the clustering problem for mobility or trajectory data. Cluster analysis is a process
47
International Journal of Advanced Science and Technology Vol. 31, June, 2011
for structuring and reducing data sets by finding groups of similar data elements. Cluster analysis, primitive exploration with little or no prior knowledge, consists of research developed across a wide variety of communities. Clustering has been widely used in numerous applications such as Geo-marketing, customer segmentation, pattern recognition etc [1] [5] [8]. Several data mining researchers have given significant contribution on cluster analysis [15]. But there is no clustering algorithm that can be universally used to solve all problems. Usually, algorithms are designed with certain hypothesis. In this sense, it is not accurate to say the “best” in the context of clustering algorithms, although some comparisons are possible. These comparisons are mostly based on some specific applications, under certain conditions, and the results may become quite different if the conditions change. Hence existing cluster techniques are needed to be enhanced to mine the trajectory data or new cluster techniques are to be developed. Most of traffic planner or Geo-marketer takes interest to know the most visited place. It is very useful in various applications. Trajectory data provides good chance to identify the visited place and also find the similar interested place. In this paper we present relative density based k-nearest neighbors clustering technique to extract interested place. This technique discovers arbitrary shape cluster. It has ability of identifying noise, easily setting the input-parameter and gets the recommended value more accurately. The remainder of this paper is organized as follows. In section 2, we present the related work in the area of trajectory clustering. In section 3, we present the trajectory data model. In section 4, we describe the notation of relative density based k-nearest neighbors clustering technique and we discuss the proposed trajectory clustering method. Data preprocessing and result analysis is reported in section 5. Finally the work is concluded.
2. Related Works Cluster analysis is the organization of a set of objects into classes or clusters based on similarity. Intuitively, objects within a valid cluster are more similar to each other than they are to an object belonging to a different cluster. The variety of techniques for representing data, measuring proximity (similarity) between data elements, and grouping data elements have produced a rich and often confusing assortment of clustering methods. It is important to understand the difference between clustering (unsupervised classification) and discriminate analysis (supervised classification) [15]. Many researchers have defined four steps for cluster analysis: feature selection or extraction, cluster algorithm design and selection, cluster validation, and result interpretation. These steps are closely related to each other and affect the derived clusters. Several researchers have given significant contribution on the study of cluster techniques. Roughly, these clustering algorithms can be separated into five general categories [15]; hierarchical clustering, partition clustering, grid-based clustering, modelbased clustering, and density-based clustering. Hierarchical clustering builds a cluster hierarchy or a tree of cluster, which is called dendrogram. Every cluster node contains child clusters; sibling clusters; they partition the points covered by their common parent. Such an approach allows exploring data on different levels of granularity. Hierarchical clustering methods are categorized into agglomerative (bottom-up) and divisive (top-down) [15]. An agglomerative clustering approach starts with the assumption that each object is singleton cluster and recursively merges two or more appropriate clusters. A divisive clustering approach starts with all the objects in a same cluster and recursively splits the most appropriate cluster. The process continues until a stopping criterion (the requested number k of clusters) is achieved.
48
International Journal of Advanced Science and Technology Vol. 31, June, 2011
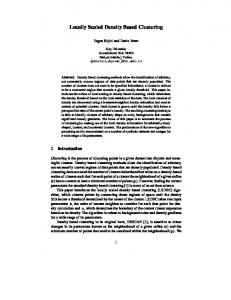
Partitioning clustering methods begin into a fixed k-number of Clusters and during the clustering process they change clusters based on their similarity to the closest cluster. The user specifies the number of clusters as an input parameter in most of the partitioning methods. The partition clustering techniques can produce local or global optimized clusters. Criterion Function is one of the important factors in partition clustering method [1] [13] [15]. Sum of squared error function is widely used criteria by partition clustering method. It has a tendency to work well with isolated and reasonably dense clusters [13]. Grid-based clustering methods start by forming a grid structure of cells from the objects of the input dataset. Each object is classified in a cell of the grid. The clustering is performed on the resulting grid structure. It is efficient especially in high-dimensional spaces. Some of the grid based clustering techniques are STING [16], STING+ [17] and Wave Cluster [7]. Model-based clustering methods typically assume that the objects in the input dataset match a model which is often a statistical distribution. Then, the process tries to classify the objects in such a way that they match the distribution. The model or statistical distribution may be given by the user as an input parameter and the model may change during the clustering process. COBWEB [15] is a model based conceptual clustering method primarily used for categorical datasets. It creates a hierarchical clustering in the form of a classification tree. Density based clustering methods discover cluster based on the density of points in regions. Therefore density based clustering methods are capable to produce arbitrary shapes clusters and filter out noise (outlier) [13] [14]. Ester et al [13] introduced density based algorithms DBSCAN and further it was generalized [14] by using symmetric and reflexive binary predicate and introduces some non-spatial parameter “cardinality”. Thus the GDBSCAN algorithm can cluster point objects as well as spatially extended objects according to both, their spatial and their non-spatial, attributes. Apart from this, several variants of DBSCAN algorithm have been reported in literature. The key feature of DBSCAN (Density-Based Spatial Clustering of Applications with Noise) is that for each object of a cluster, the neighborhood of a given radius has to contain at least a specified minimum number MinC of objects, i.e., the cardinality of the neighborhood has to exceed a given threshold. Radius and minimum number MinC of objects are specified by user. Let D be a data set of objects, the distance function between the objects of D is denoted by DIST and given parameters are and MinC then DBSCAN can be specified by the following definitions. The following definitions are adopted from Ester et al [13]. Definition 1. (Neighbourhood of an object). The -neighbourhood of an object p, denoted by N (p) is defined by N (p) = {q D | DIST (p, q) }. Definition 2. (Direct Density Reachability). An object p is direct density reachable from object q w.r.t. and MinC if |N (P)| MinC p N (q). q is called core object when the condition |N (P)| MinC holds (Figure 1 (a, b)). Definition 3. (Density Reachability). An object p is density-reachable from an object q w.r.t and MinC if there is a sequence of objects p 1…p n; p 1 = q, p n = p such that p i+1 is direct density reachable from p i.
49
International Journal of Advanced Science and Technology Vol. 31, June, 2011
Figure 1: Density Based Clustering Concepts (MinC = 5). DBSCAN chooses an arbitrary object p. It begins by performing a region query, which finds the neighborhood of point q. If the neighborhood contains less than MinC objects, then object p is classified as noise. Otherwise, a cluster is created and all objects in p‟s neighborhood are placed in this cluster. Then the neighborhood of each of p‟s neighbors is examined to see if it can be added to the cluster. If so, the process is repeated for every point in this neighborhood, and so on. If a cluster cannot be expanded further, DBSCAN chooses another arbitrary unclassified object and repeats the same process. This procedure is iterated until all objects in the dataset have been placed in clusters or classified as noise. Some researchers augmented above clustering algorithm to mine streaming time series data that is very much connected to two other fields: clustering of time series, for its application in the variable domain, and clustering of streaming examples, for its applications to data flowing from high-speed streams. Although a lot of research has been done on clustering sub-sequences of time series, streaming time series approaches etc., most of the existing techniques can be successfully applied, only if incremental versions are possible. Clustering streaming examples is also widely spread in the data mining community as a technique used to discover structures in data over time. This task also requires high-speed processing of examples and compact representation of clusters. Moreover, clustering examples over time presents issues adaptively that are also required when clustering streaming series. Evolutionary clustering tries to optimize these techniques. However, the need to detect and track changes in clusters is not enough, and it is also often required to provide some information about the nature of changes. Lee et al [8] has proposed partition and group frame based trajectory clustering technique. The advantage of this framework is to discover common sub-trajectories from a trajectory database. This algorithm consists of two phases: partitioning and grouping. The first phase presents a formal trajectory partitioning algorithm using the Minimum Description Length (MDL) principle. The second phase presents a density-based line-segment clustering algorithm. Further this technique is used by Lee et al [9] and they proposed a trajectory classification technique.
50
International Journal of Advanced Science and Technology Vol. 31, June, 2011
3. Trajectory Data Models Trajectory data are normally obtained from location-aware devices that capture the position of an object at a specific time interval. The collection of these kinds of data is becoming more common, and as a result large amounts of trajectory data are available in the format of sample points. In many application domains, such as transportation management, animal migration, and tourism, useful knowledge about moving behaviour or moving patterns can only be extracted from trajectories, if the background geographic information where trajectories are located is considered. Therefore, there is a necessity for a special processing on trajectory data before applying data mining techniques. Let denote the set of real numbers and 2 is restricted to the real plane (although all definitions and results can be generalized to higher dimensions). Then, trajectory, sample trajectory and speed of trajectory can be defined as follows [10]. Definition 1 (trajectory). A trajectory T is the graph of mapping I 2: t (t) = (x (t), y (t)), i.e. T = {(t, x (t), y (t)) 2 | t I}. The image of the trajectory „T‟ is the image of the mapping „‟ that describes „T‟. The set „I‟ is called the time domain of „T‟. Definition 2 (trajectory sample). A trajectory sample is a list {(t0, x0, y0), (t1, x1, y1)… (tN, xN, yN)}, with ti, xi, yi for i = 0,…, N and t0 < t1