Hindawi Publishing Corporation International Journal of Distributed Sensor Networks Volume 2016, Article ID 9653230, 9 pages http://dx.doi.org/10.1155/2016/9653230
Research Article An Improved ARIMA-Based Traffic Anomaly Detection Algorithm for Wireless Sensor Networks Qin Yu,1 Lyu Jibin,2 and Lirui Jiang1 1
The School of Communication and Information Engineering, University of Electronic Science and Technology of China, Chengdu 611731, China 2 The Department of Computer Science, University of Southern California (USC), Los Angeles, CA 90089, USA Correspondence should be addressed to Qin Yu;
[email protected] Received 3 October 2015; Revised 17 December 2015; Accepted 21 December 2015 Academic Editor: Gianluigi Ferrari Copyright © 2016 Qin Yu et al. This is an open access article distributed under the Creative Commons Attribution License, which permits unrestricted use, distribution, and reproduction in any medium, provided the original work is properly cited. Traffic anomaly detection is emerging as a necessary component as wireless networks gain popularity. In this paper, based on the improved Autoregressive Integrated Moving Average (ARIMA) model, we propose a traffic anomaly detection algorithm for wireless sensor networks (WSNs) which considers the particular imbalanced, nonstationary properties of the WSN traffic and the limited energy and computing capacity of the wireless sensors at the same time. We systematically analyze the characteristics of WSN traffic, the causes of WSN abnormal traffic, and the latest related research and development. Specifically, we improve the traditional time series ARIMA model to make traffic prediction and judge the traffic anomaly in a WSN. Simulated and real WSN traffic data gathered from University of North Carolina are used to carry out simulations on Matlab. Simulation results and comparative analyses demonstrate that our proposed WSN traffic anomaly detection scheme has better anomaly detection accuracy than traditional traffic anomaly detection algorithms.
1. Introduction The latest developments in distributed computing and microelectromechanical systems have enabled in the past years the emergence of various wireless sensor networks (WSNs) applications comprising military [1], home automation [2], smart building [3], healthy and medical application [4], vehicle and target tracking [5], and industry domains [6, 7]. In general, a WSN consists of a large number of low cost and densely deployed battery-powered sensor nodes with wireless communication, sensing, processing, and storage capabilities [6]. The sensor nodes are equipped with sensing, computing, power, and communication modules to monitor a certain phenomenon such as environmental data or object tracking [8]. Traffic anomaly detection is emerging as a necessary component as WSNs gain popularity. Traffic anomaly detection in a WSN provides useful tools for understanding network behavior and determining network performance and reliability so as to effectively and promptly troubleshoot and resolve various issues in practice. WSN traffic anomaly
detection has become a very active research area over the past few years. Furthermore, traffic anomaly detection in a WSN provides a sound basis for prevention and reaction in network security, as intrusions, attacks, worms, and other kinds of malicious behaviors can be identified by traffic analysis and anomaly detection. It is well known that traffic anomaly detection has been addressed broadly in wired networks and powerful methods have been developed for correct detection of abnormal traffic. Due to the different traffic characteristics from traditional wired networks, the traffic anomaly detection schemes in wired networks cannot be applied to WSNs directly. An important characteristic of a WSN is that the nodes energy, computing power, and storage capacity are severely limited, which is one challenge for designing the WSN traffic anomaly detection algorithm. Another great challenge is to find suitable method to deal with the nonstationary and application correlation (burst) characteristics of WSN traffic. In this paper, we systematically summarize the characteristics of WSN traffic and the causes of its abnormal
2 traffic. We also make classification research on related WSN traffic anomaly detection model and method and carry out comparative analyses. On the basis of most widely used time series Autoregressive Moving Average (ARMA) model, we choose ARIMA model and improve it to make traffic prediction and judge the traffic anomaly according to the relative error. ARIMA model is really suitable for WSN since it is available for nonstationary series modeling and owns high accuracy and affordable computational complexity. We make three key improvements on ARIMA model: using a sliding window to determine historical data for modeling, updating the model after each time sliding window, and making traffic prediction by short step exponential weighted average method. Simulation results and comparative analyses demonstrate that the WSN traffic anomaly detection algorithm based on improved ARIMA model possesses higher detection accuracy than traditional method. The remaining of the paper is organized as follows. The system analysis is given in Section 2 for finite population CDMA asynchronous Aloha systems with restricted sojourn time and variable packet length. In Section 3, based on the analysis and simulation results, we study in depth the impact of packet length on the system performance and quantify the effect of system parameters. In Section 4, we show that our analysis can be used for a variety of applications, that is, parameter optimization, analysis of integrated services, and anomaly detection. Section 5 concludes our paper.
2. Related Work The researches on traffic anomaly detection can be divided into three categories. They are detection based on feature and behavior, statistic-based detection, and intelligent detection based on machine learning and data mining. We review below the main research areas together with some related references on the traffic anomaly detection algorithms for WSNs. 2.1. Detection Based on Feature and Behavior. The anomaly detection method based on feature and behavior is to look for matched patterns with anomalous traffic in network traffic data, thereby detecting abnormal traffic. This approach requires inputting data packets or network traffic and has good detection precision and real-time performance. In addition to detecting network anomalies, the approach can also analyze and determine the types of network anomalies. However, because this method requires doing real-time comparison between the current traffic and the feature of abnormal traffic, the database of abnormal traffic characteristics has become an important factor restricting the detection accuracy. When using this method, we need to build a huge feature database and constantly update, which will be a big challenge for computing, storage capacity constrained wireless sensor networks. In [9], Wang uses wireless sensor network packet traffic to extract sensor nodes and network behavior characteristic profiles and identify anomalies by monitoring nodes and network behavior profiles.
International Journal of Distributed Sensor Networks 2.2. Detection Based on Statistics. Detection method based on statistics does not need to know the characteristics of abnormal traffic behaviors in advance; it directly makes use of statistical analysis techniques, calculating statistics such as mean and variance, of the inputted traffic data, and judges whether the traffic is abnormal according to the bias of statistics. This kind of method mainly includes CUSUM algorithms and wavelet analysis. In [10], the authors put forward a matrix-based, multistatistics modified CUSUM algorithm (M-CUSUM) to detect network flow abnormity in real time through calculating the ratio between the subtracting and plus absolute value among ingress and egress ports traffic. In [11], Zhiyuan et al. propose a wavelet analysis-based real-time anomaly detection (WARAD) algorithm, which reversely collects the real-time network traffic and then uses the variance of the wavelet coefficients in the small-scale interval to compute the Hurst values. This method can improve the real time and the accuracy of anomaly detection and reduce the computational complexity of solving the Hurst values. Besides, because Hurst parameters of different decomposition levels are composed of the variances of different level wavelet coefficients, therefore, we can determine abnormalities by only detecting significant change of variances of adjacent level wavelet coefficients. 2.3. Intelligent Detection Based on Machine Learning and Data Mining. This kind of method usually regards anomaly detection as a classification or clustering problem and then builds an anomaly detection model by means of efficient machine learning. Finally, the constructed model is used to make realtime judgment of abnormal traffic behaviors. This intelligent detection method includes so many subdivided ways, such as Markov Model, ARMA Model, Immune Genetic Algorithm, Back Propagation (BP) Neural Networks, and Support Vector Machine (SVM). In [12], Paschalidis and Chen make use of a series of Markov models to characterize the behavior of the sensor network, including tree-indexed Markov chains. Moreover, large deviations techniques and optimal decision rules are used to identify anomalies in recent activity. In [13], Tian et al. present a community intrusion detection system based on support vector machine (SVM) for classification to recognize abnormal phenomenon. In [14], the researchers propose two new clustering algorithms, the improved competitive learning network (ICLN) and the supervised improved competitive learning network (SICLN), for fraud detection and network intrusion detection. The ICLN is an unsupervised clustering algorithm, which applies new rules to the standard competitive learning neural network (SCLN). The SICLN is a supervised version of the ICLN. In [15], the writers propose an enhanced DDoS attacks detection approach by optimizing the parameters of the traffic matrix using a Genetic Algorithm (GA) to maximize the detection rates. As we can see, intelligent detection is widely used in network area and is one of the most important methods of traffic anomaly detection with good development prospects. The last three sections summarize the current mainstream WSN traffic anomaly detection methods, and now
International Journal of Distributed Sensor Networks
3
Table 1: Performance of different detection methods. Detection method (based on) Feature & behavior CUSUM Wavelet analysis Markov model ARMA model Immune-genetic Neural networks SVM
Data needed RH L RL RH RL H H RH
Complexity RL RL N N N H RH RH
Accuracy N N RG RG RG G G G
Intelligence RG N RG N N G G G
Independence RG G RB RG G B RB RG
G means good. B means bad. H means high. L means low. N means normal. R means relatively.
a comparative analysis on advantages and disadvantages of their performance is made in Table 1, where G is for good, B is for bad, H is for high, L is for low, N is for normal, and R is for relatively. In Table 1, independence is the ability to detect anomalies when the detection method is used alone. Usually, the methods with bad and relatively bad independence are optimization and assist methods. The method based on feature and behavior needs a large amount of data to build feature database, the method based on Markov model requires a lot of data to get Markov prediction model, and the last three methods also require big data to make cluster analysis, convergence, and optimization. In general, with the improvement of detection accuracy, the method complexity is also increasing. It is our goal to do research on detection approach occupying high accuracy and low complexity.
3. Theoretical Analysis 3.1. WSN Traffic Characteristics. WSN traffic mainly has two important properties of imbalance and application correlation (burst): (1) The imbalance is mainly reflected in traffic of convergence nodes and sensor nodes. Wireless sensor network, composed by convergence nodes and sensor nodes, is data-centric. While large amounts of data are transferred from sensor nodes to convergence nodes, a small amount of control messages needs to be transmitted from convergence nodes to sensor nodes. So its main traffic is aggregated at convergence nodes and the base station. (2) The application correlation represents that network is filled with burst traffic. WSN is application-related, meaning time-driven and periodic data inquiring, so its traffic data is periodic. When carrying out collection and tracking for the target data, the traffic will be a “peak” since large amounts of data are transferred within a short time. 3.2. Causes of WSN Traffic Anomaly. WSN sensor nodes are deployed in an open area and use radio, which makes it vulnerable to malicious destruction of personnel, bringing a series of security risks, such as leaking out information.
Table 2: WSN traffic anomaly causes and traffic changes shape. WSN layer Application layer Transport layer
Network layer
Link layer Physical layer
Attack method Malicious code Ping/ICMP flood Synflood Packet forgery/playback Selected forwarding Direction misleading Sinkhole Resource depletion Collision Congestion Physical damage
Traffic change Anomaly (whole) Increase (whole) Increase (whole) Indefinite Anomaly (part) Anomaly (part) Increase (part) High for long time Concentrated (part) Anomaly high (part) Decrease to zero
Common attack methods include flooding attack, sinkhole attack, and resource depletion attack [16], and these attacks will cause abnormal network traffic behavior. The attack methods of different network layers as well as their caused network traffic anomaly are elaborated in Table 2. As we can see, nearly all of the attacks will bring about anomalies. Therefore, by monitoring network traffic, it can help determine whether the abnormal behaviors happen in a network and whether a network is subjected to the attack, which are really good for making appropriate defense measures in subsequence. 3.3. Definition of ARIMA Model. Autoregressive Integrated Moving Average (ARIMA) model, a well-known time series forecasting method, has been proposed by Box and Jenkins in the early 1970s. Nonseasonal ARIMA models are generally denoted by ARIMA(𝑝, 𝑑, 𝑞), where parameters 𝑝, 𝑑, and 𝑞 are nonnegative integers, 𝑝 is the order of the Autoregressive model, 𝑑 is the degree of differencing, and 𝑞 is the order of the Moving Average model. For general time series {𝑋𝑡 , 𝑡 = 1, 2, . . . , 𝑛}, set its mean 𝐸(𝑋𝑡 ) = 𝜇; ARIMA(𝑝, 𝑑, 𝑞) model can be expressed as 𝜑 (𝐵) (∇𝑑 𝑋𝑡 − 𝜇) = 𝜃 (𝐵) 𝜀𝑡 ,
𝑡 > 𝑑,
(1)
where 𝐵, 𝐵𝑋𝑡 = 𝑋𝑡−1 , denotes backward shift operator, and ∇𝑑 , ∇𝑑 𝑋𝑡 = (1 − 𝐵)𝑑 𝑋𝑡 , donates 𝑑-order differential operator.
4
International Journal of Distributed Sensor Networks Step 4. Estimate the unknown parameters in the model by correlation moment estimation, least squares estimation, or maximum likelihood estimation method.
Time series data
Is the data stationary?
No
Step 5. Diagnose whether residual sequence is white noise. If not, go back to Step 2.
Make difference
Step 6. Do predictive analyses using the established ARIMA model.
Yes
3.5. Advantages of ARIMA Model. Applying ARIMA model in WSN traffic anomaly detection has three major advantages:
Establishing the appropriate model
Identifying the optimal order
Estimating the unknown
No
Is the ARIMA model valid?
Yes Forecasting
(2) ARIMA model can be applied to nonstationary time series, which is really suitable for the nonstationary characteristics of most WSN traffic. And it also owns a relative high accuracy.
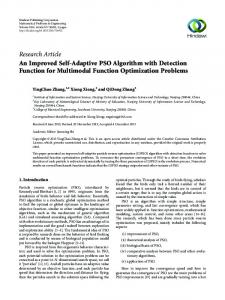
Figure 1: ARIMA model.
Furthermore, backward shift operator polynomials 𝜑(𝐵) and 𝜃(𝐵) are defined as 𝜑 (𝐵) = 1 − 𝜑1 𝐵 − 𝜑2 𝐵2 − ⋅ ⋅ ⋅ − 𝜑𝑝 𝐵𝑝 , 𝜃 (𝐵) = 1 − 𝜃1 𝐵 − 𝜃2 𝐵2 − ⋅ ⋅ ⋅ − 𝜃𝑞 𝐵𝑞 .
(1) ARIMA model is based on the Markov random process, which could reflect the dynamic characteristics of ARIMA model. And ARIMA model includes AR model, MA models, and ARMA model, which fully absorbs the advantages of regression analysis and strengthens the good qualities of moving average.
(2)
3.4. Traditional ARIMA Modeling. The time series for ARIMA modeling is generally nonstationary. Firstly the appropriate process is needed to make it stationary (𝑑order difference); then we should identify the idea that it is Autoregressive (AR) model, Moving Average (MA) model, or ARMA model in accordance with the model identification rules and then do other steps such as model order identification, parameters estimation, and hypothesis testing. To clarify, we list all the steps in detail as follows. Moreover, Figure 1 could help us understand the algorithm. Step 1. Determine whether a sequence is stationary using Dickey-Fuller Test and doing difference until the sequence is stationary if test fails. Step 2. Establish the appropriate model based on the identification rules of the ARIMA model. If the autocorrelation function is tailing and partial correlation function is truncated of a stationary series, then it can be modeled by AR model; if the autocorrelation function is truncated and partial correlation function is tailing of a stationary series, then it can be modeled by MA model; if both the autocorrelation and partial correlation function of a stationary series are tailing, then it can be modeled by ARMA model. Step 3. Identify the optimal order for the established model using AIC (Akaike Information Criterion) or BIC (Bayesian Information Criterion).
(3) ARIMA model can be used for traffic prediction and anomaly detection in WSN because of its affordable computational complexity.
4. Improvement of ARIMA Model 4.1. Using a Sliding Window to Determine Historical Data for Modeling. ARIMA model uses sampled historical data to model and predict future data. In order to ensure fast and accurate modeling, we design a fixed size sliding window, and the size value should be as small as possible under the premise of relatively high modeling accuracy. This will not only ensure the rapid modeling, but also guarantee the effectiveness of the latest historical data, so we can get a more accurate predictive value (reasonable network traffic expectation). 4.2. Updating the Model after Each Time Sliding Window. Since WSN traffic is generally nonstationary and fluctuated, in each sliding window, the established ARIMA model using data in this window also changes a lot. Therefore, after each movement of the sliding window, it is required to refit model, establish order, and estimate parameters depending on the data in a new window and then calculate the predicted traffic value. Thus, the timely updated new model ensures the accuracy of the predicted value, which appears to be conducive to judge whether the advanced traffic is normal or abnormal. 4.3. Making Traffic Prediction by Short Step Exponential Weighted Average Method. This paper proposed that short step exponential weighted average method is a key step to detect WSN traffic anomaly which to some extent reduces the predictive accuracy but enhances the ability of the abnormal traffic judgment. The method is mainly divided into two parts: short step prediction and predictive traffic value weighted average.
International Journal of Distributed Sensor Networks
5
Modeling using data in sliding window Making L-step prediction 1
D1
2
D2
3
D3
4
D4
5
D5 Making exponential weighted average to produce a final determination value D
6 ···
Figure 2: Exponential weighted average method.
Correlation exists on data at different times. If the interval between them is shorter, their correlation is greater; conversely, if the interval between them is longer, their correlation is smaller. Therefore, when making traffic prediction by sample data, the closer the time point near sample data is, the more the prediction has accuracy. For ARIMA model, we could consider when prediction step 𝐿 ≤ 𝐿 0 , its predictive value is highly valid, and the shorter the prediction step, the more accurate the predictive value. Based on the analysis above, when the prediction step 𝐿 = 1, the predictive traffic value is most accurate and effective, but it is not suitable for the abnormal traffic detection. Because when WSN traffic anomaly occurs in a new time and the window slides to a new time position, model quickly approaches and fits, so the obtained next time traffic prediction value will be the “accurate” new abnormal traffic value. When the actually abnormal traffic occurs at next time, it can only be determined to be normal, rather than abnormal. Therefore, for anomaly detection algorithm design, sometimes it is necessary to achieve “inaccurate” prediction value in order to make accurate detection. For this reason, we introduce certain “inertia” to predictive value. When the abnormal traffic comes, it cannot easily change the normal fitting ARIMA model and can get better predictive value of normal traffic predictive value, which could be used to detect abnormalities easily. Its theoretical basis is that network traffic is often at a certain steady state, which has certain “inertia,” so any sudden traffic change is caused by equipment malfunction or human-caused unnatural behaviors, which can be judged to be abnormal state. In order to detect traffic anomalies more easily, we introduce certain “inertia” to normal traffic, that is, using short step exponential weighted average method, which is shown in Figure 2 and described in the following (and, in this figure, we consider 𝐿 = 5): (1) Modeling using data in sliding window, making 𝐿step prediction, and saving predictive values in corresponding position of timetable (column coordinate corresponds to different time).
(1) Wind ← setWind() (2) ErrThred ← setErrThred() (3) PredStep ← setPredStep() (4) while (TrafficData) do (5) Count ← 0 (6) ModelingData ← getDataInWind(TrafficData, Wind) (7) df ← isPassDFTest(ModelingData) (8) for (!df) do (9) ModelingData ← diffData(ModelingData) (10) df ← isPassDFTest(ModelingData) (11) end for (12) [𝑝, 𝑞] ← findBestOrder(ModelingData) (13) ModelCoeff ← buildARIMA(ModelingData, 𝑝, 𝑞) (14) PredTraffic ← Prediction(ModelCoeff, ModelingData, (15) PredStep) (16) JudgingTraffic ← ExpWeighAve(PredTraffic) (17) err ← ErrCalculator(TrafficData, JudgingTraffic) (18) if (err > ErrThred) then (19) AlarmTraffic ← Alarm(TrafficData) (20) Count← updateCount() (21) end if (22) Count← Count − 1 (23) if (Count > 0) then (24) Fluctuate ← ErrCalculator (TrafficData, (25) AlarmTraffic) (26) Alarm() (27) end if (28) Wind ← updateWind() (29) end while Algorithm 1
(2) Making exponential weighted average on 𝐿 values in the same column of timetable to produce a final determination value when predictive value updating occurs; namely, the final determination is represented as 𝐿
𝐷 = ∑ 𝜆 𝑖 𝐷𝑖 , 𝑖=1
where 𝜆 𝑖 is the weight vaule of 𝐷𝑖 .
(3)
6
International Journal of Distributed Sensor Networks Start
Make the sliding window move a step forward No
Get data in the sliding window
Make difference
No
Has all the data been traversed?
Is the data stationary?
Yes
End
Judge whether the traffic of next moment is abnormal
Yes Make traffic prediction by short step exponential weighted average method
Establishing the appropriate model
Make L-step prediction
Identifying the optimal order
Yes
Is the ARIMA model valid?
Estimating the unknown No
Figure 3: The improved ARIMA-based traffic anomaly detection algorithm.
(3) Judging whether the traffic of next moment is abnormal by relative error between it and the obtained final determination value. To clarify, we usually set a threshold from 5% to 15% depending on different WSN, and when relative error exceeds the threshold we consider that the traffic anomaly happens and use a warning signal to mark it.
5. Design and Implementation of Traffic Anomaly Detection in WSN Based on the ARIMA model improvements mentioned in Sections 3 and 4, we design a complete anomaly detection algorithm for WSN. Furthermore, another traffic anomaly determination mechanism is introduced to assist anomaly detection, that is, using first detected traffic anomaly value by relative error as a reference and also extending a time period from this detection moment. Then, in this continuous time, if the traffic is still fluctuating around the reference traffic value within the relative error judging threshold, it is considered abnormal traffic and we send out warning signals. The whole proposed improved ARIMA-based traffic anomaly detection algorithm for WSN is described in Algorithm 1. Moreover, Figure 3 could help us understand the algorithm. At line (7), Dickey-Fuller Test is used to determine the stationarity of modeling data. At line (12), a double circulation is established to set ARIMA model orders 𝑝 and 𝑞 different
value and calculate the corresponding AIC (Akaike Information Criterion) and BIC (Bayesian Information Criterion) value. Then we choose the orders 𝑝 and 𝑞 which could get the lowest AIC and BIC as the best order of modeling. At line (14), 𝑃𝑟𝑒𝑑𝑇𝑟𝑎𝑓𝑓𝑖𝑐 is saved as array corresponding to the timetable, and, at line (16), exponential weighted average method is specified in 𝐸𝑥𝑝𝑊𝑒𝑖𝑔ℎ𝐴V𝑒(), which uses 𝑃𝑟𝑒𝑑𝑇𝑟𝑎𝑓𝑓𝑖𝑐 saved in the same column of timetable to produce final judging traffic. 𝐸𝑟𝑟𝐶𝑎𝑙𝑐𝑢𝑙𝑎𝑡𝑜𝑟() at lines (17) and (24) can calculate the relative error of two values.
6. Results and Discussion In this section, a simulated and part of real WSN traffic data are used to carry out simulations on Matlab. The real WSN traffic data, gathered from University of North Carolina, consists of humidity measurement collected during 6-hour period at intervals of 5 seconds in 2010. The traffic data are shown in Figures 4(a) and 5(a). In these two simulations, we all set sliding window to 15 steps and prediction length to 5 steps. As for determination relative error, which depends on different WSN traffic properties, we choose 8% for simulation on simulated WSN traffic and 5% for real WSN traffic. Finally, the simulation results are shown in Figures 4(c) and 5(c). We also exhibit the detection results by traditional ARIMA-based algorithm in Figures 4(b) and 5(b) as comparison. From the simulation results, we could clearly see that the designed improved ARIMA-based WSN traffic anomaly
International Journal of Distributed Sensor Networks
7
0.6
0.7
0.5
0.6 Traffic (Mbps)
Traffic (Mbps)
0.7
0.4 0.3 0.2 0.1 0
0.5 0.4 0.3 0.2 0.1
0
15
30
45 Time (min)
60
75
90
0
0
10
Real traffic Known alarm
20
30
40 50 Time (min)
Real traffic Predictive traffic
(a) Simulated WSN traffic
60
70
80
90
Alarm
(b) Detection by traditional ARIMA-based algorithm
0.7
Traffic (Mbps)
0.6 0.5 0.4 0.3 0.2 0.1 0
0
10
20
30
Real traffic Predictive traffic
40 50 Time (min)
60
70
80
90
Alarm
(c) Detection by improved ARIMA-based algorithm
Figure 4: Simulation results on simulated WSN traffic.
detection algorithm gets a smoother predictive curve constituted by the connection of its overall predictive traffic value, which reflects the “inertia” (stability) of normal traffic. Thereby, when an exception occurs, the model will not quickly fit to abnormality, so that it can better detect the occurrence of abnormal traffic. And the designed judgment delay mechanism can well assist to make anomaly detection and send out alert taking advantage of reference abnormal traffic value. As shown in Figures 4 and 5, compared with traditional methods, the improved algorithm raises the correct detection rate considerably while the incorrect detection rate remains at quite low level. So, the improved ARIMAbased algorithm outperforms the traditional ARIMA-based algorithm. To clarify the conclusion from some measures, we define true positive (TP), false positive (FP), true negative (TN), and false negative (FN) and they are explained in Table 3. Actually, Positive/Negative means that the model predicts that the data is abnormal/normal and True/False means that the prediction is right/wrong. Now, in order to measure traditional and improved ARIMA-based algorithm, we define false positive rate FPR,
Table 3: Definition of TP, FP, TN, and FN. Predicted Abnormal Normal
Actual Abnormal True position (TP) False negative (FN)
Normal False positive (FP) True negative (TN)
false negative rate FNR, and accuracy AC in formula (4). The simulation results are shown in Table 4. In simulated data of which the number is 90, the number of abnormal data is 11. And in real data of which the number is 4320, the number of abnormal data is 240: FPR =
FP , FP + TN
FNR =
FN , FN + TP
AC =
TP + TN . TP + TN + FP + FN
(4)
8
International Journal of Distributed Sensor Networks 120
100 90
100
70
Traffic (%RH)
Traffic (%RH)
80 60 50 40 30 20
80 60 40 20
10 0 185
190
195
200 205 Time (min)
210
0 185
215
190
195
Real traffic Known alarm
Real traffic Predictive traffic
(a) Real WSN traffic
Traffic (%RH)
200
205
210
215
Time (min) Alarm
(b) Detection by traditional ARIMA-based algorithm
100 90 80 70 60 50 40 30 20 10 0 185
190
195
200
205
210
215
Time (min) Real traffic Predictive traffic
Alarm
(c) Detection by improved ARIMA-based algorithm
Figure 5: Simulation results on real WSN traffic.
Table 4: Detection capabilities of different algorithms. Anomaly detection algorithm TN FP TP FN FPR FNR AC
Traditional ARIMA-based Simulated data Real data 79 4075 0 5 1 26 10 214 0 0.0012 0.9091 0.8917 0.8889 0.9493
The results show that even though FPR increases due to the reference and delay mechanism of the improved algorithm, it still remains at a very low state. However, the improved algorithm sharply lowers the FNR, meaning reducing the undetected rate; thus it improves the detection accuracy. As our implemented simulation is shown in Table 4, though the simulation on the basis of either simulated data or real data gets slightly variant consequence, they hold the same tread.
Improved ARIMA-based Simulated data Real data 77 4070 2 10 10 126 1 114 0.0253 0.0025 0.0909 0.4750 0.9667 0.9713
7. Conclusions In this paper, we introduce an improved ARIMA model based traffic anomaly detection algorithm for WSN. Through model improvements analysis, algorithm design, and simulation, it is demonstrated that setting a fixed size sliding window and timely updating model enhance the prediction accuracy; short step exponential weighted average method increases the detection rate to detect the occurrence of abnormal traffic but
International Journal of Distributed Sensor Networks decreases the modeling accuracy as we wish, and introducing a reference and delay mechanism also raises the correct anomaly detection rate. In the future, we plan to change modeling historical data, namely, modeling using data in continuous early dates corresponding to the same prediction moment, and then do our other designs of algorithm to make anomaly detection, which takes application correlation characteristics of WSN into account and will reduce the false alarm rate and increase the accurate detection rate as well.
Disclosure Qin Yu is a member in IEEE.
Conflict of Interests The authors declare that there is no conflict of interests regarding the publication of this paper.
Acknowledgments This work is partly supported by the Chengdu Science and Technology Project (2014-HM01-00310-SF), the Information Technology Research Projects of Ministry of Transport of China (2014 364X14 040), and the National Natural Science Foundation of China (61104042).
References [1] G. Simon, M. Maroti, A. L´edeczi et al., “Sensor network-based countersniper system,” in Proceedings of the 2nd International Conference on Embedded Networked Sensor Systems (SenSys ’04), pp. 1–12, ACM, Baltimore, Md, USA, November 2004. [2] M.-T. Vo, V.-S. Tran, T.-D. Nguyen, and H.-T. Huynh, “Wireless sensor network for multi-storey building: design and implementation,” in Proceedings of the International Conference on Computing, Management and Telecommunications (ComManTel ’13), pp. 175–180, IEEE, Ho Chi Minh City, Vietnam, January 2013. [3] M. S. Familiar, J. F. Mart´ınez, and L. L´opez, “Pervasive smart spaces and environments: a service-oriented middleware architecture for wireless ad hoc and sensor networks,” International Journal of Distributed Sensor Networks, vol. 2012, Article ID 725190, 11 pages, 2012. [4] M. Al Ameen, J. Liu, and K. Kwak, “Security and privacy issues in wireless sensor networks for healthcare applications,” Journal of Medical Systems, vol. 36, no. 1, pp. 93–101, 2012. [5] A. Arora, P. Dutta, S. Bapat et al., “A line in the sand: a wireless sensor network for target detection, classification, and tracking,” Computer Networks, vol. 46, no. 5, pp. 605–634, 2004. [6] I. F. Akyildiz, W. Su, Y. Sankarasubramaniam, and E. Cayirci, “Wireless sensor networks: a survey,” Computer Networks, vol. 38, no. 4, pp. 393–422, 2002. [7] A. Flammini, P. Ferrari, D. Marioli, E. Sisinni, and A. Taroni, “Wired and wireless sensor networks for industrial applications,” Microelectronics Journal, vol. 40, no. 9, pp. 1322–1336, 2009.
9 [8] Z. M. Saric, D. D. Kukolj, and N. D. Teslic, “Acoustic source localization in wireless sensor network,” Circuits, Systems, and Signal Processing, vol. 29, no. 5, pp. 837–856, 2010. [9] Q. Wang, “Packet traffic: a good data source for wireless sensor network modeling and anomaly detection,” IEEE Network, vol. 25, no. 3, pp. 15–21, 2011. [10] Z.-X. Sun, Y.-W. Tang, and Y. Cheng, “Router anomaly traffic detection based on modified-CUSUM algorithms,” Journal of Software, vol. 16, no. 12, pp. 2117–2123, 2005 (Chinese). [11] L. Zhiyuan, Z. Qiuzhi, W. Yongkun, T. Zhenyu, and H. Huaming, “Wavelet analysis-based real-time anomaly detection algorithm for wireless sensor network,” Journal of Nanjing Normal University, vol. 1, pp. 87–92, 2014 (Chinese). [12] I. C. Paschalidis and Y. Chen, “Anomaly detection in sensor networks based on large deviations of markov chain models,” in Proceedings of the 47th IEEE Conference on Decision and Control (CDC ’08), pp. 2338–2343, Cancun, Mexico, December 2008. [13] J. Tian, M. Gao, and S. Zhou, “Wireless sensor network for community intrusion detection system based on classify support vector machine,” in Proceedings of the IEEE International Conference on Information and Automation, pp. 1217–1221, Zhuhai, China, 2009. [14] J. Z. Lei and A. A. Ghorbani, “Improved competitive learning neural networks for network intrusion and fraud detection,” Neurocomputing, vol. 75, pp. 135–145, 2012. [15] S. M. Lee, D. S. Kim, J. H. Lee, and J. S. Park, “Detection of DDoS attacks using optimized traffic matrix,” Computers and Mathematics with Applications, vol. 63, no. 2, pp. 501–510, 2012. [16] F. Rongrong, Research on Key Technologies of Intrusion Detection for Wireless Sensor Network, Beijing Jiaotong University, 2013.
International Journal of
Rotating Machinery
Engineering Journal of
Hindawi Publishing Corporation http://www.hindawi.com
Volume 2014
The Scientific World Journal Hindawi Publishing Corporation http://www.hindawi.com
Volume 2014
International Journal of
Distributed Sensor Networks
Journal of
Sensors Hindawi Publishing Corporation http://www.hindawi.com
Volume 2014
Hindawi Publishing Corporation http://www.hindawi.com
Volume 2014
Hindawi Publishing Corporation http://www.hindawi.com
Volume 2014
Journal of
Control Science and Engineering
Advances in
Civil Engineering Hindawi Publishing Corporation http://www.hindawi.com
Hindawi Publishing Corporation http://www.hindawi.com
Volume 2014
Volume 2014
Submit your manuscripts at http://www.hindawi.com Journal of
Journal of
Electrical and Computer Engineering
Robotics Hindawi Publishing Corporation http://www.hindawi.com
Hindawi Publishing Corporation http://www.hindawi.com
Volume 2014
Volume 2014
VLSI Design Advances in OptoElectronics
International Journal of
Navigation and Observation Hindawi Publishing Corporation http://www.hindawi.com
Volume 2014
Hindawi Publishing Corporation http://www.hindawi.com
Hindawi Publishing Corporation http://www.hindawi.com
Chemical Engineering Hindawi Publishing Corporation http://www.hindawi.com
Volume 2014
Volume 2014
Active and Passive Electronic Components
Antennas and Propagation Hindawi Publishing Corporation http://www.hindawi.com
Aerospace Engineering
Hindawi Publishing Corporation http://www.hindawi.com
Volume 2014
Hindawi Publishing Corporation http://www.hindawi.com
Volume 2014
Volume 2014
International Journal of
International Journal of
International Journal of
Modelling & Simulation in Engineering
Volume 2014
Hindawi Publishing Corporation http://www.hindawi.com
Volume 2014
Shock and Vibration Hindawi Publishing Corporation http://www.hindawi.com
Volume 2014
Advances in
Acoustics and Vibration Hindawi Publishing Corporation http://www.hindawi.com
Volume 2014