An image processing approach to traffic anomaly detection Romain Fontugne
Toshio Hirotsu
Kensuke Fukuda
The Graduate University for Advanced Studies
Toyohashi University of Technology
National Institute of Informatics / PRESTO, JST
[email protected]
[email protected]
[email protected]
ABSTRACT
1.
This paper discusses the possibility of applying an imageprocessing technique to detecting anomalies in Internet traffic, which is different from traditional techniques of detecting anomalies. We first demonstrate that anomalous packet behavior in darknet traces often has a characteristic multiscale structure in time and space (e.g., in addresses or ports). These observed structures consist of abnormal and non random uses of particular traffic features. From the observations, we propose a new type of algorithm for detecting anomalies based on a technique of pattern recognition. The key idea underlying our algorithm is that anomalous activities appear as “lines” on temporal-spatial planes, which are easily identified by an edge-detection algorithm. Also, the application of a clustering technique to the lines obtained helps in classifying and labeling the numerous anomalies detected. The proposed algorithm was used to blindly analyze packet traffic traces collected from a trans-Pacific transit link. Furthermore, we compared the anomalies detected by our algorithm with those found by a statistical-based algorithm. Consequently, the comparison revealed that the two algorithms found mainly the same anomalies but some were of various different characteristic types.
The Internet has become one of the most important social infrastructures in our daily lives. However, many issues have simultaneously been pointed out from the view-point of network security. Improper uses of networks due to failures, misconfigurations and malicious attacks consume excessive bandwidth and deteriorate their performance. Thus these anomalies penalize legitimate applications from using optimal resources. Detecting anomalies quickly and accurately in network traffic is a hot topic in the current field of research (e.g., [2, 12, 14, 4, 17, 9, 6, 10]). It is essential to characterize network anomalies to be able to identify them. However, because anomalies in Internet traffic are widely diversified, it is difficult to generally characterize them all, and high volume makes them harder to identify. Several volume-based methods have been proposed of finding anomalies by analysing time series generated from network traffic (e.g. [2, 8]). However, as these methods give no information on the specificities of anomalies, the characteristics of anomalies are consequently identified by investigating dump files or flow records, and this can be a baffling problem. Recent work has considered information on network traffic to accurately identify anomalous traffic. For example, Lakhina et al. [12] emphasized the significant role played by traffic features (e.g. addresses or port numbers) in detecting anomalies, and they detected anomalies by analyzing the distribution of traffic features in network flows. In this paper we also point out abnormal distribution of traffic features and go further by identifying nonrandom distributions. We propose a new approach to identifying anomalies in network traffic in which the traffic is mapped on snapshots and anomalies are identified by a technique of pattern recognition. The snapshots are based on several traffic features to detect most kinds of anomalies and they are computed on different (spatial/temporal) scales. The technique of pattern recognition that is implemented allows unsupervised learning and no anomaly database is required. A further advantage of pattern recognition is its ability
Categories and Subject Descriptors C.2.3 [Computer-Communication Network]: Network Operations—Network monitoring
General Terms Measurement, Management, Security
Keywords anomaly detection, pattern recognition, Internet traffic
Permission to make digital or hard copies of all or part of this work for personal or classroom use is granted without fee provided that copies are not made or distributed for profit or commercial advantage and that copies bear this notice and the full citation on the first page. To copy otherwise, to republish, to post on servers or to redistribute to lists, requires prior specific permission and/or a fee. AINTEC’08, November 18–20, 2008, Bangkok, Thailand. Copyright 2008 ACM 978-1-60558-127-9/08/11 ...$5.00.
INTRODUCTION
to capture ambiguous and short-lived anomalies. Also, a clustering algorithm helps to label and classify the multitude of anomalies found. The approach we propose is evaluated by comparing it with a method of detection based on a non-Gaussian multi-timescale model [4]. The derived results demonstrate that numerous kinds of anomalies can be identified with the proposed approach; moreover, it can detect several short-lived and low-intensity anomalies that the statistical-based method cannot identify.
2. RELATED WORK Network traffic anomalies have been studied for many years, and several supervised and unsupervised-learning approaches have been suggested. Supervised-learning methods have mainly been represented by intrusion detection systems (IDSs) based on anomaly signatures. However, due to the constant appearance of new anomalies, unsupervised-learning approaches have also been focused on. They were first based on volume variance, identifying both short or long-lasting anomalies through local or global variances in the number of bytes. Nevertheless some sophisticated low-rate attacks [11] cannot be identified by merely analyzing the volume of traffic. For example a port-scan attack does not necessarily consume much bandwidth when it tries to access an abnormally large number of ports on a single host. In addition to volume, recent work has also considered traffic features for a closer analysis of traffic; consequently, the anomalies that have been found have been more diversified.
2.1 Signature-based approaches Currently, IDSs ([16, 15]) are the most widely tools used to notify operators about security issues. These applications analyze all transmitted packets and search for sequences of bytes known to be malicious. The key feature of IDSs is their signature database that can be referenced to identify well-known anomalies. In addition, pattern-matching techniques allow fast processing to identify malicious code from the payload. However, because IDSs are based on a signature engine, novel anomalies cannot be identified and new signatures haves to be developed for every new attack. Signatures also cannot be designed for sophisticated attacks, such as self-modifying worms, and they cannot cover the multitude of possible attacks created by malicious users. IDSs can help to protect systems from attacks they have previously experienced but they are inefficient in immediately preventing new attacks.
2.2 Statistical-based approaches The wavelet tool [1] allows a single signal to be decomposed in several signals representing different frequencies. High frequencies indicate spontaneous behav-
ior by traffic while low frequencies exhibit global behavior by traffic. Methods of detection involve finding global and local variances in wavelet coefficients to detect respective short and long-term anomalies. Wavelet methods were first used on throughput signals highlighting anomalies particularly greedy for bandwidth. However, several kinds of anomalies cannot be detected if only the number of bytes is taken into consideration. To find more diversified anomalies, Kim and Reddy [8] proposed a data structure to generate more complex signal as a function of packet information. As the analyzed signal represents changes in few traffic features, more kinds of anomalies can be identified. Unfortunately, analysis is still based on a single signal describing the whole flow of traffic; consequently, low-intensity anomalies have yet an insignificant impact on identifying anomalies in the entire traffic flow. Network traffic represents a complex multidimensional object in which wavelet provides an interesting way of breaking down time space. Despite this, another mechanism also has to be used to dissect the address space to obtain a finer grained view of traffic. Other methods based on statistical analysis have been proposed to solve the problem of detecting anomalies in network traffic. Unlike traditional wavelet methods, these methods have considered traffic features to highlight anomalies. Recent statistical-based methods have created several random aggregated traffics (or sketches) [4, 13] to dissect the whole flow. After this, the global behavior of the traffic is extracted from these sketches, and discriminating criteria based on statistical analysis highlights data with abnormal characteristics. A key feature of statistical-based methods is their accurate characterization of the behavior of global traffic to detect most anomalies. Different techniques have been proposed. For example, Lakhina et al. [12] took advantage of primary component analysis (PCA) while Dewaele et al.’s approach [4] was based on non-Gaussian procedures, where both methods computed their analyse of IP addresses and port numbers. These methods made use of a threshold on the minimum number of packets involving anomalies to avoid false positives. Indeed, statistics computed from “small” flows are not sufficiently representative and may provide unexpected results. Kim et al. proposed [10] a different approach, i.e., a Bayesian statistics based DDoS algorithm for detection, which calculated the likelihood of non-legitimate packets for each arrived packet. This approach was promising, but had a disadvantage in needing answer data for the learning process. Consequently, although statistical-based analysis allows us to identify a large variety of anomalies, those involving small traffic flows or those that are defined statistically close to global traffic behavior cannot be identified with these methods.
2.3 Image processing-based approaches Some image processing-based methods for detecting network anomalies have recently been studied. For example Kim and Reddy [9] introduced a way of summarizing packets information in a picture (or frame); thereby, many frames could be computed from network traffic constituting a movie. A scene-change algorithm was applied to it to highlight significant changes in network traffic. The main contributions of this approach were its short latency to detect anomalies and the use of image-processing techniques to detect network anomalies. However, as this technique still counted packets and used threshold to determine significant changes in network traffic, several anomalies could not be detected with this kind of counter. We propose a new approach to detecting anomalies based on pattern recognition, where anomalous traffic flows are detected through behavior-based signatures, similar to the graphical signatures introduced by Farraposo et al. [6] for classifying anomalies.
3. TEMPORAL AND SPATIAL BEHAVIOR OF ANOMALOUS TRAFFIC Here, we focus on the temporal and spatial behavior of anomalies appearing in two types of network traffic. The first is traffic data called “darknet”, which only consists of nonproductive traffic. The second is backbone traffic data extracted from a trans-Pacific link.
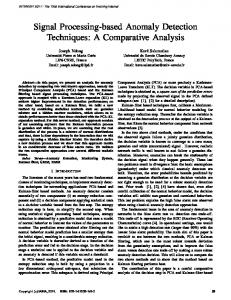
Figure 1: Scatter plot of darknet traffic: destination address (top) and source port (bottom)
3.1 Darknet data Figure 1 displays example scatter plots generated from a darknet trace taken from a /18 sub-network for a period of 24 hours in October 2006. As described by Pang et al. [14], a darknet (or background radiation) means nonproductive traffic sent to unused address space. Darknet data helps us to understand anomalous traffic and observe graphical signatures. In the upper panel of Fig. 1 the time is represented by the horizontal axis and the vertical axis stands for destination addresses. The vertical axis represents the source port number in the lower panel. Each pixel corresponds to packets, and the color indicates the intensity of arrival of the packets. In the upper panel, vertical “lines” represent exploit attacks or any processes using network scans (e.g. (e)). The horizontal “lines” indicate hosts or sub networks under heavy attack. They could be the targets of any flood attacks or misconfigurations (e.g. (d) and (f)). In the lower panel, we can observe other kinds of anomalous activities, and we obtained more information about those found in the upper scatter plot. Here, the vertical or oblique “lines” mean any procedures using an increasing number of port sources. This is the case with most operating systems when a process opens as many connections as possible. In this panel, the horizontal “lines” indicate constant and heavy traffics from
a single port, emphasizing flooding, misconfiguration, or heavy-hitters. We can observe two sets of consecutive vertical “lines” (see (a) and (b) in Fig. 1) appearing at the same time as a sudden heavy noise in the upper panel. These two behaviors can be understood as a process trying to access a maximum number of computers in a sub-network within a short duration. This is typically an exploit or worm behavior. Checking the header information, note that all these packets are directed to port 445. Windows has vulnerabilities in protocols using this port. Several worms have spread exploiting these vulnerabilities. The vertical “line” (e) behaves in the same way, but within a shorter time. Indeed, the packet information for (e) informs us about an exploit on ssh. Also, we analyzed the slanted curves (see (c) an (d) in Fig. 1) and detected attacks aimed at services sensitive to attacks. These attacks do not appear linear because of the variance in time processing or network delays (due to another activity (d) has some peaks in its source port numbers). The ports concerned are 80 for (c) and 161 for (d). These services have well known anomalies driving in a DoS or buffer overflow. The targets in (d) are aimed at a small sub-network (see (d) in the upper panel), whereas (c) is aimed at a single target that can be easily identified by zooming in on (f).
3.2 Trans-Pacific traffic data
traces taken from trans-Pacific links. The traffic traces are in pcap form without payload data, and with both addresses anonymized. Also, the time duration of all traces is fifteen minutes. Figure 2 shows graphical representations generated from ten consecutive files of the MAWI database. The total size of these ten files is about 7.6 GB, for a time length of 2.5 hours and more than 22 million packets. In the top panel, the vertical axis stands for the source port. We easily see that the traffic is much heavier than in the previous example. However, we can still distinguish several red “lines” from the whole traffic flow. Next, we zoomed in on the right (during 9:45-10:15) of the figure in detail. The middle panel was also drawn regarding the source port to obtain a finer grained time scale. The header information helps us to understand the plotted pixels. The two oblique “lines” crossing the figure (see (a) in Fig. 2) represent a SYN flood. This is an attack from a single host on several targets. The attacker floods targets on port 443 (usually used for HTTP over SSL). This method is well known and results in buffer overflow in the Private Communications Transport (PCT) protocol implementation in the Microsoft SSL library. The other slanted “lines” are the same kinds of attacks against other services and from different hosts. In particular (b) stands for a DDoS attack against a few HTTP servers. The horizontal red “lines” are anomalies consuming bandwidth such as that in DoS attacks, misconfiguration or heavy-hitters from peer-to-peer networks. The bottom panel in Fig. 2 shows the same traffic as in the middle panel, but regarding the destination port. We can observe similar “lines” to those found in the middle panel (b), and they stand for the server reactions to the DDoS attack previously observed. Also, note two kinds of “lines” repeated several times (see (c) and (d)). Both of these were DoS attacks on ACK packets from two distinct hosts against different targets.
4. Figure 2: Trans-Pacific traffic data in multiple time scales (2007/01/09) The previous figure indicated the shapes of the anomalies. However, as the input files we used only provided darknet traffic, these files did not contain any legitimate traffic. Now, let us present another example with anomalies in a large and complex traffic flow. We analyzed a traffic trace from the Measurement and Analysis on the Wide Internet (MAWI) archive [3], which is a set of traffic traces that has been collected by the WIDE Project since 1999 1 . This archive provides large-scale 1
http://mawi.wide.ad.jp/mawi/
PROPOSED ALGORITHM
Let us briefly review six goals and main issues in detecting anomalies in network traffic: (1) First, it is necessary to design an unsupervised-learning method (i.e. where anomalies are not known a priori). We could thereby avoid having to use signature-anomaly databases or other methods based on well-known anomalies, like most of the current IDSs are based on. The proposed method would have to be able to discover new and unknown anomalies through their unusual behaviors. (2) In a backbone network, a huge amount of data is constantly transmitted, meaning that all the data could be merely handled by summarizing the information. However, suspicious data only represent a small part of the whole traffic flow, and the characteristics of anoma-
lies should not be lost when information on traffic is summarized. Significant data for characterizing anomalies would have to be emphasized to enable us to proceed with accurate analysis. (3) Analyzing network traffic is a complex task due to the number of dimensions implied in network communications (e.g. addresses, ports, TCP flags, ICMP types/codes). Although many abstractions have to be done to handle such multi-dimensional objects, network traffic anomalies must still remain conspicuously identifiable. Furthermore, some networktraffic dimensions stand for large spaces where no elements can be handled individually. For example, the source and destination address space consists of 232 hosts in IPv4; therefore, a method of detection in realtime cannot thoroughly take each host into consideration individually. (4) Once an anomaly is detected in network traffic, data involved in the event also have to be retrieved to accurately characterize the anomaly (its origin, target, and period of time). (5) Further, anomalies in network traffic are particularly diversified; among other phenomena their duration and number of targets are extremely varied. For example, DoS attacks are characterized by a flash flood to a single host whereas an exploit attack tries to connect to a large range of hosts for an undetermined period of time. It is generally difficult to characterize anomalies in network traffic and similarities among anomalies have to be well defined. (6) Finally, methods involving low computational costs are required and anomalies have to be identified early before they spread.
4.1 Main idea
Figure 3: Same anomaly at different scales We propose a new approach to detecting anomalies
in network traffic using a technique of pattern recognition in images similar to the ones presented in Section 3. To provide an unsupervised-learning method, we have to consider a generic pattern allowing all kinds of anomalies to be detected in analyzed snapshots. Although the anomalous traffics discussed in Section 3 are represented by different shapes, appropriate scales allow all anomalies to be shown as (solid or dotted) “lines”. For example, Fig. 3 represents an anomaly on different scales. The time scale is small in the left panel. The anomaly is not entirely displayed, and only the local behavior of the anomaly is provided. However a large time scale allows us to draw the “line” of the right panel where the whole anomaly is represented, and the global behavior of the anomaly is presented. In both cases these “lines” represent an abnormal distribution of traffic features where dispersed distributions are depicted as vertical “lines” and concentrated distributions are represented by horizontal “lines”. For example, a network scan is represented as a vertical line in an image where the vertical axis stands for the destination address and the horizontal axis represents the time. Due to the wide variety of anomalies, we have no knowledge of the number or nature of traffic features abnormally distributed in these anomalies. In this paper, we discuss our analysis of only two dimensional images highlighting one traffic feature; consequently, an anomaly may appear in different images but always as a “line”. Combining more dimensions into an image results in detecting anomalies with higher computational complexity and, paradoxically, more graphical representations have to be considered (to detect all classes of anomalies). For example, we can identify anomalies regarding four traffic features; in 3-dimensional representations (two traffic features and the time) there is six possible ways of plotting network traffic, whereas with 2-dimensional representations (a traffic feature and the time) there are only four possibilities. The main idea underlying the new method is to find, lines representing unusual and excessive use of a traffic feature from different snapshots. Thus, the proposed technique focuses on the nature of the traffic (traffic features) instead of the volume (number of bytes). This paper has taken into consideration four traffic features (source/destination addresses and ports) to detect anomalies; however, the method can easily be applied to other traffic features. The detected lines correspond to an important or a negligible number of packets. Consequently, our method takes advantage of this asset and permits us to detect anomalies involving a small amount of data and/or a small number of packets. Since our method of detection is based on unusual traffic behaviors and it does not require an anomaly database, it is able to detect new and unknown anomalies. The new method consists of six steps: (1) Initially
adjust a sliding window to the beginning of the data. (2) Compute multi-scale snapshots for each traffic feature to be considered. (3) Identify lines in the snapshots. (4) Retrieve data on network traffic involved in the lines found and summarize these in an “event”. (5) “Events” from the same source or aimed at the same destination are grouped together to form “anomalies”. (6) Shift the sliding window and repeat steps 2 to 5. A clustering technique classifies anomalies found following their distribution of traffic features to provide understandable output.
4.2 Computation of multi-scale snapshots 4.2.1 Spatial direction We focused on four traffic features for detecting anomalies; thus, four graphical representations were used to compute the snapshots. To reduce noise in network traffic surrounding the anomalies and to facilitate their identification in the analyzed images, we split the entire network traffic into smaller sub-traffics. Indeed, if the whole network traffic could be analyzed at once, then anomalies appearing simultaneously would overlap one another and generate confusing images. We propose two general ways of dividing the entire traffic. On the one hand, the whole traffic is classified in N sub-traffics corresponding to data sent from N disjointed blocks of source addresses. On the other hand, the traffic is arranged in N sub-traffics standing for data received by N separated blocks of destination addresses. Therefore, 2 ∗ N sub-traffics are formed, and a snapshot is computed after this for each sub-traffic and each graphical representation (considered for detecting anomalies). Here, we have considered four graphical representations (from four traffic features), consequently 2 ∗ N ∗ 4 snapshots are processed for detecting anomalies in network traffic. This process helps us to generate images emphasizing different kinds of anomalies and avoids noise in network traffic. For example, Fig. 4 summarizes the process for generating images from network-traffic data from five communications between three blocks of addresses (N = 3). In this example, a network scan on the entire network can be outlined in the left lower set of images (labelled 3, 4, and 5); also, a DDoS attack from hosts over the whole network can be highlighted in the right upper set of images (labelled 1, 2, and 3).
4.2.2 Time direction Like most methods of detection, the proposed approach browses network-traffic data by using a sliding window. A common issue is to define an optimal window size to detect a sufficient number of anomalies within a short time. With traditional methods of detection, a small window is preferred to rapidly detect anomalies; however, only short-term anomalies can be
Figure 4: Image generation identified. The advantage of our method is that we use a small window to quickly detect short and long-term anomalies. Indeed, our method only detects lines, and we do not need to display the whole segment representing the anomaly; a sub-segment is sufficient to identify it. For example, Fig. 3 shows an anomaly on different temporal and spatial scales. In the left panel, the time scale is very short; therefore, the anomaly is not completely displayed but can still be identified. We thus took advantage of a short time scale to detect short and long-term anomalies as quickly as possible.
4.3 Detection : Hough transform
Original coordinate plane
Hough space
Figure 5: Hough transform with three points The basic tool we employed to find lines in snapshots was the Hough transform [7, 5]. Its two main advantages are: (1) It is able to detect solid lines as well as lines with missing parts (e.g. dotted lines). This asset is important for our purpose since anomalies do not always constantly generate traffic. (2) Furthermore, it is robust against noise, and images generated from traces contain noise due to legitimate traffic. Let us review some details of this well-known technique used in pattern recognition. The Hough transform consists of a voting procedure with an equation characterizing a shape. For each plotted point, a vote is done for all possible shapes passing through this point. All votes are recorded in a parameter space called an accumulator (or Hough space). Finally, shapes are found by identifying non-local maximum values from the Hough
space where the coordinates are the parameters values for identified shapes. In the particular case of lines, we use polar coordinates to define a line: ρ = x · cos θ + y · sin θ. For each plotted point (x1 , y1 ), votes are done for all θ and ρ solving the following equation: ρ(θ) = x1 · cos θ + y1 · sin θ. These votes stand for all lines passing through (x1 , y1 ). Once all votes are done for all points plotted in the image, lines are found by identifying maximum values in the accumulator, where the coordinates are values of parameters (ρ and θ) for the line equation. For example, in Fig. 5 the left graph plots three points in the line; the use of the Hough transform in this graph provides the line passing through these three points. The right graph in Fig. 5 plots the Hough space standing for the votes of all points; each curve represents all votes made for a single point. The intersection of the three scatter plots gives parameters values (ρ0 and θ0) defining the line binding the three given points. In our approach, we took advantage of the Hough transform to find lines (representing anomalous traffic) in images generated from network traffic. The maximum values were extracted from the Hough space using a relative threshold regarding the average value of the accumulator. Figure 6 shows an example of an image computed from darknet traffic and the corresponding Hough space. The top panel is the original image from network traffic; note the seven lines indicate the use of an increasing number of source ports during a short period of time, and there are some activities in the lower port. The middle panel is the Hough space resulting from the top image; there are numerous curves and they mainly cross at eight points. The point most highlighted (intersection of curves) represents traffic in the lower ports whereas around this point the seven other points stand for the seven lines identified in the original images. The coordinates of the highlighted intersections determine the lines and the lower panel shows the original image with the lines identified through the Hough transform.
4.4 Identification Packet-header information corresponding to lines extracted with the Hough transform should be used to identify origins, targets, and types of detected anomalies. Once a line is found, packet-header information is retrieved from all plotted points along the identified line. Such packet information is summarized into a set of statistics called an event, constituting a report on a specific identified line. Indeed, an event provides detailed information on a particular set of packets extracted from the whole traffic flow regarding its abnormal behavior. Since several lines can be drawn from a single anomaly, several events can stand for the same anomaly. Events
Figure 6: Original darknet traffic (top), Corresponding Hough space (middle), and Detected lines (bottom) with the same destination or source address are grouped together to output a single notification per anomaly. For example, assuming that the seven distinct lines from Fig. 6 (top panel) are from the same source, only one event will consequently result from these lines being detected. Once events are merged and represent more than one line, we call this an anomaly. No events standing for a single line are considered as anomalies to avoid false positives. Anomalies are reported with corresponding events information; consequently, an operator can understand the anomaly identified and act according to this. Seven kinds of reported information are: • The number of lines found for this anomaly. • The number of packets recovered for this anomaly. • The graphical representation used to identify the lines. • The source and destination addresses (IP) with corresponding percentages and timestamps of the first and last packets retrieved for each host. • The source and destination ports (TCP or UDP) with corresponding percentages. • The percentages of use for all protocols. • The entropy for each traffic feature considered in the clustering method (see 4.5).
4.5 Classification Many kinds of anomalies in network traffic can be identified with the method of detection we propose. To sort the anomalies found and to clarify the output of
the algorithm, we classified all anomalies into several labelled clusters. We implemented a simple method of clustering based on the distribution of traffic features of each anomaly that was identified. We evaluated the distribution of traffic features with the sample entropy introduced by Lakhina et al. [12]. This metric basically informed us if the distribution of traffic features was concentrated or dispersed within a given traffic flow. Many kinds of anomalies have different distributions of traffic features, and their types can be determined by the distribution of features. For example, a port scan, executed by a single host, is characterized by a concentrated distribution of address sources and a dispersed distribution of port destinations. To classify identified anomalies, we took into account the four traffic features considered for detecting anomalies; therefore anomalies were ordered in clusters following a four-dimensional vector. Each coordinate of the vector was equal to 0 or 1 depending on whether the sample entropy was lower than the average or not. Thus, we obtained 24 different vectors, each of them representing a particular cluster. Consequently, each anomaly was classified regarding its vector (i.e. its distribution of traffic features) in one of the 24 clusters representing a certain kind of anomaly. Table 1 provides a number for each cluster and labels for corresponding anomalies. Some clusters are not labelled meaning unknown anomalies. Note that the cluster numbered 15 is intended for anomalies identified with all dispersed traffic features. However, these kinds of anomalies make no sense and we deduced that this cluster corresponds to a false positive or several anomalies overlapping.
Table 1: Cluster of anomalies Anomaly label Heavy traffic, Peer to peer traffic
Addr Src
Addr Dest
Port Src
Port Dest
Cluster Number
0
0
0
0
0
Port scan on few host Flood, DoS attack Port scan on several host Network scan, Exploit, Worm Reply to a DDoS attack, Reply to a DoS attack from spoofed host Network scan, Exploit, Worm
0
0
0
1
1
0
0
1
0
2
0
0
1
1
3
0
1
0
0
4
0
1
0
1
5
0
1
1
0
6
Worm
0
1
1
1
7
DoS attack from spoofed host
1
0
0
0
8
1
0
0
1
9
1
0
1
0
10
1
0
1
1
11
1
1
0
0
12
1
1
0
1
13
1
1
1
0
14
1
1
1
1
15
Flash crowd, DDoS attack
Worm spreading Anomalies mixed, false positive
time is significantly longer for the current implementation of our method than that for the statistical-based algorithm. However, the small number of images to process the Hough transform reduces the execution time and memory use by the application. The number of anomalies detected also increases with a larger number of images (and a small address block).
5. EVALUATION
5.1
We run our algorithm on trans-Pacific traffic traces in a preliminary evaluation, and compared the results with a statistical-based algorithm [4]. Comparing the results from the two methods revealed that the new method is able to efficiently identify short and long-term anomalous traffics representing many classes of anomalies. The Hough transform allows to detect exploits, worms, and (port and address) scans through horizontal or slanted lines, while DoS attacks are represented by horizontal lines in the analyzed images. Further, the proposed approach has the ability to detect volumebased methods through their excessive use of traffic features. It also permits anomalies to be detected involving a small amount of data, which cannot be detected with other methods (due to their thresholds on the minimum number of packets to be analyzed). Furthermore, the detection delay2 with our approach is shorter and allows us to rapidly warn operators. Although, our approach is able to detect anomalies in real-time, the computation
The two methods were tested on a trans-Pacific trace trace from the MAWI project where many anomalies have been reported using the method presented by Dewaele et al. [4]. Note that the traffic data were captured in August 2004, after the Sasser worm had become widespread. A great deal of network activity has been reported concerning this worm. Although several parameters have to be specified for both methods, optimal parameters have not yet been fully evaluated for either of these two methods. To evaluate our method we tuned both approaches to approximately find the same number of anomalies. However, for few attacks, we figured out that the method based on statistical analysis reported, two anomalies though our method reported only one. Since anomalies are reported differently by both methods, we compared the results by checking whether anomalies found by one method had also been detected by the other (after ensuring that they were not false positives), and vice-versa.
2 That is the period of time between the outbreak of anomalies and their identification
5.2
Methodology
Results
Figure 7: Anomalies identified both methods, sorted by cluster numbers.
Figure 8: Anomalies identified by both methods, sorted by type of traffic.
The method proposed by Dewaele et al. [4] was executed with values of 1 for the alpha parameter and 1000 for the threshold. The method detected 630 anomalies. The method we proposed was run with a window size of 3 s and the relative threshold (for the Hough transform) was set to 100%. For a 15 minutes trace, the execution time for detection was about 10 minutes on a standard desktop PC (Core2Duo 2.6 GHz, 2 Gb of RAM). Our method identified 625 anomalies. The identified anomalies were also classified into clusters as shown in the histogram Fig. 7. Note that cluster number 6 contains a large number of anomalies due to the Sasser worm. Furthermore, we deduced that cluster 15 presented confused anomalies, viz., each occurrence in this cluster stood for a mixture of several anomalies.
in-depth investigations have to be done to estimate if they are false positive anomalies. The method proposed by Dewaele et al. [4] reported 630 anomalies classified in six groups regarding several heuristics (Fig. 8), where 165 identified anomalies were not detected by the pattern-recognition method proposed in this paper. Of these 165 anomalies 24 were labelled as OK meaning they were certainly not harmful (i.e., mostly http traffic). Also, 54 were classified as UNKNOWN and we deduced that they were heavy traffic using HTTP or peer-to-peer protocols; yet, more investigations are needed to determine if they were false positive anomalies or not. However we noticed that 149 of the 165 anomalies identified as ATTACK were also detected with the method proposed in this paper. The method proposed by Dewaele et al. [4] used a time bin of 1 min; thus, in the worst case an anomaly would be reported 1 min after it occurred. However, the pattern-recognition method proposed in this paper is able to report anomalies after the window slides, meaning every 3 s in this evaluation. Consequently, the detection delay with our method is shorter than that of the method based on statistical analysis. The new method can help operators to become rapidly aware of when anomalies appear in network traffic.
5.3 Comparison We first checked if the anomalies reported by our algorithm had also been reported by the statisticalbased method. The method based on pattern recognition identified 297 (over 625) anomalies that were not identified by the statistical-based one. The two methods are compared in the histogram in Fig. 7; most differences appears in clusters 0 and 6. We inspected all anomalies not reported by either methods and noticed that about 100 anomalies were identified in cluster 6 as true positive anomalies related to the Sasser activity. This revealed that the image processing-based approach detected twice the anomalous traffic for this class of anomaly than the statistical-based one. Several of these anomalies could not be detected with the method proposed by Dewaele et al. [4] due to the small number of packets involved. However, anomalies classified into cluster 0 and not identified by the statistical-based approach were mostly heavy traffic between two hosts using HTTP, HTTPS, or peer-to-peer protocols. More
6.
CONCLUSION AND FUTURE WORK
We first highlighted the need for identifying anomalies in this paper, and understanding network traffic behavior on all temporal and spatial scales. We demonstrated that anomalous traffic has characteristic shapes in time and space. A darknet trace exhibited several spatial-temporal patterns for different anomalies in a snapshot, and a trace taken from a trans-Pacific backbone had anomalies, in heavy traffic, that were still highlighted. These structures represented particular
distributions of traffic features, and should be a good medium for detecting anomalies in network traffic. The main contribution of this paper was to propose a new approach to detecting traffic anomalies based on pattern recognition. We took advantage of graphical representations to break down the dimensions of network traffic. Indeed, image analysis provided us with powerful tools to reduce the complexity of network traffic and extract relevant data. Thus, we mapped network traffic data to snapshots rather than traditional time series, and we identified unusual distributions in the traffic features through simple patterns (lines). This technique was implemented and its efficiency was demonstrated by comparing it with a recent method based on statistical analysis. A variety of network traffic anomalies were detected by using our new method and we applied a clustering technique to classify them. Furthermore, pattern-recognition presents interesting advantages in its short detection delays, and its capabilities in identifying anomalies involving a small number of packets. Consequently, our evaluation revealed that the kinds of anomalies detected with the pattern recognition-based method are slightly different than the ones found with the statistical-based approach. However, a limitation in detecting anomalies was observed, and was not specific to our approach. Since the imagebased technique proposed in this paper does not take payload into consideration and has no port/host specific information, it detects all heavy traffic as anomalous; therefore, dense http, ftp, or p2p traffics were reported. One important future project is to add the capability of processing raw packets directly taken from a network interface. Also, the current tool only takes packets into account, but it would be better to emphasizes connections to represent the concept of flows. In addition, other graphical representations have to be studied to detect network anomalies. Further, more evaluations have to be done; thus a closer inspection of obtained results can lead to better tuning of the technique.
Acknowledgments We wish to thank Guillaume Dewaele for providing us with the software for detecting anomalies he previously proposed [4]. This work was partially supported by a Grant-in-Aid for Scientific Research on Priority Areas (Info-plosion) by the Ministry of Education, Culture, Sports, Science, and Technology (MEXT) of Japan.
7. REFERENCES [1] P. Abry and D. Veitch. Wavelet analysis of long-range-dependent traffic. IEEE Transactions on Information Theory, 44(1):2–15, 1998. [2] P. Barford, J. Kline, D. Plonka, and A. Ron. A signal analysis of network traffic anomalies. IMW ’02, pages 71–82, 2002.
[3] K. Cho, K. Mitsuya, and A. Kato. Traffic data repository at the WIDE project. In USENIX 2000 Annual Technical Conference: FREENIX Track, pages 263–270, June 2000. [4] G. Dewaele, K. Fukuda, P. Borgnat, P. Abry, and K. Cho. Extracting hidden anomalies using sketch and non gaussian multiresolution statistical detection procedures. LSAD ’07, pages 145–152, 2007. [5] R. O. Duda and P. E. Hart. Use of the hough transformation to detect lines and curves in pictures. Commun. ACM, 15(1):11–15, 1972. [6] S. Farraposo, P. Owezarski, and E. Monteiro. Nada - network anomaly detection algorithm. DSOM ’07, 4785:191–194, 2007. [7] P. Hough. Method and means for recognizing complex patterns. U.S. Patent 3,069,654, 1962. [8] S. S. Kim and A. L. N. Reddy. Detecting traffic anomalies at the source through aggregate analysis of packet header data. Proc. of Networking 2004, pages 1047–1059, 2004. [9] S. S. Kim and A. L. N. Reddy. A study of analyzing network traffic as images in real-time. INFOCOM ’05, pages 2056–2067, 2005. [10] Y. Kim, W. C. Lau, M. C. Chuah, and H. J. Chao. Packetscore: A statics-based packet filtering scheme against distributed denial-of-service attacks. IEEE Trans. on Dependable and Secure Computing, 3(2):141–155, 2006. [11] A. Kuzmanovic and E. W. Knightly. Low-rate tcp-targeted denial of service attacks: the shrew vs. the mice and elephants. SIGCOMM ’03, pages 75–86, 2003. [12] A. Lakhina, M. Crovella, and C. Diot. Mining anomalies using traffic feature distributions. SIGCOMM ’05, pages 217–228, 2005. [13] X. Li, F. Bian, M. Crovella, C. Diot, R. Govindan, G. Iannaccone, and A. Lakhina. Detection and identification of network anomalies using sketch subspaces. SIGCOMM ’06, pages 147–152, 2006. [14] R. Pang, V. Yegneswaran, P. Barford, V. Paxson, and L. Peterson. Characteristics of internet background radiation. IMC ’04, pages 27–40, 2004. [15] V. Paxson. Bro: a system for detecting network intruders in real-time. Computer Networks, 31(23–24):2435–2463, 1999. [16] M. Roesch. Snort - lightweight intrusion detection for networks. LISA ’99: Proceedings of the 13th USENIX conference on System administration, pages 229–238, 1999. [17] Y. Zhang, Z. Ge, A. Greenberg, and M. Roughan. Network anomography. IMC ’05, pages 1–14, 2005.