Overall FYI MYI OW Overall FYI MYI OW Overall FYI MYI OW Overall FYI MYI OW. Accuracy 90.18 78.64 87.63 94.10 89.89 86.35 82.44 92.29 81.74 89.1 69.21 ...
An improved sea ice freeboard retrieval algorithm for Cryosat-2 data Xi Zhang, First Institute of Oceanography, SOA, China Wolfgang Dierking, Alfred Wegener Institute, Germany Markku Similä, Finnish Meteorological Institute, Finland
Outline I. Introduction II. Sea ice type classification III. Waveform retracking for ice freeboard retrieval IV. Validation V. Conclusions and next planning
I. Introduction Using new generation altimeters (CryoSAT-2 and Sentinel-3) to improve sea ice thickness retrieval accuracy is a important task in our project.
hsi =
hs ρ s + h fb ρ sw
ρ sw − ρ si
Two-stage design for ice thickness retrieval: Phase I: sea ice freeboard detection. Phase II: sea ice thickness detection.
Ice freeboard: ice-water discrimination, waveform retracking to get surface elevation. Sea ice density: sea ice types classification.
II. Sea ice types classification We compare a variety of machine-learning classification techniques, and aim to find the optimal classifier-features combination to improve the accuracy of sea ice classification. Features PP
Definition
Classifiers
256
PP = Pmax / ∑ Pi i =1
Bayesian
LeW
The distance between 1% and 99% of the maximum power (rising edge)
K nearest-neighbor
TeW
The distance between the 99% and 1% of the maximum power (falling edge)
Support vector machine
MAX
Maximum power value of the echo waveform
Random forest
SSD
The standard deviation of power values
Sigma0
Radar backscatter coefficient
Back propagation neural network Convolutional neural network
Cryosat-2 Data Area: Arctic Data set: Cryosat-2 L1b Time coverage: 03/2015 + 11/2015 + 03/2016 Mode: SAR mode
Validation data Data set: ice charts published by the Arctic and Antarctic Research Institute (AARI) Source: satellite and reports from coastal stations and ships Process: 2 km grid in north polar stereographic projection
Use 15,000,000 training samples (altimeter surface points), and execute100 times test to find the best classifier and its corresponding best features. Joint feature and classifier selection algorithm Initialization: f ∈ F, F = {f1, f2, f3, f4, f5, f6}, c ∈ C, C = { C1, C2, C3, C4, C5, C6}, Fi = {Ф}, i = 0 Iteration: 1. Select the best new feature: f+ = arg max f∉Fi Ψ (Fi + f, s, c) Fi = Fi + f+, si = s, ci = c, i = i+1 2. Select the worst existing feature: f- = arg max f∈Fi Ψ (Fi − f, si, ci) 3. Conditional judgmental: if Ψ (Fi, si, ci) < Ψ (Fi − f-, si, ci) then Fi + 1 = Fi − f-, si + 1 = si, ci + 1 = ci, i = i + 1, go to Step 2 else go to Step 1 end if
Optimal classifier: Bayesian
Feature importance: LeW, SSD, TeW , PP, Sigma0, MAX Feature
Rank
CNN
KNN
RF
Bayesian
SVM
BPNN
LeW SSD TeW PP Sigma0 MAX
1 2 3 4 5 6
1.00 0.50 0.00 0.33 0.48 0.47
0.88 0.03 1.00 0.00 0.06 0.27
1.00 0.03 0.05 0.00 0.08 0.03
0.00 0.25 0.31 1.00 0.81 0.49
0.49 1.00 0.02 0.00 0.09 0.04
1.00 0.46 0.47 0.64 0.00 0.04
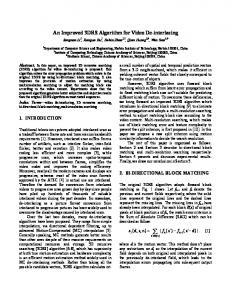
The top-4 classifier-features combinations ① Bayesian & (LeW + SSD + TeW + PP) ② Bayesian & (MAX+ TeW)
③ RF & (LeW + SSD + TeW + PP + MAX + Sigma0) ④ KNN & (LeW + SSD + TeW + PP ) Combination ① ice-water Overall Accuracy 90.18 STD
0.032
Combination ② ice-types
FYI
MYI
OW Overall
78.64
87.63
94.10
0.07
0.06
0.05
Classification result
AARI ice charts
Combination ③
Combination ④
FYI
MYI
OW Overall
FYI
MYI
OW Overall
FYI
MYI
OW
89.89
86.35
82.44
92.29
81.74
89.1
69.21
87.35
79.1
89.35
65.63
87.62
0.05
0.07
0.065
0.06
0.045
0.08
0.05
0.09
0.047
0.045
0.08
0.07
III. Waveform retracking for ice freeboard retrieval Sea ice: OGOC is a rapid and robust method and has shown a good performance. Open water/lead: Gauss fitting are the most common retracking methods. Problem: Gauss fitting need to calculate the statistical parameters and cannot always fit waveform well especially when altimeter footprint cover a small fraction of lead.
Source: Yi D, et al., 2013.
Bezier curve fitting Bezier curve fitting can directly estimates the unknown curve accurately and effectively without assuming any statistical models. Bezier curve fitting can fit very complex curve, and has better fitting performance than Gauss fitting.
Control points distribution strategy a) exponential distribution ([0,1/16,1/8,1/4,1/2,1]); b) uniform distribution ([0, 1/5, 2/5, 3/5, 4/5, 1]); c) a double sampling density to (b); d) 4 control points: the 5% of the rising and falling edge; before and after max power (best performance, less control points and computing time).
Sea ice freeboard retrieval Sea ice/Lead/Ocean: Discrimination by waveform classification. Mean SSH: mean sea surface height, source: UCL04 model. SSA: sea surface anomaly, the interpolation of the difference between lead elevations and mean SSH. Radar ice freeboard: sea ice elevation-mean SSH-SSA.
IV. Validation Study area: Arctic Test data: Cryosat-2 L1b Time coverage: 03/2015 (SAR mode) + 04/2016 (SAR mode) Validation data: IceBridge ice freeboard data (Airborne Topographic Mapper)
Cryosat-2 tracks
Icebridge tracks
Compared with Cryosat-2 L2I product Proposed method: mean bias is 1.33 cm compared with IceBridge freeboard data.
March 2015 Method Mean difference RMS difference
April 2016
Proposed
Production
Proposed
Production
1.57cm
1.75cm
1.09cm
1.84cm
10.7cm
10.5cm
11.5cm
12.7cm
Retrieval freeboard/cm
Cryosat-2 L2I product: mean bias is 1.79 cm compared with IceBridge freeboard data.
IceBridge freeboard/cm
Error analysis
Retrieved freeboard is higher than IceBridge freeboard. Retrieved freeboard shows more uniformly distributed. Retrieved freeboard have similar distributions with IceBridge data in April 2016.
V. Conclusions and next planning The optimal classifier-feature combinations for ice type classification, and the overall accuracy reaches to 90%. The accuracy of proposed sea ice freeboard retrieval algorithm is 1.33 cm compared with IceBridge freeboard data. Collection more in-situ data to valid proposed method. Study sea ice thickness retrieval algorithm based on retrieved ice-freeboard result.
Thanks for your attention!
Retracking threshold Retracking threshold directly connects to the performance of elevation extraction. Different thresholds (50%, 70%, 90%) have been compared to decide the optimal threshold for retracker. We set the threshold at 70% of peak as it is more accurate than others when compared to IceBridge data. March 2015 Thresholds
Radar freeboard
50%
29.31 cm
70%
22.07 cm
90%
14.68 cm
IceBridge freeboard
April 2016 Radar freeboard
IceBridge freeboard
34.77 cm 20.5 cm
27.19 cm 19.43 cm
26.1 cm