Fuyuan et.al. [18] has presented a method for initializing K- ... J.F Lu et.Al. has proposed a hierarchical initialization approach for the K-means [22]. The proposed ...
International Journal of Computer Applications (0975 – 8887) Volume 25– No.1, July 2011
An Initialization Method for the K-means Algorithm using RNN and Coupling Degree Alaa H. Ahmed Faculty of Engineering Islamic university of Gaza Gaza Strip, Palestine
ABSTRACT Since K-means is widely used for general clustering, its performance is a critical point. This performance depends highly on initial cluster centers since it may converge to numerous local minima. In this paper a proposed initialization method to select initial cluster centers for K-means clustering is proposed. This algorithm is based on reverse nearest neighbor (RNN) search and coupling degree. Reverse nearest neighbor search retrieves all points in a given data set whose nearest neighbor is a given query point, where coupling degree between neighborhoods of nodes is defined based on the neighborhood-based rough set model as the amount of similarity between objects. The initial cluster centers computed using this methodology are found to be very close to the desired cluster centers for iterative clustering algorithms. The application of the proposed algorithm to K-means clustering algorithm is demonstrated. An experiment is carried out on several popular datasets and the results show the advantages of the proposed method.
General Terms Artificial intelligence, Data clustering, partitioning methods, Kmeans Initialization methods
Keywords Clustering, reverse nearest neighbor search, coupling degree, Kmeans, initialization
1. INTRODUCTION Machine learning is a subfield of artificial intelligence that is concerned with the design, analysis, implementation, and applications of programs that learn from experience. Machine learning is classified as supervised learning or unsupervised learning. In the former the set of training data is available, and a classification algorithm is designed by exploiting this a priori known information to classify the data points into pre-defined classes. In the latter, there is no a priori knowledge about the classes of the data points [1]. Data clustering is an unsupervised classification method aims at creating groups of objects, or clusters, in such a way that objects in the same cluster are very similar and objects in different clusters are quite distinct [2]. Cluster analysis has been widely used in numerous applications, including market research, pattern recognition, data analysis, and image processing. In business, clustering can help marketers discover interests of their customers based on purchasing patterns and characterize groups of the customers. In biology, it can be
Wesam Ashour Faculty of Engineering Islamic university of Gaza Gaza Strip, Palestine
used to derive plant and animal taxonomies, categorize genes with similar functionality, and gain insight into structures inherent in populations. In geology, specialist can employ clustering to identify areas of similar lands; similar houses in a city and etc. data clustering can also be helpful in classifying documents on the Web for information discovery [3]. In the literature, many clustering algorithms have been proposed. These algorithms differ from each other by the criteria considered which lead to different categories of clustering algorithms. Although it is difficult to find strict categorization of the clustering algorithms because the categories may overlap, the following categorization is helpful to discriminate the clustering algorithms [3]: Partitioning methods: A partitioning method creates K partitions (or clusters) such that K ≤ n where n is the total number of objects. It creates an initial portioning and then iteratively moves the objects from one cluster to another to improve the partitioning. Good clustering is that the similarity between objects in the same cluster is high whereas the dissimilarity between objects in the different clusters is high. The K-means algorithm is a commonly used partitioning method [4]. Hierarchical methods: A hierarchical method creates a hierarchal structure of the data objects. Then a given number K of clusters determines how to cut the hierarchy. It can be either agglomerative or divisive. AGNES and DIANA [5] are examples of hierarchical clustering. BIRCH [6] integrates hierarchical clustering with iterative (distance-based) relocation. Density-based methods: The idea behind these methods is to group dense objects into clusters. An object is dense if its neighborhood if a given clusters contains at least minimum number of objects. DBSCAN [7] and OPTICS [8] are typical examples of density-based clustering. Grid-based methods: These methods divide the object space into a finite number of cells that form a grid structure. Therewith connected cells are grouped in a cluster. STING [9] is an example of grid-based clustering. Some techniques such as CLIQUE [10] combine both density-based and grid-based approaches. Model-based methods: This approach creates a mathematical model for each of the clusters and finds the best fit of the data to the given model. A main advantage is that these methods automatically determine the number of clusters based on standard statistics. COBWEB [11] and self-organizing feature maps [12] are examples of model-based clustering.
1
International Journal of Computer Applications (0975 – 8887) Volume 25– No.1, July 2011 The K-means clustering algorithm [13], developed three decades ago, is one of the best-known and most popular clustering algorithms used in a variety of domains. Despite being used in a wide array of applications, the K-means algorithm is not exempt from drawbacks. Some of these drawbacks have been extensively reported in some literatures. The most important are listed below [14]: 1. As many clustering methods, the K-means algorithm assumes that the number of clusters K is already known by the users, which, unfortunately, usually is not true in practice. 2. As an iterative technique, the K-means algorithm is especially sensitive to initial cluster centers. 3. The K-means algorithm converges to local minima. K-means is defined over continuous data which calculates its centers iteratively [15]. It starts with initial K cluster centroids (means), then it assigns each data point to the nearest centroid, updates the cluster centroids, and repeats the process until the K centroids do not change. Although there is no guarantee of achieving global minima, at least the convergence of the K-means algorithm is ensured [16]. Therefore, how to choose proper initial cluster centers becomes very important for the K-means algorithm. The greedy essence makes K-means algorithm not converge to the global optimum and its performance strongly depends on the initial guess of partition. K-means does not guarantee unique clustering if the initial clusters are randomly chosen. Researchers find it difficult to rely on the results thus obtained. The K-means algorithm gives better results only when the initial partitions are close to the final solution [17]. Several attempts have been made to solve the cluster initialization problem. The outline of the rest of this paper is as follows. Related work section, state of the art initialization methods are introduced using modern techniques. Proposed algorithm section includes description of RNN and coupling degree, and then it explains the details of proposed method for K-means initialization. The influence of the three norms on clustering is analyzed and the clustering results of initialization algorithm with the three different initialization methods are compared in experiment and analysis section. Then the conclusion is the last section.
2. RELATED WORK Several attempts have been reported to solve the cluster initialization problem. Fuyuan et.al. [18] has presented a method for initializing Kmeans. Based on Rough set Concepts [19] and neighborhood of objects, the method defines the cohesion degree of the neighborhood of an object and the coupling degree between neighborhoods of objects. Then the highest cohesion degree object is selected as the first center. After that, the coupling degree between the first center and the next highest degree object is computed and compared; if the coupling degree is less than some �, the next highest degree object is selected as the new center. Then the steps are repeated till selecting k centers where k is the predefined number of clusters. The algorithm shows acceptable clustering accuracy.
Khan and Ahmad [20] have presented an algorithm (CCIA) for computing initial cluster centers for iterative clustering algorithm. CCIA procedure is based on the experimental fact that very similar data points form the core of clusters and their cluster membership remain the same. Hence these similar data points aid in finding initial cluster centers. Also, CCIA depends on the observation that individual attribute provides information in computing initial cluster centers. CCIA assumes that each of the attributes of the data points is normally distributed. For K clusters the normal curve is divided into K partitions such that the area under these partitions is equal. Then the midpoint of each interval is computed. The attribute values corresponding to these midpoints are computed using mean and standard deviation of the attribute. This will serve as seed point for the K-means clustering for this attribute. This process generates a sequence of m cluster labels. The process is repeated for all the attributes which generates K sequences that correspond to K clusters. If K is equal to K, then centers of these K clusters should be treated as the initial cluster centers for the K-means algorithm. If K is greater than the number of desired clusters K , similar clusters are merged to get K clusters and centers of these K clusters will become initial cluster centers for the K-means algorithm. XU Junling et. Al. have presented an initialization method for Kmeans clustering based on reverse nearest neighbor (RNN) and reverse farthest neighbor (RFN) [21]. RNN search retrieves all points in a given data set whose nearest neighbor is a given query point, XU Junling et. al. initialization method (IRNN) first initialize a candidate set (CS) with all data points, compute the RNNs of each point in CS, and ranks points according to the number of their RNNs in a descending order; then it selects the first point of the ranked list as a center candidate, and cascadingly delete the selected point and its RNNs from the list. If the list is not empty, the process of selection and deletion is repeated. After each iteration, the method lets CS to be the set of selected points and repeats the above process until elements of CS is less than some given number U. Finally, K centers are selected according to RFN criteria where these K centers are mostly far from each other. J.F Lu et.Al. has proposed a hierarchical initialization approach for the K-means [22]. The proposed algorithm consist of four main steps which are preprocessing step , bottom up step , topdown step and finally post processing. The purpose of preprocessing phase is to transform the data into the form that is required by the algorithm itself. The bottom –up and top-down phases are the core of the algorithm carrying out both sampling and clustering. The post processing phase reverses the preprocessing operation by inversing coordinate transformation to obtain the cluster centers in the original data. In the sampling phase the preprocessed data is sampled level by level by repetitively applying a sampling method till the re-sampled data amount is the minimal number that is greater than or equal to 20 * number of clusters K. At the level that the sampling ends iterative clustering is executed to get the cluster centers. For the choice of initial centers, data is sorted by weight value, and then the first K biggest instances are selected as initial cluster centers for the iteration.
3. PROPOSED ALGORITHM In this section, we first introduce the concept of reverse nearest neighbor search and coupling degree, and then explain the basic idea of our stable initialization approach.
2
International Journal of Computer Applications (0975 – 8887) Volume 25– No.1, July 2011
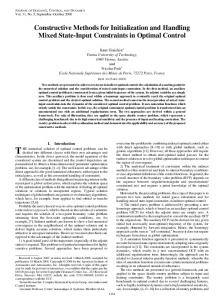
3.1 Reverse Nearest Neighbor Search Nearest neighbor (NN) search, also known as proximity search, similarity search or closest point search is an optimization problem for finding closest points in metric spaces [23]. The problem is: given a set S of points in metric space M and a query point q � M, find the closest point in S to q. In many cases, M is taken to be d-dimensional euclidean space and distance is measured by Euclidean distance or Manhattan distance. Accordingly, a reverse nearest neighbor (RNN) search retrieves all points in a given data set whose nearest neighbor is a given query point [24]. Figure 1 shows the data set that consists of 4 points p1, p2, p3 and p4. Assuming that the similarity between two points corresponds to their Euclidean distance, the RNN of query q (the black dot) returns p1 and p2. In particular, p1 (similarly, p2) is a result because q is its NN. p1 is closer to q than to any other objects in the data set. It is important to note that the NN of q (i.e., p3) is not necessarily the RNN of q (the NN of p3 is p4, instead of q).
2
./
.�
.� .�
Coupling (N(�� ), N(� )) = Where
&�'�() �*'"(+ #&
&�'�() �,'"(+ #&
(Eqn.3)
0- Coupling (N(�� ), N(� )) -1
3.3 RNN and Coupling initialization Method
Degree
based
Our proposed method depends on both reverse nearest method and coupling degree. It mainly composed of two main phases. Our method deals with three main sets candidate set (CS), representative set (RS) and centroids set. Phase1: Our method first initializes candidate set (CS) with all data points of the data set. Then it starts procedure of selecting representative points. In this procedure it iterate on each point in candidate set and get RNN points of each point of CS. After that it count the number of RNN points of each point and store these values in RNN list. After that it selects the point with maximum value in RNN list. This point is added to representative set (RS). Finally that selected point is deleted with all its RNN points. This procedure of selecting representative point iterates until the maximum value of RNN list equals one. Phase2: This phase includes selecting of final centroids based of K number of centroids specified for K-means. These centroids will be the initial centroids or prototypes for K-means to start with.
0
Fig.1 RNN Definition
of objects neighbor to both �� and � divided on neighbors of �� and neighbor of � .
1
3.2 Neighborhood theory and coupling degree:
Let D be a dataset of n objects �� , �� � �� � � � � . the neighborhood of an object �� is the set of objects N(�� ) where : • N(�� ) = {any � : d(�� � � ) < , � � ��� �� � � } • d(�� �� � ) is the distance between objects �� and �
The second phase use the representative set calculated on the first phase. It first calculates based on equation 2. Then it calculates coupling degree between each two points of representative set based on equation 3. After that it initializes centroid set as empty set. Then it starts centroids procedure which iterates until centroids set contains K centroids. This procedure first selects the point with maximum number of neighbors based on and coupling degree. Then it retrieves all its neighbors. The mean point of that point with maximum number of neighbors and its entire neighbors is calculated. Then this mean point is added to centroid set. Finally the selected point with maximum number of neighbors and all its neighbors are removed from representative set.
4. EXPERIMENTS AND ANALYSIS � d(�� �� � ) = ��� �������� � � � � ��� ��������������� ��
• is the average distance between all objects ε ��
�
� ��
� ���� � ��$� !"�� �� � # �������������� %�
The coupling degree measures the similarity between two objects [18]. The greater coupling degree between two objects the more similar. So if two objects are candidate to be a cluster center. We can ignore one of them if the coupling degree between them is high because there is high probability to be in the same cluster. Let D be a dataset of n objects �� , �� � �� � � � � �the coupling degree between neighborhood of objects �� and � �is the number
In this section, experiment environments and an evaluation method [25] are introduced. Some standard data sets are downloaded. We compare the clustering results of the K-means algorithm with the three different initialization methods, which are the proposed method, neighborhood method [18] and RNN Based Method [21], respectively.
4.1 Experimental environments and evaluation method The experiments are conducted on a PC with an Intel Pentium 4 core 2 due processor (2.4 GHz) and 4G byte of memory running the Windows XP SP3 operating system. The K-means algorithms with the three different initialization methods are coded in MATLAB 7.10 programming language.
3
International Journal of Computer Applications (0975 – 8887) Volume 25– No.1, July 2011 To evaluate the efficiency of clustering algorithms, five evaluation indices accuracy (AC), precision (PR), recall (RE), number of K-means iteration before convergence and execution time are employed in the following experiments. In order to define the first three kinds of evaluation indexes, the following quantities are needed. k - The number of classes of the data, which is known; 3� �- The number of objects that are correctly assigned to the class�4� � (1< i < k);
5� �- The number of objects that are incorrectly assigned to the class4� ;
6� �- The number of objects that should be in, but are not correctly assigned to the class Ci; The accuracy, precision and recall are defined as 74 � � :; � �
����� 3� �������������������� 9� &8&
3� � < � 5� ��������������� >� =
����� 3
Proposed Algorithm
;� � �
�����
3� 3 � < � 6� �������������� >� =
The convergence iteration of K-means indicates the accuracy of the initialization method. Low number of iteration indicates faster convergence and accurate initial centroids selection. Execution time (exec. time) measure the performance of the algorithm. Low execution time means that the algorithm performs faster.
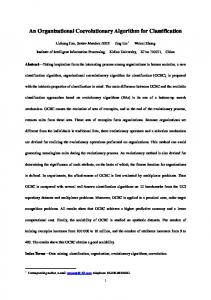
4.2 Evaluation on clustering effectiveness To compare initialization method four data sets are used; two real datasets and two artificial dataset. The two real datasets are Iris and Wine [26]. Table 1 shows the characteristics of each dataset. Figure 2 and 3 show artificial data set with different number of clusters K=4 and K=3. Table 1. Characteristics of Datasets Data Set Artificial 1 Artificial 2 IRIS WINE
Num. of Features 2 2 4 13
Num. Of Instances 118 1572 150 178
Num. of Clusters 3 4 3 3
1. Initialize the candidate set CS with all data points 2. Initialize Representative set RS as empty set 3. Compute the RNNs for each point based on RNN search 4. Count the number of RNNs for each point in CS and store the result in RNN list; While (Max [RNN List] >1) { 5. Add the point with Maximum counted RNNs value of RNN list to RS .
Fig2. Artificial Data set where K=3
6. Delete the added point and all its RNNs from CS. 7. Recalculate RNNs for all points remain in CS } 8. Calculate ? based on eqn.2 for all points in RS 9. Calculate CD based on eqn.3 for all Points in RS 10. Initialize Centroids set as empty set. While |Centroids|< K {
Fig3. Artificial Data set where K=4
4
International Journal of Computer Applications (0975 – 8887) Volume 25– No.1, July 2011
Table 2. Comparison results of three initialization method on artificial dataset with k=3
AC PR RE Conv. Iteration Exec. Time(sec)
Neighborhood Method 1 1 1 6
RNN Method 0.96 0.963 0.96 12
Proposed Method 1 1 1 2
5.5018
27.6701
2.1347
Table 3. Comparison results of three initialization method on artificial dataset with k=4 Neighborhood RNN Method Proposed Method Method AC 0.866 0.857 1 PR 0.867 0.861 1 RE 0.866 0.861 1 Conv. 17 42 2 iteration Exec. 63.0535 852.4841 21.3121 Time(sec) Table 4. Comparison results of three initialization method on Iris data set Neighborhood RNN Proposed Method Method Method AC 0.8867 0.9 0.9 PR 0.8868 0.9 0.9 RE 0.8867 0.9024 0.9024 Convergence 7 25 2 iteration Exec. Time(sec) 1.01634 2.50261 0.17058 Table 5. Comparison results of three initialization method on Wine data set Neighborhood RNN Proposed Method Method Method AC 0.7653 0.7653 0.7303 PR 0.767 0.767 0.733 RE 0.767 0.7655 0.732 Convergence 9 55 6 iteration Exec. Time(sec) 7.4822 97.4255 2.5325 Table1 illustrates the main characteristics for data sets. As shown in table1 we have two artificial data sets and two real data sets. The first artificial data set contain of 118 data points with two features and is clustered into 3 clusters as shown in Figure 2. Where the second artificial data set contains 1572 data points with two features these data points clustered into 4 clusters as shown in Figure3. Iris data set has often been used as a standard for testing clustering algorithms. This data set has three classes that represent three different varieties of Iris flowers namely Iris setosa, Iris versicolor and Iris virginica. Fifty objects are obtained from each of the three classes, thus a total of 150 objects is available. Every
object is described by four attributes, viz sepallength, sepal width, petal length and petal width. This data set is the result of a chemical analysis of wines grown in the same region in Italy but derived from three different cultivars. The analysis determined the quantities of 13 constituents found in each of the three types of wines. There are overall 178 objects. There are 59, 71, 48 objects in class I, class II and class III respectively.
4.3 Results and analysis Table 2 illustrates results for three methods on artificial dataset 1 which is shown in Figure2. Results indicate that accuracy, precision and recall values of three methods are very close. But the number of K-means iteration and execution time of proposed method outperform corresponding values for other RNN method and neighborhood method. Results listed on tables 3 which illustrate experiments results of three mentioned methods on artificial dataset 1 shown in Figure 3 with 1572 data points. These results show that the accuracy, precision and recall values of proposed method outperform neighborhood method and RNN method. Number of iteration and execution time of proposed method are much less than other two methods which indicated that proposed method perform faster and K-means algorithm converge faster. Table 4 and Table 5 show results for three methods on real dataset Iris and Wine. As shown on these two tables accuracy, precision and recall are very close. Convergence iteration and execution time are less than other two methods. It indicates that K-means with proposed method converge faster than other two methods and the whole execution time to find real initial centroid is minimized.
5. CONCLUSION AND FUTURE WORK K-means algorithm is widely discussed and applied; however, the K-means algorithm suffers from initial starting condition effects. As a new and stable initial selection method, our proposed method has been successfully applied. In this paper, a new initialization method has been proposed based on reverse nearest neighbor and coupling degree based on the neighborhood-based rough set model. We study the influence of the four norms on clustering, and compare the proposed initialization method with the other two initialization methods. The experimental results illustrate the effectiveness of the proposed method where the number of convergence iteration and execution time are largely minimized related to other two methods with the same accuracy, precision and recall value. We will work on this method to help us to specify the initial number of clusters based on filtering techniques used to decrease number of representative point and selecting real centroid. By this future work we may offer a real solution for “specifying number of cluster previously” problem which is considered as another main problem of K-means.
6. REFERENCES [1] S. Theodoridis and k. Koutroumbaspattern, 2003. Pattern Recognition, 2nd edition, Elsevier. [2] G. Gan et. Al. 2007 Data Clustering Theory, Algorithms, and Applications, Siam.
5
International Journal of Computer Applications (0975 – 8887) Volume 25– No.1, July 2011 [3] J. Han and M. Kamber. 2006 Data Mining: Concepts and Techniques, 2nd edition, Elsevier.
[15] Fukunaga K. 1990 Introduction to Statistical Pattern Recognition [M]. San Diego: Academic Press.
[4] J. MacQueen 1967 "Some methods for classification and analysis of multivariate observation". In: Berkeley Symposium on Mathematical Statistics and Probability. University of California Press, pp. 281–297.
[16] S.Z. Selim, M.A. Ismail 1984 K-means-type algorithms: a generalized convergence theorem and characterization of local optimality, IIEEE Transactions on Pattern Analysis and Machine Intelligence 6 8187.
[5] L. Kaufman and P. Rousseeuw. 1990 Finding Groups in Data: An Introduction to Cluster Analysis. Wiley, New York.
[17] Jain A K, Dubes R C. 1988 Algorithms for Clustering Data[M]. Englewood Cliffs: Prentice Hall.
[6] T. Zhang et. al. 1996 "BIRCH: An efficient data clustering method for very large databases". In Proceedings of the 1996 ACM SIGMOD international conference on management of data, pp. 103–114. New York: ACM Press.
[18] F. Caoa et. al. 2009 "An initialization method for the Kmeans algorithm using neighborhood model", Computers and Mathematics with Applications, vol. 58, pp. 474 – 483.
[7] M. Ester et. al. 1996 "A density-based algorithm for discovering clusters in large spatial databases with noise," In Second international conference on knowledge discovery and data mining", pp. 226–231. Portland, OR: AAAI Press. [8] M. Ankerst et. Al. 1999 "OPTICS: Ordering points to identify the clustering structure," In Proc. 1999 ACM-SIGMOD Int. Conf.Management of Data(SIGMOD’99), pp. 49–60, Philadelphia.
[19] Z. Pawlak, 1991 "Rough Sets-Theoretical Aspects of Reasoning about Data", Kluwer Academic Publishers, Dordrecht, Boston, London. [20] S. Khan and A. Ahmad, 2004 "Cluster center initialization algorithm for K-means clustering," Pattern Recognition Letters, vol. 25, pp. 1293–1302,. [21] X. Junling et. al, 2009 "Stable Initialization Scheme for Kmeans Clustering," Wuhan University Journal Of Natural Sciences, vol.14, no.1.
[9] W. Wang et. al, 1997 "STING: A statistical information grid approach to spatial data mining," In Twenty-third international conference on very large data bases, pp. 186– 195.
[22] J. Lu. et. al, 2008 "Hierarchical initialization approach for Kmeans clustering," Pattern Recognition Letters, vol. 29, pp. 787–795.
[10] R. Agrawal et. Al. 1998 "Automatic subspace clustering of high dimensional data for data mining applications," In SIGMOD Record ACM Special Interest Group on Management of Data, pp. 94–105. New York: ACM Press.
[23] Ken C.K. Lee, Baihua Zheng and Wang-Chien Lee 2008 "Ranked Reverse Nearest Neighbor Search" , IEEE TRANSACTIONS ON KNOWLEDGE AND DATA ENGINEERING, VOL. 20, NO. 7, JULY.
[11] D. Fisher. 1987 "Improving inference through conceptual clustering," In Proc. 1987 Nat. Conf. Artificial Intelligence (AAAI’87), pp. 461–465, Seattle,WA.
[24] Blake C L, Merz C J. UCI Repository of Machine Learning Database [EB/OL].[20011-03-15]. http://www.ics.uci.edu/ MLRepository.html.
[12] T. Kohonen 1990 "The self-organizing map," Proceedings of the IEEE, 78(9):1464–1480,.
[25] Y.M. Yang, 1999 An evaluation of statistical approaches to text categorization, Journal of Information Retrieval 1 (1-2) 6788.
[13] Q.J. Mac 1967 Some methods for classification and analysis of multivariate observations, in: Proceedings of the Fifth Berkeley Symposium, vol. 1. pp. 281297. [14] J.M. Pen, J.A. Lozano, P. Larraaga, 1999 An empirical comparison of four initialization methods for the K-means algorithm, Pattern Recognition Letter 20, 10271040.
[26] A. Asuncion and D.J. Newman, University of California, Dept. of Information and Computer Science. The UCI Machine Learning Repository http://mlearn.ics.uci.edu/ MLRepository.html . Last visit May. 3, 2011
6