An interactive Java applet for teaching discrete-time system theory Pierre-Martin Tardif and André Zaccarin Department of electrical and computer engineering Laval University, Ste-Foy, Qc, Canada, G1K 7P4 email:
[email protected] [email protected] Abstract - In this paper, we present a Java applet used for teaching discrete-time system theory to electrical and computer engineering students. The objective of the applet is to show students the relation between the position and number of poles and zeros in the Z-plane with the frequency and impulse responses of the linear system defined by these poles and zeros.
Introduction As a part of the Canadian Tele-Learning network of centers of excellence, under the theme Multimedia Interactive Learning Environment with Simulation (Miles, http:// www.gel.ulaval.ca/miles/), we are developing interactive learning tools to teach discrete-time systems theory to undergraduate students in electrical and computer engineering. Whenever digital signals are used, concepts from the theory of discrete time systems are involved. Engineers who design or use digital systems need to understand these theoretical concepts. Engineering students, however, often have trouble understanding and grasping these concepts because of the mathematics used to describe them. The interactive tools we are developing will illustrate fundamental properties of digital systems by simulating such systems. They will help the students develop some intuition about the behavior of discrete-time systems without using mathematics. The interactive tools are developed in JAVA, which facilitates their integration to the World Wide Web and makes them platform independent. Z-transform is a convenient mathematical tool for representing, analyzing discrete-time systems and signals, as well as designing discrete-time systems. A good understanding of the Z-transform and Z-plane representation is therefore important for anyone developing or implementing digital signal processing systems. Teaching of the Z-transform is typically based on manipulating mathematical equations, and students usually never develop any intuition about the representation of systems in the Zplane. Our objective is to help students learn these important concepts by providing them with a simulation environment that will help them develop this intuition. The first JAVA applet that we have written (http:// www.gel.ulaval.ca/~tardif/Miles/index.html), and which is the subject of this paper, allows the student to build a discrete-time system using their representation in the “Z
plane” and then visualize its frequency and impulse responses. The frequency and impulse responses are continuously updated, so that any change made by the students to the location and/or number of poles and zeros are automatically registered. The abstract Z-plane representation is therefore automatically “translated” to a representation - frequency response - for which the engineering student has already a good understanding. This should then help the student to develop some intuition about the z-plane representation and the impulse response of a system. In this paper, we will first describe the applet we have developed and introduce how it can be used for teaching. This will be followed by a technical description of the applet.
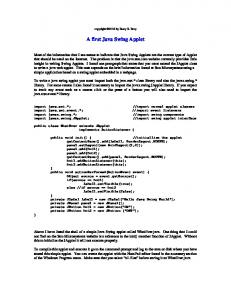
Description of the applet When the applet is first accessed by a student, the Z-plane diagram on which the unit circle is drawn appears on the student’s browser (Figure 1). At the same time, a window
Figure 1. Z-plane diagram drawn by the applet on the student browser. The poles (x) and zeros (o) are added by the student to define a discrete-time system. containing the control panel of the applet is open (Figure 2). The student uses this panel to define how he or she will place poles and zeros on the Z-plane diagram. This can be done in two different ways: 1) by pointing-and-clicking the mouse at the desired location of the pole/zero in the z-plane diagram, or 2) by entering their numerical coordinates (rectangular or
Figure 2. Control panel for the applet. This panel is used to define how the poles and zeros are added, removed or moved. polar). There are several options to control the location of the poles/zeros: the precision on the coordinates can be fixed to 0.1, 0.01 or unlimited, the poles and zeros can be forced to be on the real or imaginary axis or the unit circle. Systems defined by the applet are always real which means that nonreal poles and zeros are automatically entered in conjugate pairs. Besides adding new poles and zeros to the unit circle, the student can also erase poles and zeros by point-and-click or by specifying their numerical coordinates. Poles and zeros can also be moved by drag-and-drop. Figures 3-5 show the frequency response, amplitude
Figure 4. Phase of the frequency response as plotted by the applet
Figure 5. Impulse response as plotted by the applet.
Figure 3. Module of the frequency response as plotted by the applet. (AR) and phase (PR) and the impulse response(IR) of a discrete-time system as the student can see it. These windows are opened from the control panel. The responses displayed are those of the system described by the poles and zeros drawn on the Z-plane diagram (in this case, of Figure 1). The important characteristic of these responses is that they are continuously updated. This means that when the discrete-time system is modified, either by adding, removing
or simply moving a pole or a zero, the frequency and impulse response displayed are the one of the new system. This is the most important feature of the applet. It allows a student, for example, to directly observe the effect, on the frequency response of the system, of moving a pole in the Z-plane. A number of options are also available on the windows displaying the frequency response: the amplitude can be displayed on a linear or log scale, the phase can be given in radiants or degrees, the frequency scale can be expanded or contracted to show the periodicity of these responses. Also, the amplitude or phase value at the position of the cursor is displayed on the window. Frequency and impulse responses
windows can also be resized.
Using the applet As we mentioned in the introduction, the objective of the applet is to demonstrate to the students the relation between poles/zeros diagram and the frequency and impulse responses of a discrete-time system, and illustrate a number of important basic properties of these systems. Some of these properties that can be shown with the applet: are: effect of pole or zero on the unit circle on the AR, effect of pole outside the unit circle on the IR, effect of adding poles or zeros on the PR, and the delay added to the IR, effect of the distance of a pole/zero from the unit circle on a peak of the AR, location of poles and zeros of linear phase filter, all-pass filters, finite or infinite impulse response filters, etc. For all these important concepts, the applet will show to the student the relation between the pole/zero diagram and the frequency and impulse responses. It will give the student some intuition about the z-plane representation of discrete-time filters. We hope that this intuition will motivate students, help them understand the mathematics used to represent discrete-time systems, and make them realize that these mathematics are an efficient way to represent these systems as well as they are necessary to manipulate and design discrete-time systems.
Technical description of the applet In this section, we will briefly described Java and justify its use for our simulation environment. The algorithm used to compute frequency and impulse response will then be presented followed by some details on the design of the computer program.
platform dependance of the graphical layout (depends on the local window manager), etc. Other platforms or languages were also considered for the development of our simulation environment: Matlab, Mathematica, C/C++. The first two were eliminated because they are not free, must be executed on the host machine, and they do not allow remote graphical display, except on a Unix environment. As for the C/C++ languages, they were eliminated because there is no standard graphical package for all platforms and because programs written in those languages are seldom completely portable. Interface design We had to choose between a stand alone application, which requires an interpreter, and an applet, which requires a Javaenabled WWW browser. We chose the later since the students only have to visit the class Web site to execute the program. Interface design was then the first prototyping step. We decided to include the commands in a single window. Grouping the menu and plots in the browser main window was considered. It was decided not to used that approach since we have no control over the browser window size (depends on local screen resolution and user interactions with the browser). We decided to leave the pole-zero diagram in the main browser window and use independent windows for the control panel and the frequency and impulse responses. Z-transform and frequency response Z-transform [3] is defined as
Why choose Java
Z
f ( n) ↔ F ( z)
Of the languages or software we had on hand, we decided to use Java [1] for the development of our simulation environment. The first version of Java for the Internet appeared in 1995. Since Java is so versatile and powerful, it has become the most used language for Internet programming. Sun describes Java as [2] “a simple, objectoriented, distributed, interpreted, robust, secure, architecture neutral, portable, high-performance, multithreaded, and dynamic language.” Java is interpreted and is based on a virtual machine (Java VM) instructions. A program source is first compiled into binary VM instructions. On the executing machine, these VM instructions are decoded locally one at a time or once with just in time compilation. Java is portable since all machine dependent aspects are solved by the interpreter. Drawbacks using Java come from the security limitations (unable to save data to a local disk), language immaturity (only at the first version, first major revision) and the
where F ( z ) = Z ( f ( n ) ) =
(1)
∞
–m ∑ f ( m) z .
m = –∞
In a linear shift invariant discrete system, the output O ( z ) is related to the input I ( z ) by the system transfer function H ( z ) : O ( z) = H ( z) I ( z) (2) From H ( z ) , we can derive the system output knowing its input by o ( t ) = Z –1 ( H ( z ) I ( z ) ) , where Z –1 is the
inverse z-transform. The inverse transform can be found by several means. The algorithm used in our applet is recursive. It is based on the synthetic division of the numerator by the denominator, expressed in ascending powers of z –1 : –1
–N
a0 + a1 z + … + aN z –1 O ( z ) = ----------------------------------------------------------–1 – M- = x ( 0 ) + x ( 1 ) z + … (3) b0 + b1 z + … + bM z
where O ( z ) is the z-transform of a causal sequence, a i and b i are the numerator and denominator coefficients
respectively, N is the numerator order and M is the denominator order ( N ≤ M and b 0 ≠ 0 since the sequence is assumed to be causal). x ( i ) is the inverse transform value at instant i , and can be defined as: i 1 ---x ( i) = b ai – ∑ x ( i – n) bn (4) 0 n=1 The recursion is initialized using x ( 0 ) = a 0 ⁄ b 0 . Since Z ( δ ( n ) ) = 1 , the inverse z-transform of the transfer
function is the impulse response of the system. Frequency response of the system H ( z ) is found by l e t t i n g z = e jwT . H ( e jwT ) i s a c o m p l e x n u m b e r A ( w ) ∠φ ( w ) , where A ( w ) is the amplitude and φ ( w ) is the phase of the frequency response of H ( z ) . Program design The Java program was designed from bottom up. The basic interface functions are divided in six classes: Diagram, DrawingCanvas, MyPoint, MyPoints, MyWindow and ZPlaneMenu (Table 1). Complex and Polynomial classes were then defined respectively for mathematical operations on complex numbers, and for polynomials multiplication/ division, and construction from a set of Complex numbers. Impulse response is defined in the DrawTimeResponse class. It inherits from MyWindow and computes the impulse response by building two polynomials, one for D ( z ) (using poles) and one for N ( z ) (using zeros). Plot of the long division computation N ( z ) ⁄ D ( z ) , using recursion (4), is done by MyWindow (using DrawingCanvas instance). FreqResp class inherits from MyWindow and computes frequency response by evaluating N ( e –jwT ) and D ( e –jwT ) , and dividing them to get H ( e jwT ) . It also draws the amplitude and the phase of the frequency response. Since – jwT ) i s a s t a t i c m e m b e r o f F re q R e s p a n d H (e DrawingCanvas is not (from MyWindow), independent drawing of amplitude and phase is possible. Finally, Applet1
class inherits from java.awt.Applet and has instances of D i a g r a m , D r a w Ti m e R e s p o n s e , D r a w F re q A m p , DrawFreqPhase and ZPlaneMenu. Applet initialization, execution and termination are done within this class.
Conclusion A simulation environment for discrete-time system theory was presented. It was designed using Java, and the applet can be visualized on-line by any WWW Java-enabled browsers. Using the Java language was a good choice since the applet can provide real-time simulation of the user‘s interactions. Students were able to shortly experience with our applet during the fall trimester of 1996 in a Discrete-Time Signals and Systems class. The applet will be fully used for the first time during the fall trimester of 1997. Future developments of the simulation environment include an applet with which the student will be able to choose or define an input signal, and observe the output signal for the discrete-time system defined by the pole and zero diagram. An applet to show the computation of discretetime convolutions is also planed. We should finally point out that similar applets have been developed at other universities, but of the ones we have found, none offers all the options and flexibility of the applet we have developed. We also recently found a similar simulation program at the Georgia Institute of Technology (http://www.ece.gatech.edu/users/grimace/pez/Demos/ index.html). It is, however, a Matlab program, which means that is not as easily accessible as our applet.
References 1) Cornell, G., Horstmann, C.S., “Core Java”, The SunSoft Press, 1996. 2) http://java.sun.com/whitePaper/java-whitepaper-1.html 3) Oppenheim, A., Schafer, R., “Discrete-Time Signal Processing”, Prentice-Hall, 1989.
Table 1: Basic interface classes Name
Inherits from
Diagram
java.awt.Panel
DrawingCanvas MyPoint
java.awt.Canvas java.lang.Object
MyPoints
java.lang.Object
MyWindow
Java.awt.Frame
ZPlaneMenu
Java.awt.Frame
What is does Draw z-plane diagram, poles and zeros (objects MyPoints) from user commands (point-and-click or drag-and-drop), and messages from ZPlaneMenu. Plots data arrays and manages axis location and scaling. Single pole or zero location in the Diagram class. Collection of poles and zeros and corresponding representation in the z-plane diagram (“o” or “x”). Generates pop-up windows (window management and on-line help) and registers mouse actions. Handles commands for pole and zero manipulation, and the window display.